I. INTRODUCTION
Hydroxyzine dihydrochloride (brand names Atarax®, Vistaril®, and others) is a piperazine histamine H-1 receptor antagonist that blocks the binding of histamine in capillaries, bronchial smooth muscle, and gastrointestinal smooth muscle (NIH, 2018). For this reason, it can be used to treat bronchial asthma and can be used as a sedative (Martindale and Reynolds, Reference Martindale and Reynolds1993). It can also be used to treat anxiety (Ferreri and Hantouche, Reference Ferreri and Hantouche1998). Hydroxyzine has been ranked in the top 200 US prescriptions the past several years. The IUPAC name (CAS Registry number 2192-20-3) is 2-[2-[4-[(4-chlorophenyl)-phenylmethyl]piperazin-1-yl]ethoxy]ethanol dihydrochloride. A two-dimensional molecular diagram is shown in Figure 1.

Figure 1. The molecular structure of the hydroxyzine dication in hydroxyzine dihydrochloride.
A low–precision experimental powder pattern is contained in the Powder Diffraction File™ as entry 00-031-1731 (Tsau and DeAngelis, Reference Tsau and DeAngelis1981) as a private communication from Wyeth Laboratories. Powder data is also reported in Tsau and DeAngelis (Reference Tsau and DeAngelis1978).
This work was carried out as part of a project (Kaduk et al., Reference Kaduk, Crowder, Zhong, Fawcett and Suchomel2014) to determine the crystal structures of large-volume commercial pharmaceuticals, and include high-quality powder diffraction data for these pharmaceuticals in the Powder Diffraction File (Fawcett et al., Reference Fawcett, Kabekkodu, Blanton and Blanton2017).
II. EXPERIMENTAL
Hydroxyzine dihydrochloride was a commercial reagent, purchased from U.S. Pharmacopeial Convention (Lot # K2L503), and was used as-received. The white powder was packed into a 1.5 mm diameter Kapton capillary, and rotated during the measurement at ~50 Hz. The powder pattern was measured at 295 K at beam line 11-BM (Lee et al., Reference Lee, Shu, Ramanathan, Preissner, Wang, Beno, Von Dreele, Ribaud, Kurtz, Antao, Jiao and Toby2008; Wang et al., Reference Wang, Toby, Lee, Ribaud, Antao, Kurtz, Ramanathan, Von Dreele and Beno2008) of the Advanced Photon Source at Argonne National Laboratory using a wavelength of 0.414157 Å from 0.5–50° 2θ with a step size of 0.001° and a counting time of 0.1 s/step. The beamline staff indicated that some peaks of the sample showed slight loss of intensity with exposure, suggesting beam damage during the measurement.
The pattern was indexed on a primitive monoclinic unit cell with a = 11.490, b = 7.425, c = 14.995 Å, β = 110.48°, V = 1198.4 Å3, and Z = 2 using DICVOL as incorporated into FOX (Favre-Nicolin and Černý, Reference Favre-Nicolin and Černý2002) and N-TREOR (Altomare et al., Reference Altomare, Cuocci, Giacovazzo, Moliterni, Rizzi, Corriero and Falcicchio2013). A reduced cell search in the Cambridge Structural Database (Groom et al., Reference Groom, Bruno, Lightfoot and Ward2016) combined with the chemistry C, H, N, O, and Cl only yielded no hits. A connectivity search on hydroxyzine yielded a 1,3-dihydroxy-2-(hydroxymethyl)propan-2-aminium hemipentahydrate salt (Majumder et al., Reference Majumder, Deb, Husain, Jana and Dastidar2015), a 1-naphthylmethanaminium dihydrate salt (Majumder et al., Reference Majumder, Deb, Husain, Jana and Dastidar2015), and a picrate salt (Jasinski et al., Reference Jasinski, Butcher, Siddegowda, Yathirajan and Ramesha2010). Analysis of the systematic absences suggested the space group P2 1 (#4), which was confirmed by successful solution and refinement of the structure. The structure was solved with FOX (Favre-Nicolin and Černý, Reference Favre-Nicolin and Černý2002) and DASH (David et al., Reference David, Shankland, van de Streek, Pidcock, Motherwell and Cole2006) using a hydroxyzine molecule and two chlorine atoms as fragments. In FOX, one solution out of 25 runs had a much lower cost function than the others. The best solutions from DASH had different conformations of the side chain, but were otherwise similar.
Rietveld refinement was carried out using GSAS (Toby, Reference Toby2001; Larson and Von Dreele, Reference Larson and Von Dreele2004). Only the 1.5–20.0° portion of the pattern was included in the refinement (d min = 1.192 Å). All non-H bond distances and angles were subjected to restraints, based on a Mercury/Mogul Geometry Check (Bruno et al., Reference Bruno, Cole, Kessler, Luo, Motherwell, Purkis, Smith, Taylor, Cooper, Harris and Orpen2004; Sykes et al., Reference Sykes, McCabe, Allen, Battle, Bruno and Wood2011) of the molecule. The Mogul average and standard deviation for each quantity were used as the restraint parameters. The two aromatic rings were restrained to be planar within 0.02 Å. The restraints contributed 5.3% to the final χ2. The hydrogen atoms were included in calculated positions, which were recalculated during the refinement using Materials Studio (Dassault, 2016). Positions of the active hydrogens were derived by analysis of potential hydrogen bonding patterns. A common U iso was refined for the carbon atoms of the two aromatic rings, another U iso for the C4N2 saturated ring, and another for the non-hydrogen atoms of the side chain. The three chlorine atoms were refined anisotropically. The U iso for each hydrogen atom was constrained to be 1.3 × that of the heavy atom to which it is attached. The peak profiles were described using profile function #4 (Thompson et al., Reference Thompson, Cox and Hastings1987; Finger et al., Reference Finger, Cox and Jephcoat1994), which includes the Stephens (Reference Stephens1999) anisotropic strain broadening model. The background was modeled using a 1-term shifted Chebyshev polynomial, with a 6-term diffuse scattering function to model the Kapton capillary and any amorphous component.
In the initial refinement, the Uiso for the non-hydrogen atoms of the side chain refined to a very large value of 0.26 Å2. A density functional geometry optimization (fixed experimental unit cell) was carried out using VASP (Kresse and Furthmüller, Reference Kresse and Furthmüller1996). The calculation used the GGA-PBE functional, a plane wave cutoff energy of 400.0 eV, and a k-point spacing of 0.5 Å−1 leading to a 2 × 2 × 1 mesh. The calculation used 16 processors on a HP Proliant server and took 6.7 h. A density functional geometry optimization was also carried out using CRYSTAL14 (Dovesi et al., Reference Dovesi, Orlando, Erba, Zicovich-Wilson, Civalleri, Casassa, Maschio, Ferrabone, De La Pierre, D-Arco, Noël, Causà and Kirtman2014). The basis sets for the H, C, N, and O atoms were those of Gatti et al. (Reference Gatti, Saunders and Roetti1994), and the basis set for chlorine was that of Peintinger et al. (Reference Peintinger, Vilela Oliveira and Bredow2013). The calculation was run on eight 2.1 GHz Xeon cores (each with 6 Gb RAM) of a 304-core Dell Linux cluster at IIT, using 8 k-points and the B3LYP functional, and took ~77 h.
The agreement of the Rietveld refinement and the VASP optimized structure was acceptable (RMS Cartesian Displacement = 0.17 Å, maximum = 0.464 Å), but agreement with the CRYSTAL14 calculation was much poorer. The two DFT calculations optimized with different conformations of the side chain. The Rietveld refinement was restarted with equal populations of both side chains and the occupancy of the conformations was refined with a constrained total occupancy of unity.
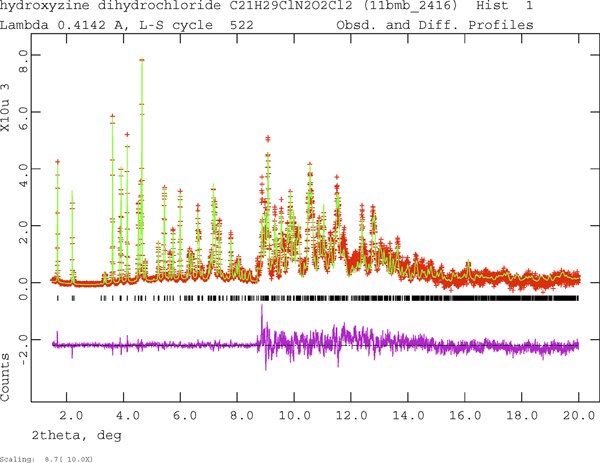
The final refinement of 146 variables using 18581 observations (18500 data points and 81 restraints) yielded the residuals R wp = 0.0689, R p = 0.0549, and χ 2 = 1.978. The refinement was much better than a single conformation model and yielded much more reasonable U iso. Rietveld refinements of the (fixed) DFT-optimized comformations 1 and 2 yielded R wp = 0.215 and 0.170 respectively. The largest peak (0.74 Å from C49) and hole (0.06 Å from Cl54) in the difference Fourier map were 0.44 and −0.56 eÅ−3, respectively. The Rietveld plot is included as Figure 2. The largest errors in the fit are in the shapes and intensities of some of the strong, low angle peaks, consistent with beam damage.

Figure 2. (Color online) The Rietveld plot for the refinement of hydroxyzine dihydrochloride. The red crosses represent the observed data points, and the green line is the calculated pattern. The magenta curve is the difference pattern, plotted at the same vertical scale as the other patterns. The vertical scale has been multiplied by a factor of 10 for 2θ > 8.7°.
III. RESULTS AND DISCUSSION
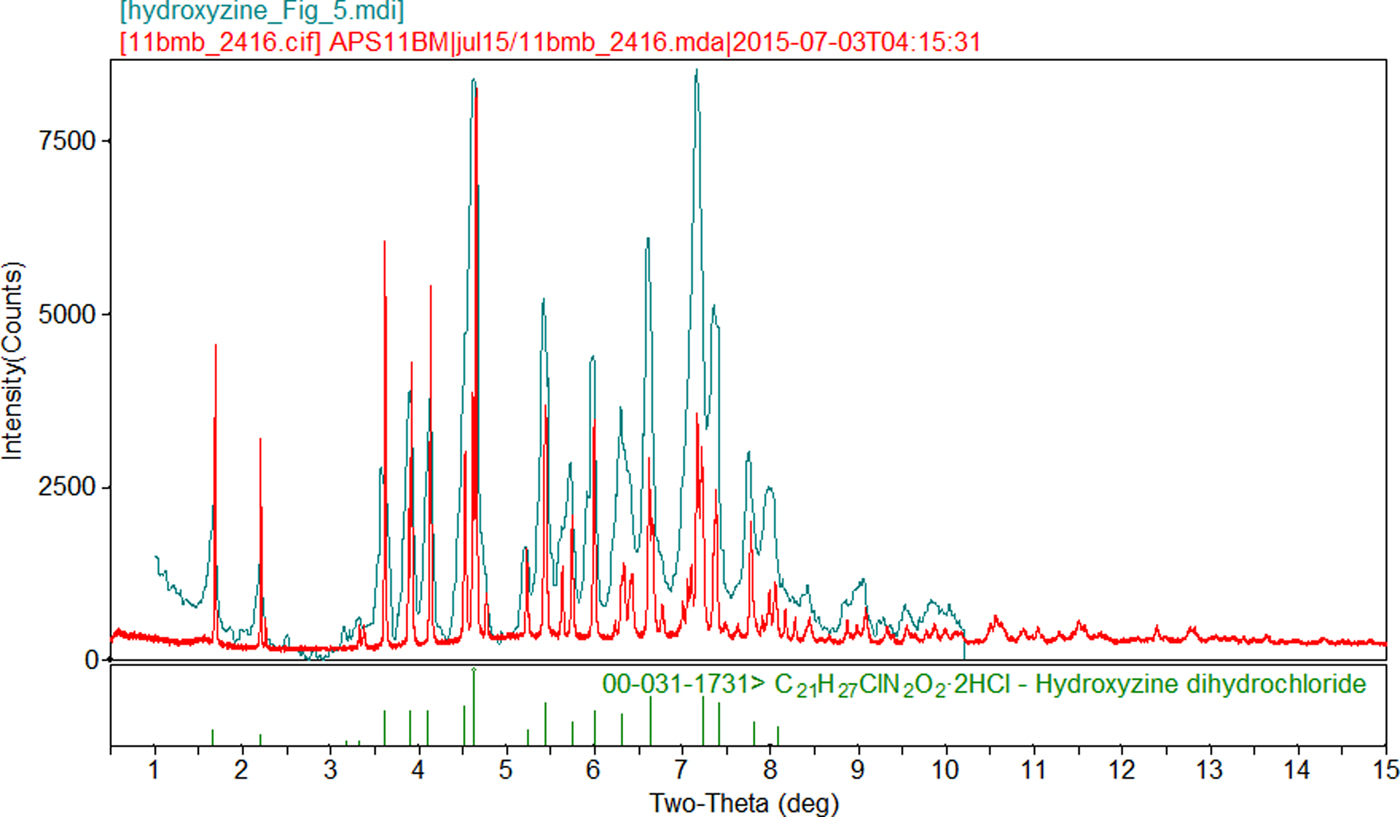
The experimental powder pattern of hydroxyzine dihydrochloride matches those of PDF entry 00-031-1731 and Tsau and DeAngelis (Reference Tsau and DeAngelis1978) well enough to conclude that the materials are the same (Figure 3).

Figure 3. (Color online) Comparison of the synchrotron powder diffraction pattern to the laboratory X-ray powder diffraction patterns of hydroxyzine dihydrochloride (Tsau and DeAngelis, Reference Tsau and DeAngelis1978, Reference Tsau and DeAngelis1981). The literature pattern (hydroxyzine_Figure_5, measured using Cu Kα radiation) was digitized using UN-SCAN-IT (Silk Scientific, 2013), and re-scaled to the synchrotron wavelength of 0.414157 Å using Jade 9.8 (MDI, 2017).
The refined atom coordinates of hydroxyzine dihydrochloride and the coordinates from the DFT optimizations are reported in the CIFs attached as Supplementary Material. (DFT codes cannot currently handle disordered structures, so each conformation was optimized separately.) The major (conformation 1; 70% occupancy) and minor (conformation 2; 30% occupancy) cation conformations optimized in CRYSTAL14 are compared in Figure 4. The RMSD is 0.3866 Å and the maximum displacement is 1.0614 Å. Several of the atoms in the side chain differ by comparable values. The CRYSTAL14 (conformation 2) and VASP (conformation 1) results differ significantly (Figure 5). The RMSD is 0.4431 Å and the maximum displacement is 1.2637 Å at C32. The conformation of the saturated ring differs between the two calculations, but the side chains are similar. The orientation of the phenyl rings differ by more than what might be expected. The presence of side chain-phenyl close contacts means that different side chain conformations may affect the ring orientations. The RMSD between the non-side chain atoms of the refined and optimized molecule vary from 0.06 to 0.22 Å, depending on the optimization (CRYSTAL14 or VASP, conformation 1 or conformation 2). The good agreement of the non-disordered part of the molecule provides evidence that the refined structure is correct (van de Streek and Neumann, Reference van de Streek and Neumann2014). The asymmetric unit (with atom numbering) is illustrated in Figure 6, and the crystal structure is presented in Figure 7.
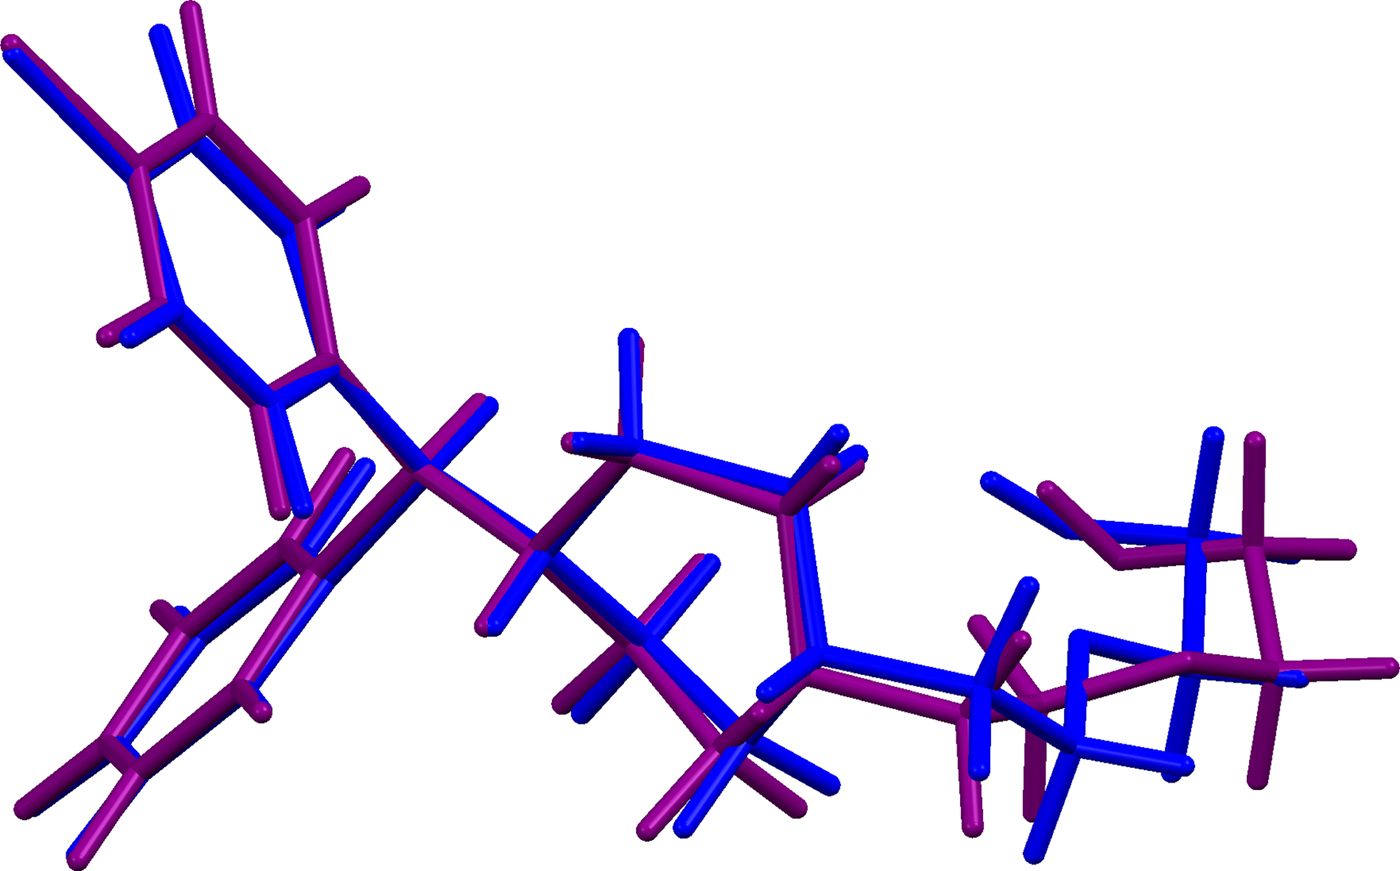
Figure 4. (Color online) Comparison of the CRYSTAL14-optimized structures of cation conformation 1(blue) and conformation 2 (purple) in hydroxyzine dihydrochloride.
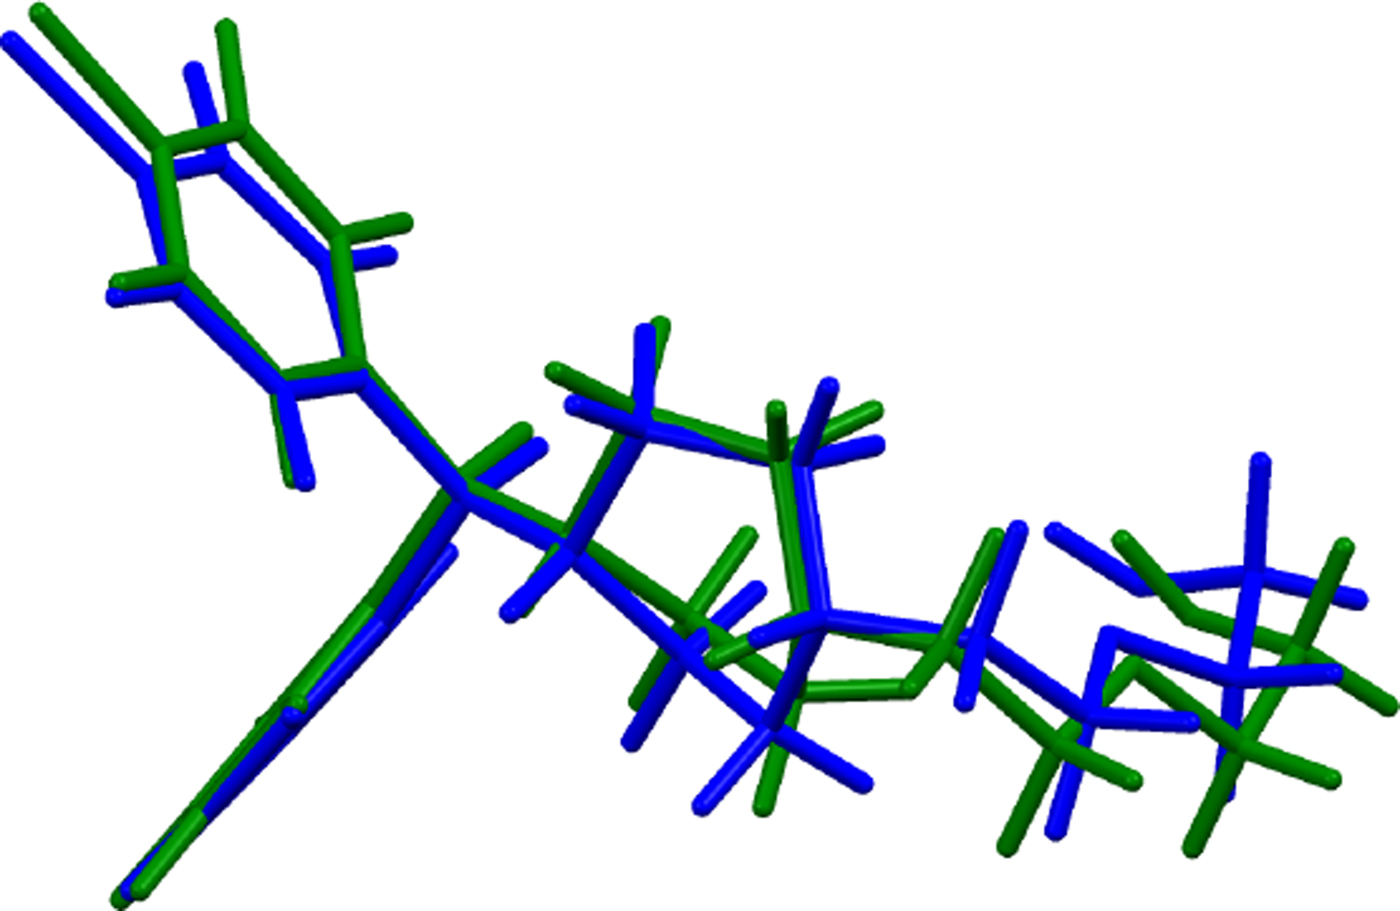
Figure 5. (Color online) Comparison of the CRYSTAL14- (blue) and VASP-optimized (green) structures of cation conformation 1 in hydroxyzine dihydrochloride.

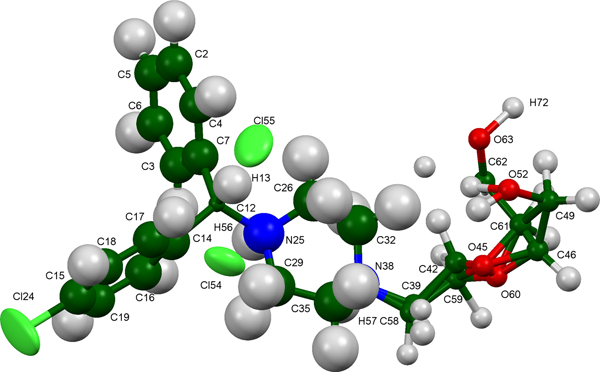
Figure 6. (Color online) The asymmetric unit of hydroxyzine dihydrochloride, with the atom numbering. The atoms are represented by 50% probability ellipsoids.

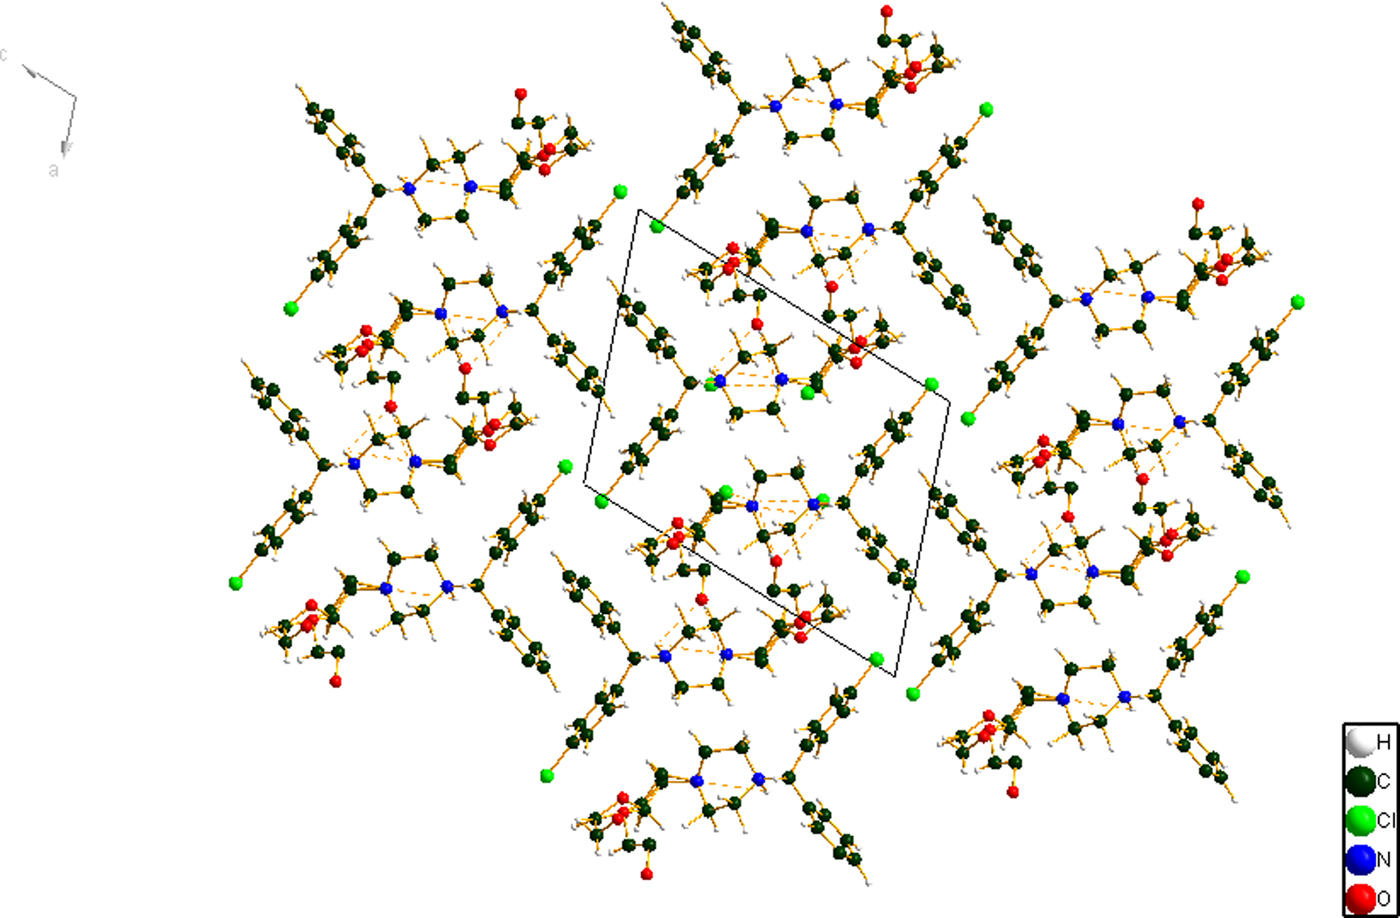
Figure 7. (Color online) The crystal packing of hydroxyzine dihydrochloride, viewed down the b-axis.
The crystal structure consists of alternating polar (which includes the cation-anion interactions and hydrogen bonds) and nonpolar layers parallel to the ab-plane. The C6H5 and chlorinated phenyl rings lie adjacent to each other. Parallel stacking of the phenyl rings is prominent. Population analysis provides evidence of inter-ring C-H interactions, so the stacking has both electronic and geometrical components.
All of the bond distances and bond angles, and most of the torsion angles fall within the normal ranges indicated by a Mercury Mogul Geometry check (Macrae et al., Reference Macrae, Bruno, Chisholm, Edington, McCabe, Pidcock, Rodriguez-Monge, Taylor, van de Streek and Wood2008). In conformation 1, the C42-C39-N38-C32 torsion angle is unusual [Figure 8(a)]. In conformation 2, the O45-C42-C39-N38 torsion angle is flagged as unusual [Figure 8(b)], reflecting the boat conformation of this ring. Since the protonated nitrogen atoms of this ring form strong hydrogen bonds to the chloride anions, the unusual ring conformations are not unreasonable. Conformation 1 is less unusual than conformation 2, consistent with it being the major conformation.
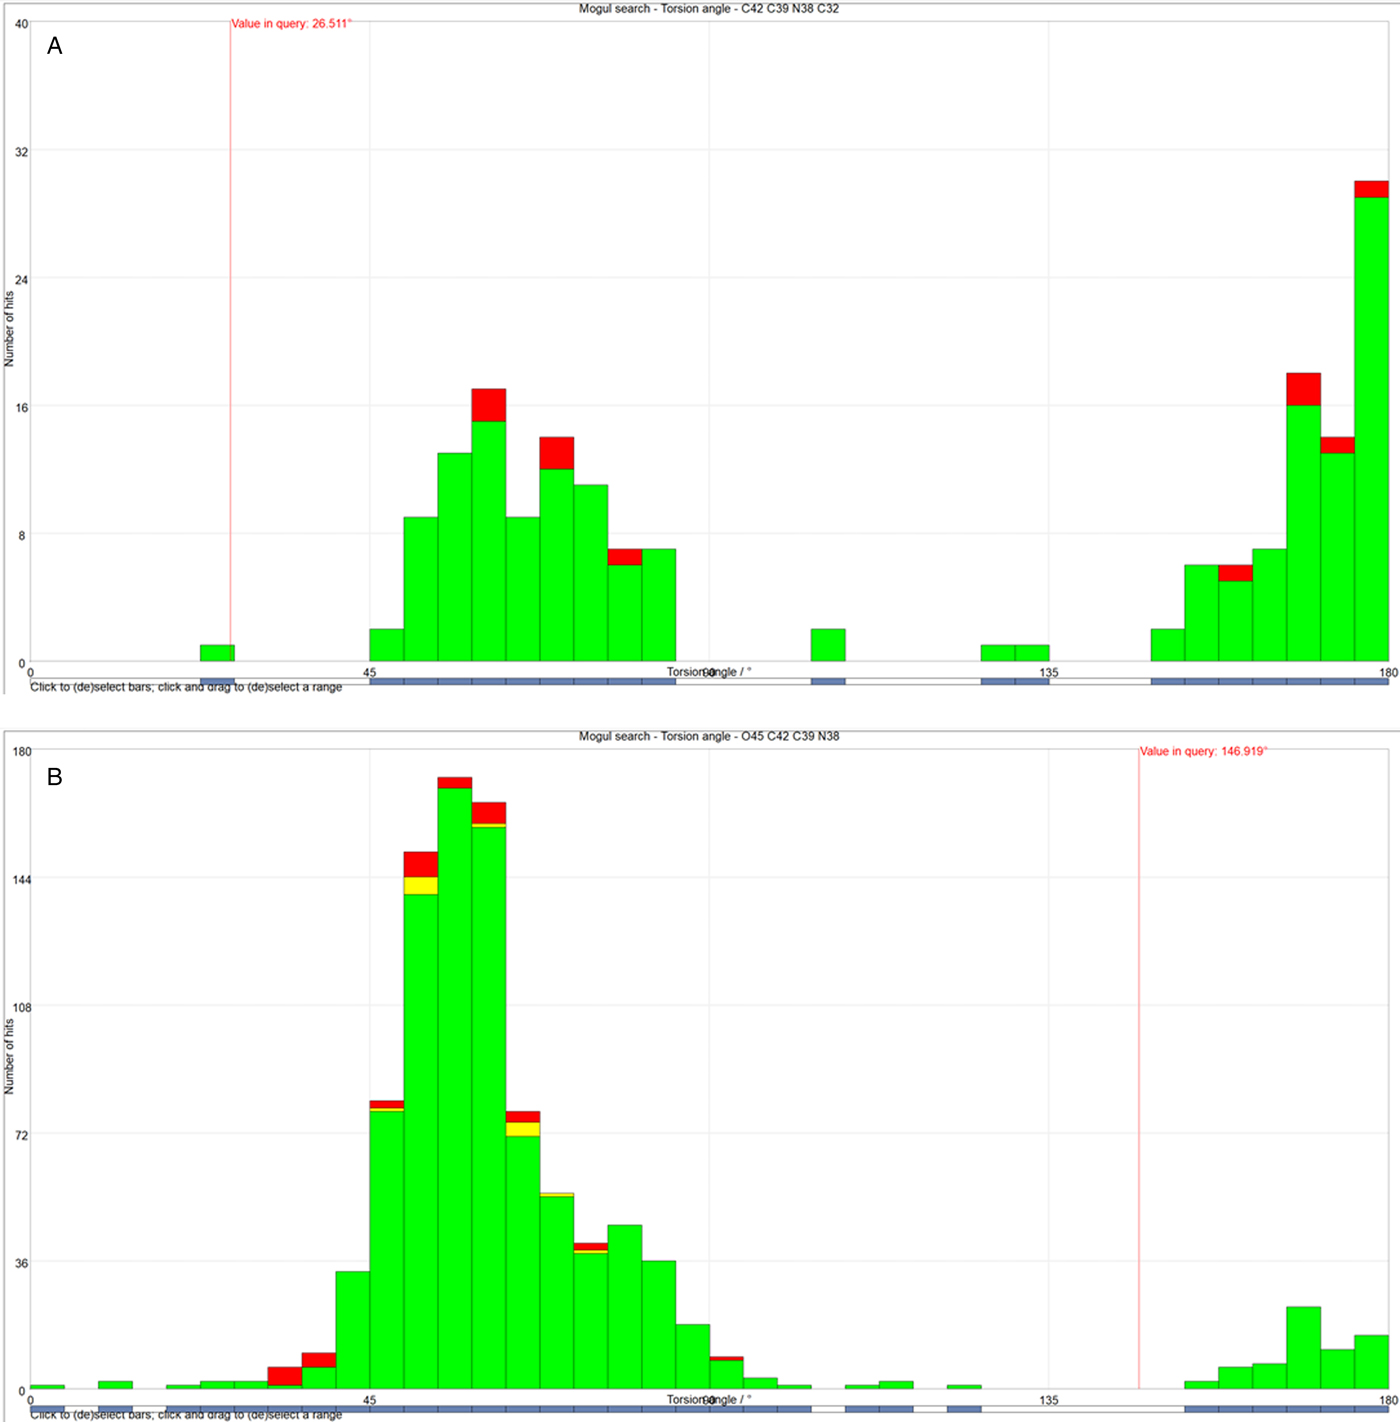
Figure 8. (Color online) (a) The unusual C42-C39-N38-C32 torsion angle in conformation 1, compared to the Mogul distribution of similar torsion angles. The x-axis is the torsion angle, and the y-axis is the number of hits. The green bars represent the hits in Version 5.39 of the CSD, and the red and yellow bars are entries in successive updates. The vertical red line indicates the observed torsion angle, and the fact that it does not lie in a peak of the distribution marks this angle as unusual. (b) The unusual O45-C42-C39-N38 torsion angle in conformation 2, compared to the Mogul distribution of similar torsion angles. The x-axis is the torsion angle, and the y-axis is the number of hits. The green bars represent the hits in Version 5.39 of the CSD, and the red and yellow bars are entries in successive updates. The vertical red line indicates the observed torsion angle, and the fact that it does not lie in a peak of the distribution marks this angle as unusual.
The energies of the optimized structures of conformation 1 and 2, using CRYSTAL14, are within 1 kcal mol−1 of each other. The VASP energies of the two conformations are within 2 kcal mol−1 of each other. Both of these values are comparable to the expected uncertainty in the energy of such calculations.
Quantum chemical geometry optimizations (DFT/B3LYP/6-31G*/water) using Spartan'16 (Wavefunction Inc., 2017) indicated that conformation 1 of the hydroxyzine cation in hydroxyzine dihydrochloride is 249.3 kcal mol−1 higher in energy than the local minimum energy conformation and conformation 2 of the hydroxyzine cation in hydroxyzine dihydrochloride is 166.2 kcal mole−1 higher in energy than its local minimum energy conformation. The differences occur primarily in the side chains and the saturated ring, but also include differences in the orientations of the aromatic rings. The local minimum of conformation 1 is 2.6 kcal mol−1 lower in energy than the local minimum of conformation 2. Molecular mechanics conformational analysis indicated that the global minimum energy conformation has a more compact conformation, with the hydroxyl end of the molecule curled towards the rest of the molecule to accept a hydrogen bond, and thus that intermolecular interactions are important in determining the solid state conformation.”
Analysis of the contributions to the total crystal energy using the Forcite module of Materials Studio (Dassault, 2016) suggests that angle, bond, and torsion distortion terms are significant in the intramolecular deformation energy. The intermolecular energy contains significant contributions from van der Waals repulsion and electrostatic attractions, which in this force-field-based analysis include hydrogen bonds. The hydrogen bonds are better analyzed using the results of the DFT calculation.
The crystal structure is dominated by hydrogen bonds. Since the DFT calculations require ordered crystal structures, separate calculations were carried out for conformations 1 and 2 (Tables I and II). As expected, each of the protonated nitrogen atoms forms a very strong hydrogen bond to one of the chloride anions. In conformation 2, N38-H57 forms a bifurcated hydrogen bond to both Cl54 and Cl55. The hydroxyl group O52-H53 forms a strong hydrogen bond to Cl54 in both conformations. In both conformations, there are four C-H⋯Cl hydrogen bonds to Cl55. In conformation 1, there is one C-H···Cl hydrogen bond to Cl24, while in conformation 2 there are two such hydrogen bonds to Cl24. The central carbon C12-H13 also forms a C-H⋯Cl hydrogen bond to Cl55 in both conformations. In both conformations, there are several C-H⋯Cl hydrogen bonds between the side chain and Cl54. In conformation 2, there is an additional such hydrogen bond to Cl55. In both conformations, the hydroxyl oxygen, O52, acts as an acceptor from C26-H27. In conformation 1, O52 is also an acceptor from C39-H40. In both conformations, there is an intramolecular C26-H27⋯C7 hydrogen bond, which may help to determine the conformation of the saturated ring. In both conformations, there is a small overlap population between H44 and H47, because they are methylene groups on either side of the ether oxygen, O46.
Table I. Hydrogen bonds (CRYSTAL14) in hydroxyzine_1.

• = intramolecular.
Table II. Hydrogen bonds (CRYSTAL14) in hydroxyzine_2.

• = intramolecular.
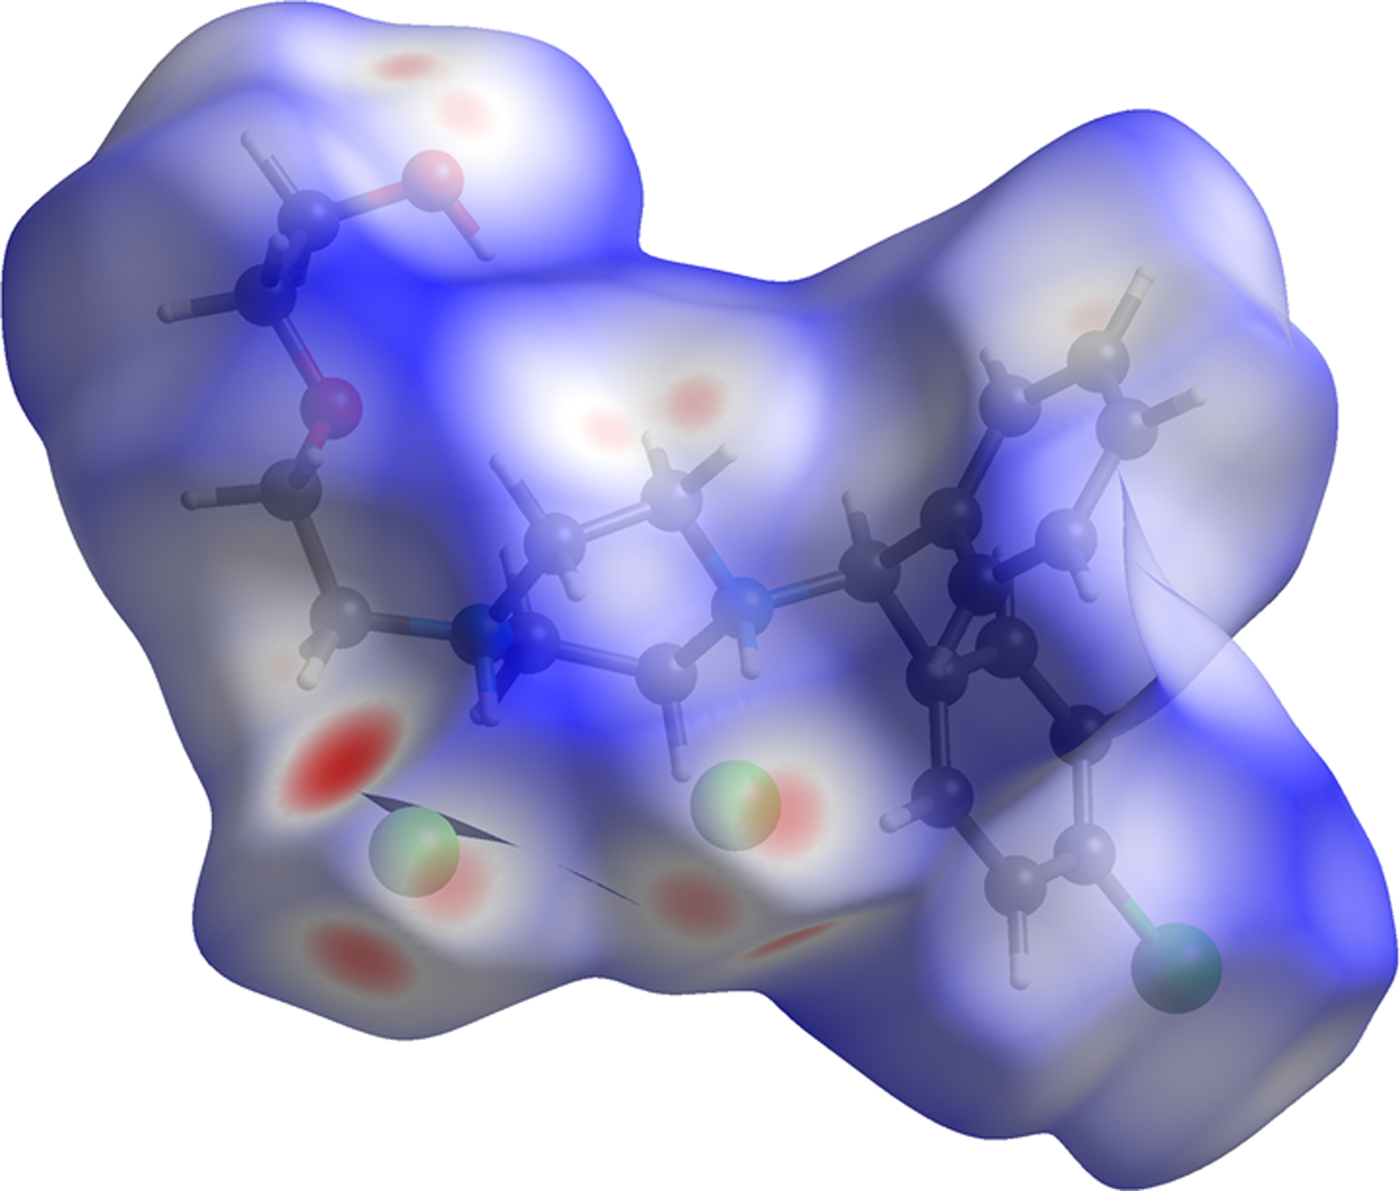
The volume enclosed by the Hirshfeld surface of conformation 1 (Figure 9; Hirshfeld, Reference Hirshfeld1977; Turner, et al., Reference Turner, McKinnon, Wolff, Grimwood, Spackman, Jayatilaka and Spackman2017) is 589.79 Å3, 98.54% of 1/2 the unit cell volume. The molecules are thus not tightly packed. All of the significant close contacts (red in Figure 9) involve the hydrogen bonds.

Figure 9. (Color online) The Hirshfeld surface of hydroxyzine dihydrochloride. Intermolecular contacts longer than the sums of the van der Waals radii are colored blue, and contacts shorter than the sums of the radii are colored red. Contacts equal to the sums of radii are white.
The Bravais-Friedel-Donnay-Harker (Bravais, Reference Bravais1866; Friedel, Reference Friedel1907; Donnay and Harker, Reference Donnay and Harker1937) morphology suggests that we might expect elongated morphology for hydroxyzine dihydrochloride, with {010} as the principal axis. A 6th-order spherical harmonic preferred orientation model was included in the Rietveld refinement; the texture index was 1.044, indicating that preferred orientation was present in this rotated capillary specimen. The powder pattern of hydroxyzine dihydrochloride derived from this synchrotron data set is included in the Powder Diffraction File™ as entry 00-066-1603.
SUPPLEMENTARY MATERIAL
The supplementary material for this article can be found at https://doi.org/10.1017/S0885715618000799.
ACKNOWLEDGEMENTS
Use of the Advanced Photon Source at Argonne National Laboratory was supported by the U. S. Department of Energy, Office of Science, Office of Basic Energy Sciences, under Contract No. DE-AC02-06CH11357. This work was partially supported by the International Centre for Diffraction Data. We thank Lynn Ribaud and Saul Lapidus for their assistance in the data collection, and Andrey Rogachev for the use of computing resources at IIT.
CONFLICTS OF INTEREST
The authors have no conflicts of interest to delcare.