


I. INTRODUCTION
Apatite-type materials can be used in the areas of bone replacement (Hench, Reference Hench1991), catalysis (Choudary et al., Reference Choudary, Sridhar, Kantam, Venkanna and Sreedhar2005), environmental remediation (Chen et al., Reference Chen, Wright, Conca and Peurrung1997), ultrafast lasers (Druon et al., Reference Druon, Chenais, Raybaut, Balembois, Georges, Gaume, Haumesser, Viana, Vivien, Dhellemmes, Ortiz and Larat2002), and ionic conductors (Arikawa et al., Reference Arikawa, Nishiguchi, Ishihara and Takita2000) depending on their chemical compositions. The control of cation site occupancy in apatite-type materials is of great importance for tuning their properties. With the aid of powder X-ray diffraction (XRD), Rietveld refinement, and high-resolution microscopy imaging techniques, it is possible to retrieve information on cation order-disorder, and cation site occupancies of apatite-type ceramics.
In our previous studies (White and Dong, Reference White and Dong2003; Shen et al., Reference Shen, Chen, Sun, Tok and Dong2010), issues related to AI and AII site crystallography in AI 4AII 6(BO4)6X 2 apatite was discussed in detail. Here AI and AII are cation sites with different symmetries. BO4 is the tetrahedron site and X is the anion site in the channel.
As AI and AII sites have a different size as well as the chemical environment, when two or more kinds of atoms occupy the A sites, the bigger atoms tend to enter AII preferentially (Dong and White, Reference Dong and White2004a, Reference Dong and White2004b). Longer annealing time is needed in order to achieve the equilibrium during the cation migration process. An example is the Pb/Ca substitution at AI and AII sites. More than 2 weeks annealing at 800 °C is required to establish the equilibrium occupancies of Ca/Pb in both AI and AII sites. When the composition and average ionic radii of AI site changes, the twist angle of the AI metaprism will change. The twisting of the metaprism will vary the lattice constants (White and Dong, Reference White and Dong2003).
For B site substitution, studies are very limited in comparison with that of A sites. B is in the centre of a tetrahedron site, having the same symmetry as the AII site for apatites with P6 3/m space group. When B sites are forced to fill with two or more kinds of atoms in synthetic apatites, the formation of equilibrium BO4 tetrahedron net may require higher temperature or longer time. There is also possibility of forming an ordering structure of BO4 polyhedra. In our previous research, endeavour has been made to incorporate V atoms into PO4 tetrahedra (Dong et al., Reference Dong, Kim, Lim, Laursen and White2003; Mercier et al., Reference Mercier, Dong, Baikie, Page, White, Whitfield and Mitchel2007; Dong and White, Reference Dong and White2008; Dong, Reference Dong, Tseng and Singh Nalwa2009; Lu et al., 2013). Ca and F are chosen to fill the AI, AII and X sites as calcium-fluorine apatites are well studied and understood.
In this study, X-ray Rietveld refinement and high-resolution transmission electron microscopy (HRTEM) are used as the fundamental tools to study the crystal structure of Ca10(VxP1−xO4)6F2 apatites. The structure description by a twist angle of AI-O6 metaprism are used, which can help understand the lattice constant variation in relation with B site size.
II. EXPERIMENTAL
Apatite minerals used for the present study were synthesized via chemical reaction route. CaO obtained by firing and decomposing AR grade CaCO3 at 900 °C, V2O5 and CaF2 powders were mixed in stoichiometric proportions in diluted orthophosphic acid and stirred for more than 2 h. For different Ca10(V1−xPxO4)6F2 samples with different x values, different amount of orthophosphic acid with 85% concentration was transferred into a beaker, after which deionized water was added to reach a 75 ml for each diluted solution. The sludge was dried at about 95 °C in an oven for 2 days, followed by heat treatment at 900 °C for 24 h. Powder XRD patterns were collected using a Siemens D5005 X-ray diffractometer fitted with Cu-tube that was operated at 40 kV and 40 mA. Divergence slit, anti-scatter slit, receiving slit and detector slit of 0.5°, 0.5°, 0.1 mm and 0.6 mm were aligned. Primary soller slit in the incident path and secondary sollar slit in the diffracted path were used to limit the beam divergence along the longitude of the above slits within 2.3°. Scans were collected from 10° to –140°2θ with a step size 0.01°, and counting time 5 s per step. Under these conditions the intensity of the strongest peak was 1500−2000 counts. Prior to data collection, the fired conglomerations were mechanically ground to fine powders to minimize crystal size effects. The XRD patterns were refined using Bruker Topas 2.1 Rietveld program with fundamental parameters approach (Cheary and Coehlo, Reference Cheary and Coelho1992, Reference Cheary and Coelho1998). For each compound four polynomial background co-efficient and peak shift because of zero error and sample displacement were refined. As no crystallographic data could be located for the complete series Ca10(VxP1−xO4)6F2, the starting model for refinement used the atomic positions from Ca10(PO4)6F2. (Sudarsanan et al., Reference Sudarsanan, Mackie and Young1972). For each model the occupancies of V and P at B site were refined. B-O bond length restrains (B-O = 1.54+0.2x Å was proposed for Ca10(VxP1−xO4)6F2) ranging from 1.54 Å to 1.74 Å in the tetrahedra were applied to ensure the V/P-O bond lengths within a reasonable range. Patterns were analysed systematically from the phosphorus to vanadium endmembers. For apatite samples with x higher than 0.7 in Ca10(VxP1−xO4)6F2 series, sintering at 900 °C for 24 h is not sufficient to reach the equilibrium as indicated by the XRD patterns and high RBragg values. For those samples, further annealing at 900 °C for 1 week was conducted.
TEM powder specimens were prepared by dispersing a small quantity of powders in ethanol under an ultrasonic bath for a few minutes, followed by dropping the suspension onto a holey-carbon coated copper-grid. HRTEM study was carried out in a JEOL JEM-3010 microscope operated under 300 kV. A Gatan double tilt holder was employed in order that a particular orientation could be found by tilting.
III. RESULTS AND DISCUSSIONS
A. Variations of unit cell parameters with chemical compositions
The lattice parameters of 11 apatite Ca10(VxP1−xO4)6F2 with x ranging from 0 to 1 were obtained by refining the XRD pattern using the Rietveld method. It was realized that the V occupancies in B site could deviate from stoichiometric compositions in the apatite series especially for higher V apatites Ca10(V0.8P0.2O4)6F2 and Ca10(V0.9P0.1O4)6F2. The structure of the endmember Ca10(VO4)6F2 were presented earlier (Dong and White, Reference Dong and White2004b) and it displayed P2 1/m symmetry. In our analysis, the series of apatites between the two end members Ca10(PO4)6F2 and Ca10(VO4)6F2 were displaying P6 3/m symmetry. As we did not synthesize apatites Ca10(V1−xPxO4)6F2 with 0.9 < x < 1.0, we are not sure whether there are monoclinic apatites with P2 1/m symmetry within this composition range.
The unit cell parameters for the apatites are shown in Figure 1. Twist angles that were calculated based on the AI, O1 and O2 atom positions (White and Dong, Reference White and Dong2003) and the B–O bond lengths obtained from Rietveld refinement are shown in Table I. As oxygen coordinates are only uncertain in the 3rd or 4th decimal place, the accuracy of <0.1° for the twist angles can be achieved. Unlike the series of PbxCa10−x(VO4)6F2 apatites with the twist angle changing systematically as a and c change, the twist angles for series Ca10(VxP1−xO4)6F2 have very limited changes from one member to another, except for the Ca10(V0.9P0.1O4)6F2 apatite that shows a value slightly lower than 23.0°. The projected apatite structure showing the twist angle is presented in Figure 2. The bond length values of AI-O1 or AI-O2 are within a relative narrow range, showing no trends of variation. The AII-O1 distance increases when B–O bond length increases from lower to higher V concentration as calculated from the results obtained (Dong, Reference Dong, Tseng and Singh Nalwa2009).
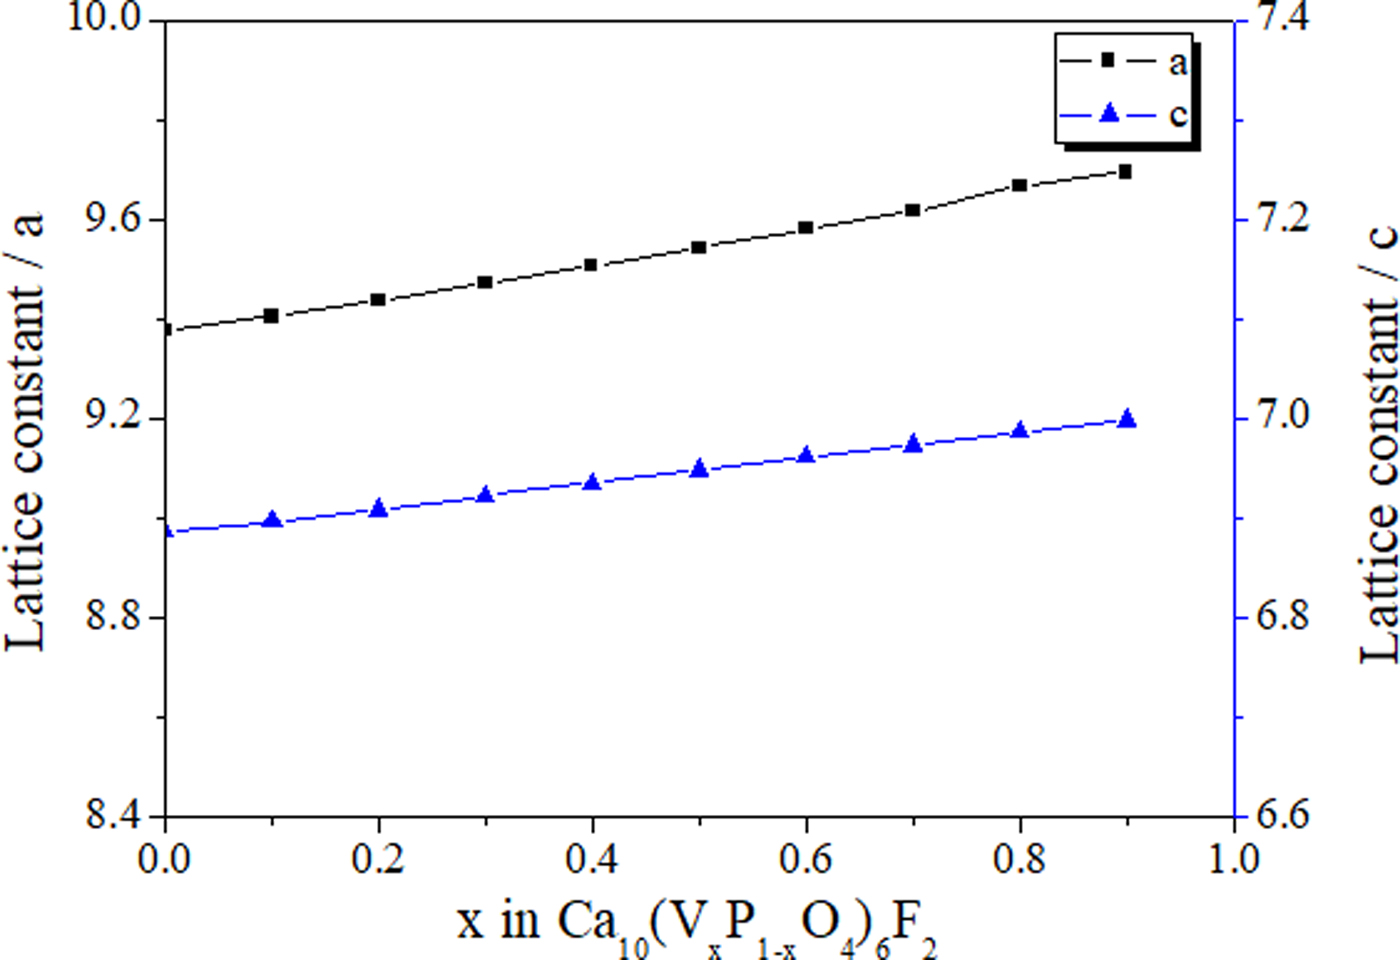
Figure 1. (Color online) Variation of lattice constants with vanadium content at B site for Ca10(VxP1−xO4)6F2 (x = 0, 1, …, 9).
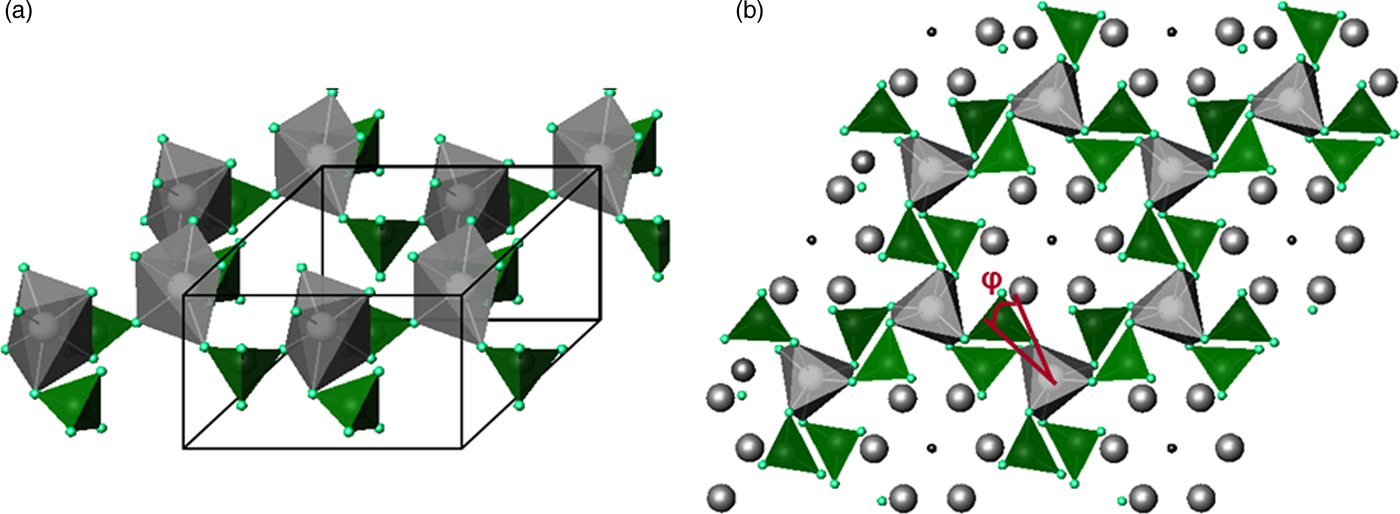
Figure 2. Twist angle in apatite structure. (a) A1-O6 octahedra formed by twisting prisms, (b) projected structure of A1-O6 octahedra showing the twist angle.
Table I. Unit cell parameters, twist angles and average B–O bond lengths for Ca10(VxP1−xO4)6F2 (x = 0, 1, …, 9).

Our previous studies reveal that in A site substitution apatites, the composition of AI and AII sites will determine the twisting of AIO6 metaprism (White and Dong, Reference White and Dong2003), and consequently the values of lattice parameter a and c. The metaprism collapses more severely by twisting when A site filled with smaller atoms.
In this work, as V content in B site increases, the tetrahedron expands, and that will cause the lattice to dilate. The V-O1, V-O2 and V-O3 bond lengths in Table I imply that the tetrahedron expands isotropically, leading to the expansions of lattice constants a and c. The lattice constants a and c of the apatites vary almost linearly with B site composition in Ca10(VxP1−xO4)6F2 apatites as shown in Figure 1. More detailed crystallographic data are given in the Supplementary Material.
B. HRTEM of Ca10(VxP1−xO4)6F2 apatite
The refinement results from XRD data were used as average structures for HRTEM characterization. As each of the powder samples has a different V/P ratio, HRTEM imaging would show different contrast with the tetrahedra net. Through studying the projected lattice structure, it seems that the [2–1–10] orientation can show the alignment of BO4 tetrahedra nicely.
Figure 3 are experimental HRTEM images from Ca10(V0.7P0.3O4)6F2 apatite from directions [2–1–10] and [0001]. The sample is not as beam-sensitive in comparison with pure P apatite, and its projected structure looks very homogeneous.

Figure 3. HRTEM images of Ca10(V0.7P0..3O4)6F2 apatite (a) from zone axis [2–1–1 0], and (b) from zone axis [0001].
Although our conventional HRTEM observation did not reveal B site ordered structure, it is still interesting to consider how the HRTEM images may look like if ordering occurs. Therefore, we propose to use Cs-corrected high-resolution transmission electron microscope in our future experiments to examine the features of alignment of BO4 tetrahedra. An exemplar apatite is Ca10(V0.7P0.3O4)6F2, which has a stoichiometric composition of 0.70 V. The refinement result shows that the V occupancy is 0.78. which is close to 75%. If we assume that vanadium occupy the whole layer of z = ¼, and half layer of z = ¾, and phosphors occupy the other half layer of z = ¾, we should be able to simulate the HRTEM image from [2–1–10] direction, and further examine the projected structure using Cs-corrected HRTEM to clarify whether this particular apatite displays B site ordering.
IV. CONCLUSIONS
The Ca10(VxP1−xO4)6F2 apatites were synthesized through solid-state reactions, and their microstructures were characterized by X-Ray Rietveld refinement and HRTEM. The changes of B site occupancies do not obviously vary the twist angle of AIO6 metaprism. The dilation of lattice parameters a and c is mainly because of the expansion of BO4 tetrahedra when V occupancy increases. For Ca10(VxP1−xO4)6F2 apatites, no tetrahedra ordering along the c-axis is observed using conventional high-resolution electron microscopy.
SUPPLEMENTARY MATERIAL
The supplementary material for this article can be found at https://doi.org/10.1017/S0885715619000150
ACKNOWLEDGEMENTS
The authors would like to thank Ms Lim Suo Hong from former Environmental Technology Institute for her help on heat treatment of powder samples. This work was supported through A*STAR Grant 012 105 0123.


