


I. INTRODUCTION
Bisoprolol fumarate (brand names Zebeta, Emcor, Isoten, and Seafuri) is a beta-blocker, one of a class of medicines used to treat cardiovascular diseases. Bisoprolol fumarate is prescribed for the treatment of hypertension, cardiac ischemia, congestive heart failure, and as a preventive treatment for heart attacks. The IUPAC name (CAS Registry number 104344-23-2) is (±)-1-(4-((2-(1-methylethoxy)ethoxy)methyl)phenoxy)-3((1-methylethyl)amino)-2-propanol(E)-2-butenedioate (2:1 salt). A two-dimensional molecular diagram of bisoprolol fumarate is shown in Figure 1.
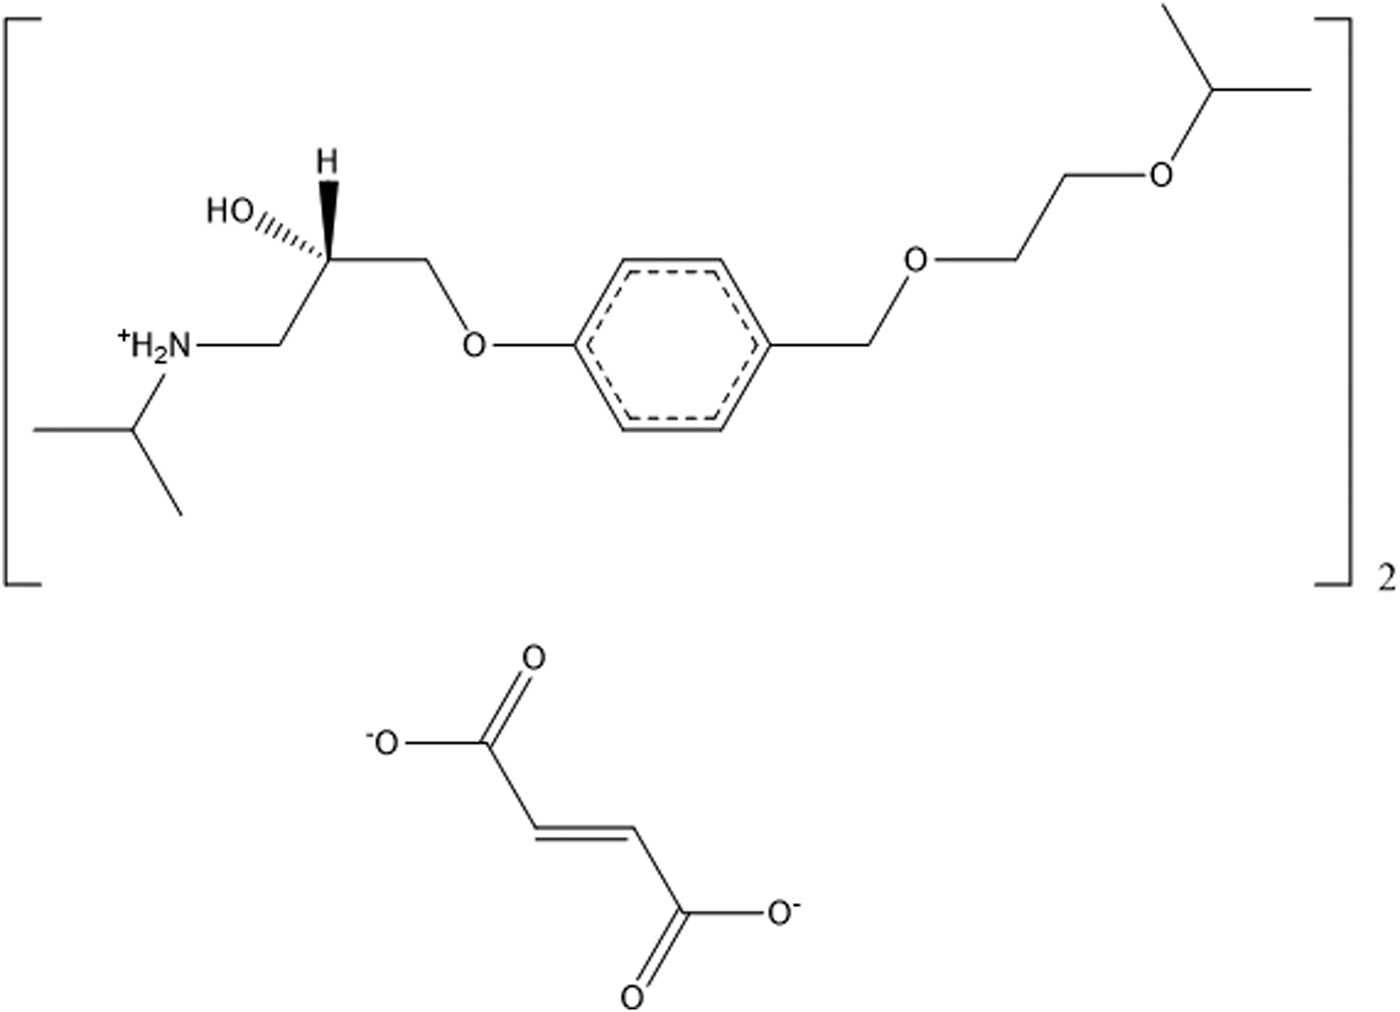
Figure 1. Molecular structure of bisoprolol fumarate.
Powder diffraction data for Forms I and II of bisoprolol fumarate, as well as that for a hydrate, are reported in Detrich et al. (Reference Detrich, Dömötör, Kagtona, Markovits and Láng2018). A peak list for Form I is also reported in Chinese Patent Application CN10634909A (Wang et al., Reference Wang, Li, Lu, Peng and Fan2016).
This work was carried out as part of a project (Kaduk et al., Reference Kaduk, Crowder, Zhong, Fawcett and Suchomel2014) to determine the crystal structures of large-volume commercial pharmaceuticals and include high-quality powder diffraction data for these pharmaceuticals in the Powder Diffraction File (Fawcett et al., Reference Fawcett, Kabekkodu, Blanton and Blanton2017).
II. EXPERIMENTAL
Bisoprolol fumarate was a commercial reagent, USP Lot #G0D316, and was used as-received. The white powder was packed into a 1.5 mm diameter Kapton capillary and rotated during the measurement at ~50 Hz. The powder diffraction pattern was measured at 295 K at beamline 11-BM (Lee et al., Reference Lee, Shu, Ramanathan, Preissner, Wang, Beno, Von Dreele, Ribaud, Kurtz, Antao, Jiao and Toby2008; Wang et al., Reference Wang, Toby, Lee, Ribaud, Antao, Kurtz, Ramanathan, Von Dreele and Beno2008) of the Advanced Photon Source at Argonne National Laboratory using a wavelength of 0.413 342 Å from 0.5° to 50° 2θ with a step size of 0.001° and a counting time of 0.1 s step−1. A laboratory powder diffraction pattern of a second sample (USP Lot #R01980) (measured on a PANalytical Empyrean diffractometer equipped with an incident-beam focusing mirror and an X'Celerator detector, from 1° to 50° 2θ in 0.016 7113 steps, 4 s step−1, 1/4° divergence slit, 0.02 radian Soller slits, rotated 0.7 mm glass capillary using MoKα radiation) was similar to the synchrotron diffraction pattern (Figure 2), confirming that the material is replicable.
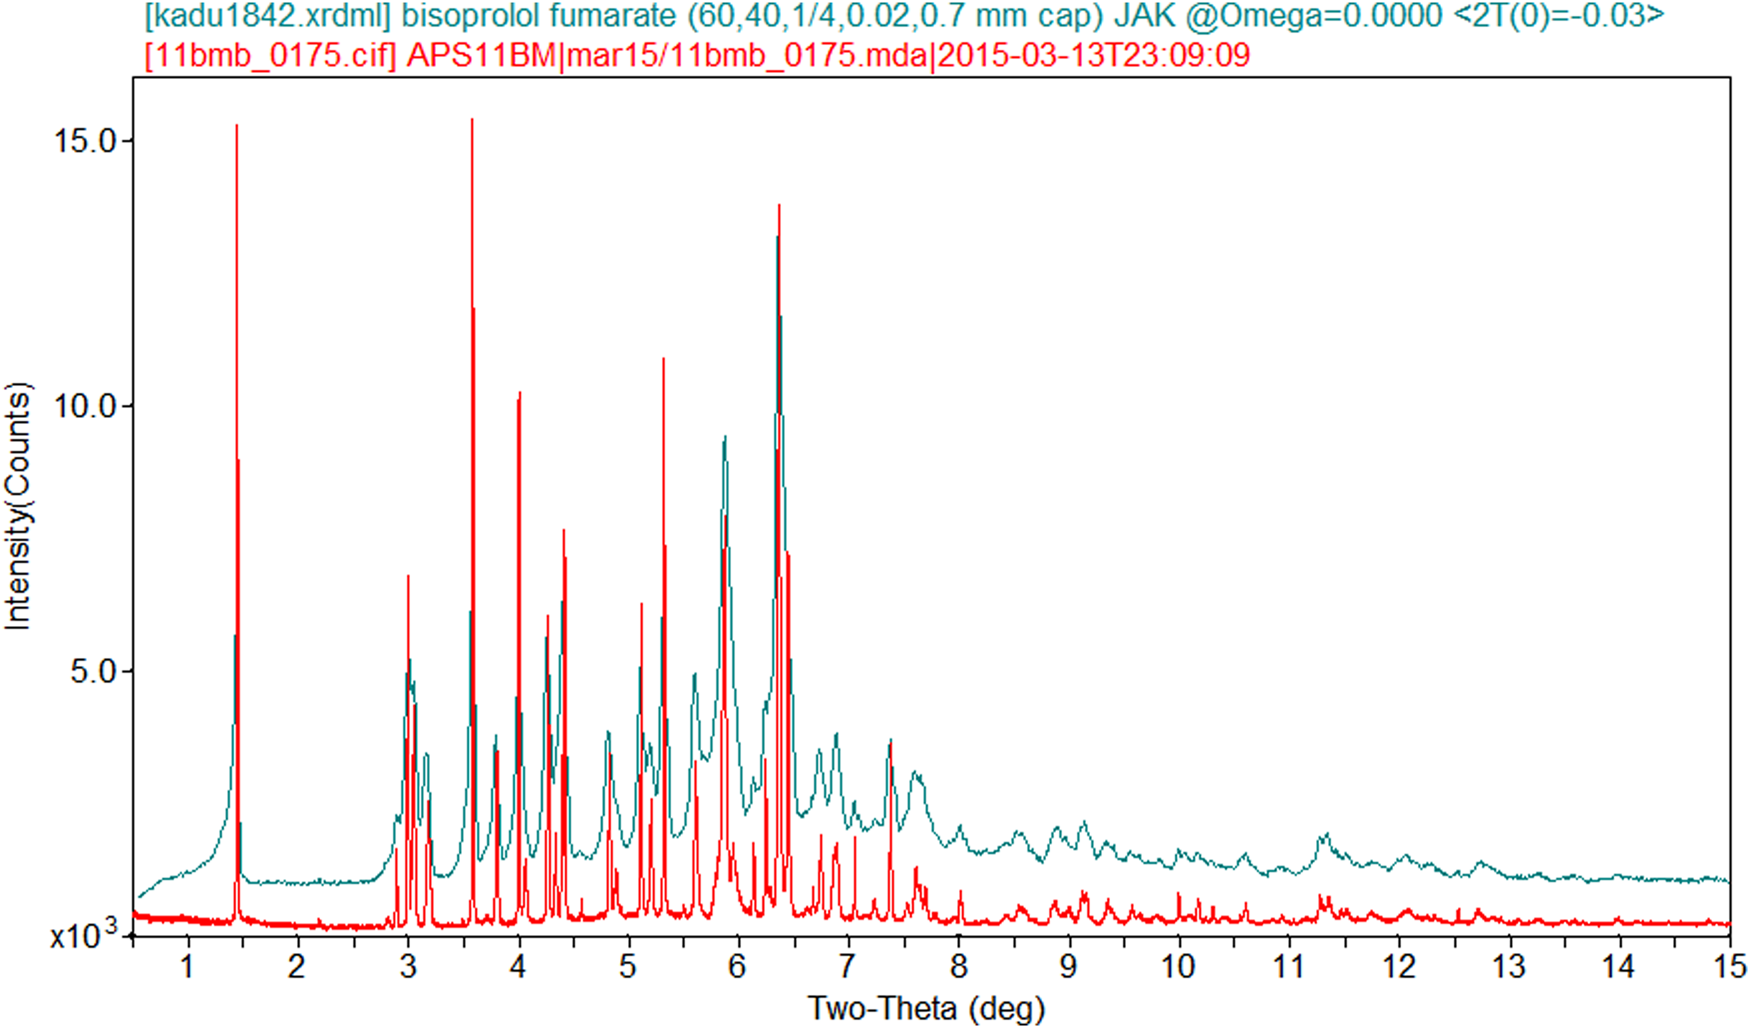
Figure 2. Comparison of the synchrotron and laboratory (MoKα) powder diffraction data on bisoprolol fumarate. The laboratory data were converted to the synchrotron wavelength of 0.413 342 Å using Jade 9.8 (MDI, 2017).
The pattern was indexed on a primitive triclinic unit cell with a = 8.1622 Å, b = 8.5281 Å, c = 16.7484 Å, α = 89.107°, β = 78.178°, γ = 81.728°, V = 1129.1 Å3, and Z = 2 using N-TREOR (Altomare et al., Reference Altomare, Cuocci, Giacovazzo, Moliterni, Rizzi, Corriero and Falcicchio2013). Since this compound is sold as a racemate, the space group was assumed to be P−1, which was confirmed by the successful solution and refinement of the structure. A reduced cell search in the Cambridge Structural Database (Groom et al., Reference Groom, Bruno, Lightfoot and Ward2016) combined with the chemistry C, H, N, and O only yielded no hits. A connectivity search on bisoprolol likewise yielded no hits. A bisoprolol cation and a fumarate dianion were built using Spartan ‘16 (Wavefunction, 2017) and saved as mol2 files. The saved mol2 files were converted into MOPAC files using OpenBabel (O'Boyle et al., Reference O'Boyle, Banck, James, Morley, Vandermeersch and Hutchison2011). Many attempts to solve the structure using multiple programs were unsuccessful. The structure was finally solved by Monte Carlo simulated annealing using EXPO2014 (Altomare et al., Reference Altomare, Cuocci, Giacovazzo, Moliterni, Rizzi, Corriero and Falcicchio2013). A bisoprolol cation and half of a fumarate dianion were used as fragments. One of the ten solutions yielded a better fit than the others. There were N–H⋯O hydrogen bonds between the bisoprolol and the fumarate, but the C56–C56 double bond across the center of symmetry at the center of the fumarate was 2.37 Å, much longer than the expected value of 1.31 Å.
The structure was refined GSAS (Toby, Reference Toby2001; Larson and Von Dreele, Reference Larson and Von Dreele2004). For reasons that are as yet unclear, attempts to refine the structure using GSAS-II failed. Only the 1.0–22.0° 2θ portion of the pattern was included in the refinement (d min = 1.083 Å). All non-H bond distances and angles were subjected to restraints, based on a Mercury/Mogul Geometry Check (Bruno et al., Reference Bruno, Cole, Kessler, Luo, Motherwell, Purkis, Smith, Taylor, Cooper, Harris and Orpen2004; Sykes et al., Reference Sykes, McCabe, Allen, Battle, Bruno and Wood2011) of the molecule. The Mogul average and standard deviation for each quantity were used as the restraint parameters. The C56–C56 double bond between the two halves of the fumarate dianion was restrained to 1.31(3) Å. The restraints contributed 8.7% to the final χ 2. The U iso of the non-H atoms were grouped by chemical similarity. The U iso of each hydrogen atom was fixed at 1.3× that of the heavy atom to which it was attached. The peak profiles were described using the profile function #4 (Thompson et al., Reference Thompson, Cox and Hastings1987; Finger et al., Reference Finger, Cox and Jephcoat1994), which includes the Stephens (Reference Stephens1999) anisotropic strain broadening model. The background was modeled using a three-term shifted Chebyshev polynomial, with a six-term diffuse scattering function to model the Kapton capillary and any amorphous component. The initial refinement (even with restraints) yielded large displacement coefficients in the neutral side chain C35–C52 and a chemically unreasonable topology. The refinement was re-started from the result of the density functional theory (DFT) calculation. The final refinement of 131 variables using 21 060 observations (21 002 data points and 58 restraints) yielded the residuals R wp = 0.054, Rp = 0.0701, and χ 2 = 2.909. The largest peak (1.00 Å from C19) and hole (1.88 Å from C52) in the difference Fourier map were 0.40 and −0.46 eÅ−3, respectively. The Rietveld plot is included in Figure 3. The largest errors in the fit are in the positions and shapes of some of the low-angle peaks and may reflect subtle specimen damage.

Figure 3. Rietveld plot for the synchrotron pattern refinement of bisoprolol fumarate. The black crosses represent the observed data points, and the red line is the calculated pattern. The blue curve is the difference plot, plotted at the same scale as the other patterns. The vertical scale has been multiplied by a factor of 10 for 2θ > 7.4°.
The structure was also refined using the laboratory data with GSAS-II (Toby and Von Dreele, Reference Toby and Von Dreele2013), using a similar strategy as with the synchrotron data, except that the data did not support the refinement of the generalized strain broadening model. The final refinement of 109 variables using 1706 observations and 59 restraints yielded the residuals R wp = 0.0715 and GOF = 4.51. The largest peak and hole in the difference Fourier map were 0.27 and −0.24(6) eÅ−3, respectively. The Rietveld plot is included in Figure 4. A peak at 9.79° 2θ indicates that an unidentified impurity phase is present. This peak is not present in the synchrotron pattern, so it represents a sample-specific impurity.

Figure 4. Rietveld plot for the laboratory pattern refinement of bisoprolol fumarate. Intensity is plotted on a square root scale. The blue crosses represent the observed data points, and the green line is the calculated pattern. The red line is the background, which included the diffuse scattering. The cyan curve is the difference pattern.
A density functional geometry optimization (fixed experimental unit cell) was carried out using VASP (Kresse and Furthmüller, Reference Kresse and Furthmüller1996) through the MedeA graphical interface (Materials Design, 2016). The calculation was carried out on 16 2.4 GHz processors (each with 4 GB RAM) of a 64-processor HP Proliant DL580 Generation 7 Linux cluster at North Central College. The calculation used the GGA-PBE functional, a plane wave cutoff energy of 400.0 eV, and a k-point spacing of 0.5 Å−1 leading to a 2 × 2 × 1 mesh, and took ~8 h. A density functional geometry optimization was also carried out using CRYSTAL14 (Dovesi et al., Reference Dovesi, Orlando, Erba, Zicovich-Wilson, Civalleri, Casassa, Maschio, Ferrabone, De La Pierre, D-Arco, Noël, Causà and Kirtman2014). The basis sets for the H, C, N, and O atoms were those of Gatti et al. (Reference Gatti, Saunders and Roetti1994). The calculation was run on eight 2.1 GHz Xeon cores (each with 6 GB RAM) of a 304-core Dell Linux cluster at Illinois Institute of Technology, using eight k-points and the B3LYP functional, and took ~24 h.
III. RESULTS AND DISCUSSION
The powder pattern matches that of Form I from Detrich et al. (Reference Detrich, Dömötör, Kagtona, Markovits and Láng2019) (Figure 5) and Wang et al. (Reference Wang, Li, Lu, Peng and Fan2016) (Figure 6) well enough to conclude that the material studied here is bisoprolol fumarate Form I. A trace of the bisoprolol hydrate form appears to be present in the synchrotron sample.
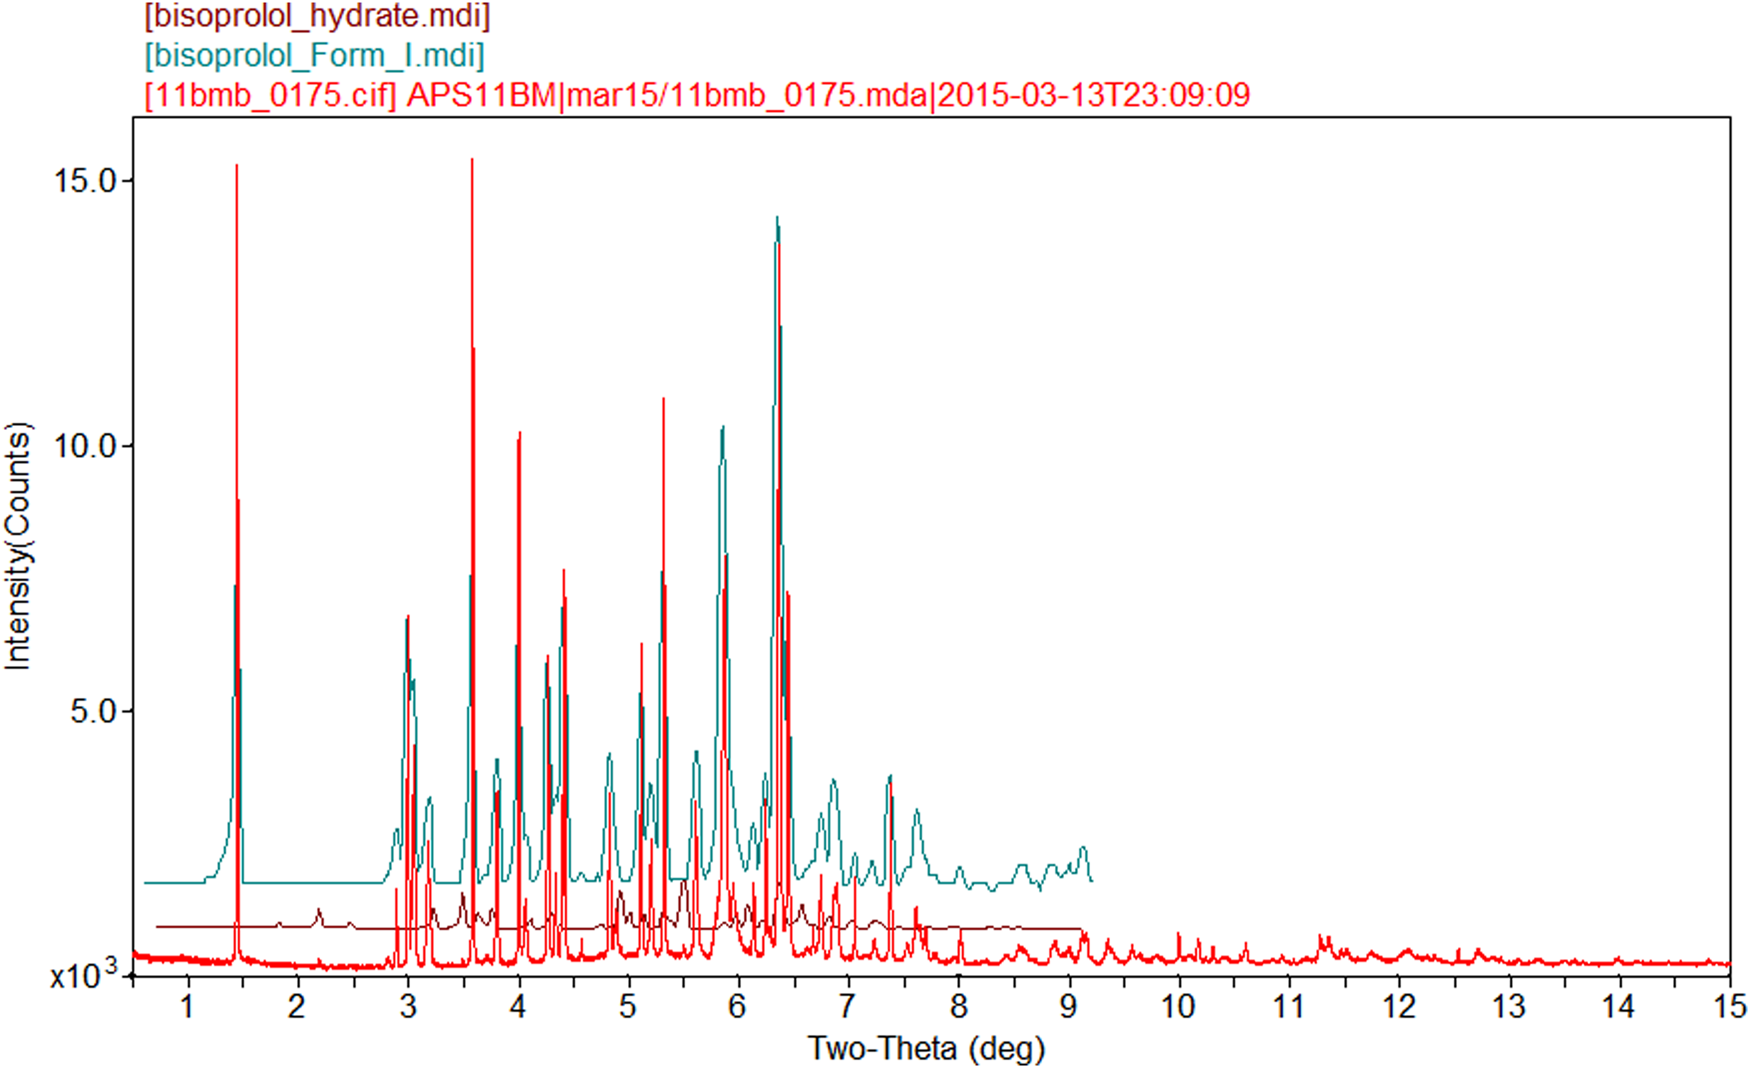
Figure 5. Comparison of the synchrotron pattern of bisoprolol fumarate with the pattern of Form I from Detrich et al. (Reference Detrich, Dömötör, Kagtona, Markovits and Láng2019), as well as that of bisoprolol hydrate. The literature patterns (measured using CuKα radiation) were digitized using UN-SCAN-IT (Silk Scientific, 2013) and scaled to the synchrotron wavelength of 0.413 342 Å using Jade 9.8 (MDI, 2017).
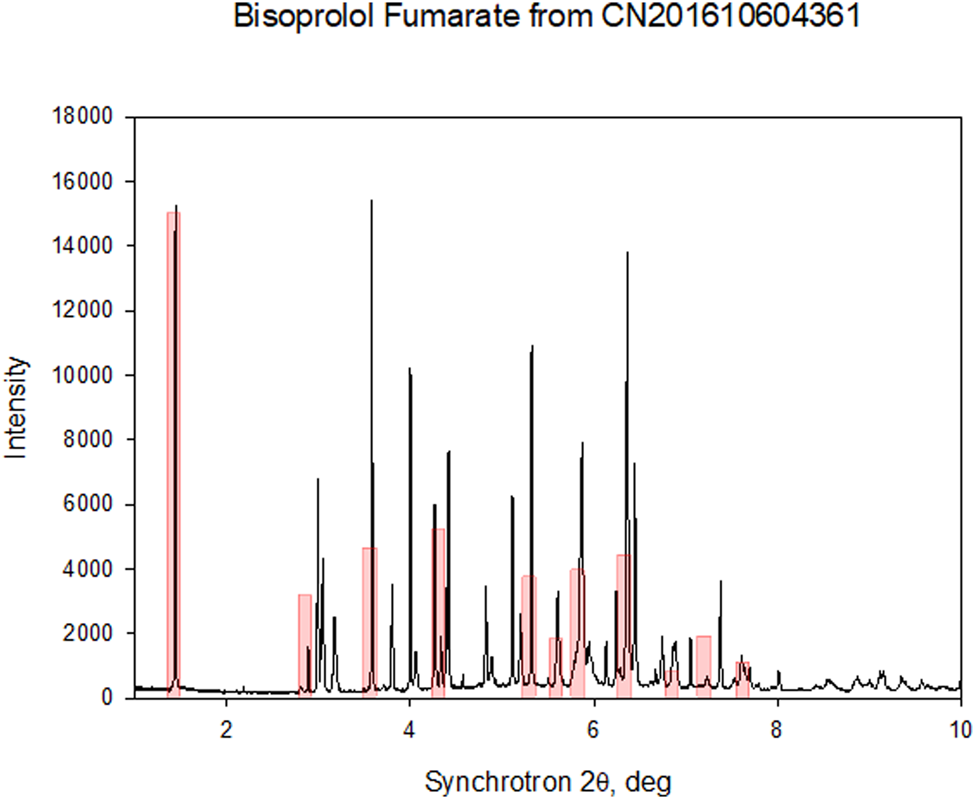
Figure 6. Comparison of the synchrotron pattern of bisoprolol fumarate (black) to the powder data reported in Wang et al. (Reference Wang, Li, Lu, Peng and Fan2016) (pink bars).
The root-mean-square (rms) Cartesian displacement between the non-H atoms of the cations in the synchrotron and laboratory structures is 0.443 Å (Figure 7), and the largest difference is 1.099 Å. The biggest differences are in the isopropyl group of the neutral side chain C35–C52, but there are many significant differences. The average precision of the C–C bonds in the synchrotron structure is 0.011 Å, while that in the laboratory structure is 0.069 Å; the laboratory structure is much less precise than the synchrotron structure.

Figure 7. Comparison of the refined structures of bisoprolol fumarate using the synchrotron (green) and laboratory (red) data.
The refined atom coordinates of bisoprolol fumarate and the coordinates from the DFT optimizations are reported in the CIFs attached in Supplementary Material. The rms Cartesian displacement between the CRYSTAL and VASP structures is 0.212 Å (Figure 8). The largest differences are in the neutral side chain. This discussion will concentrate on the synchrotron and CRYSTAL14 structures. Comparing the Rietveld-refined and optimized structures, the rms Cartesian displacements of the non-H atoms in the bisoprolol cation are 0.787 Å (Figure 9). The largest differences are in the neutral side chain. Removing these atoms from the overlay decreases the rms displacement to 0.483 Å. The agreement between the refined and optimized structures is outside of the normal range for correct structures (van de Streek and Neumann, Reference van de Streek and Neumann2014), but the general nature of the structure seems to be correct. The asymmetric unit (with the atom numbering) is illustrated in Figure 10, and the crystal structure is presented in Figures 11 and 12. The U iso of the atoms in the neutral side chain are much larger than those in other parts of the structures, suggesting that this chain may be disordered. These “flexible” regions lie next to each other in the structure and away from the more rigid hydrogen-bonded regions.

Figure 8. Comparison of the CRYSTAL14- (blue) and VASP-optimized (green) structures of the bisoprolol cation.

Figure 9. Comparison of the CRYSTAL14-optimized (blue) and Rietveld-refined (red) structures of the bisoprolol cation.
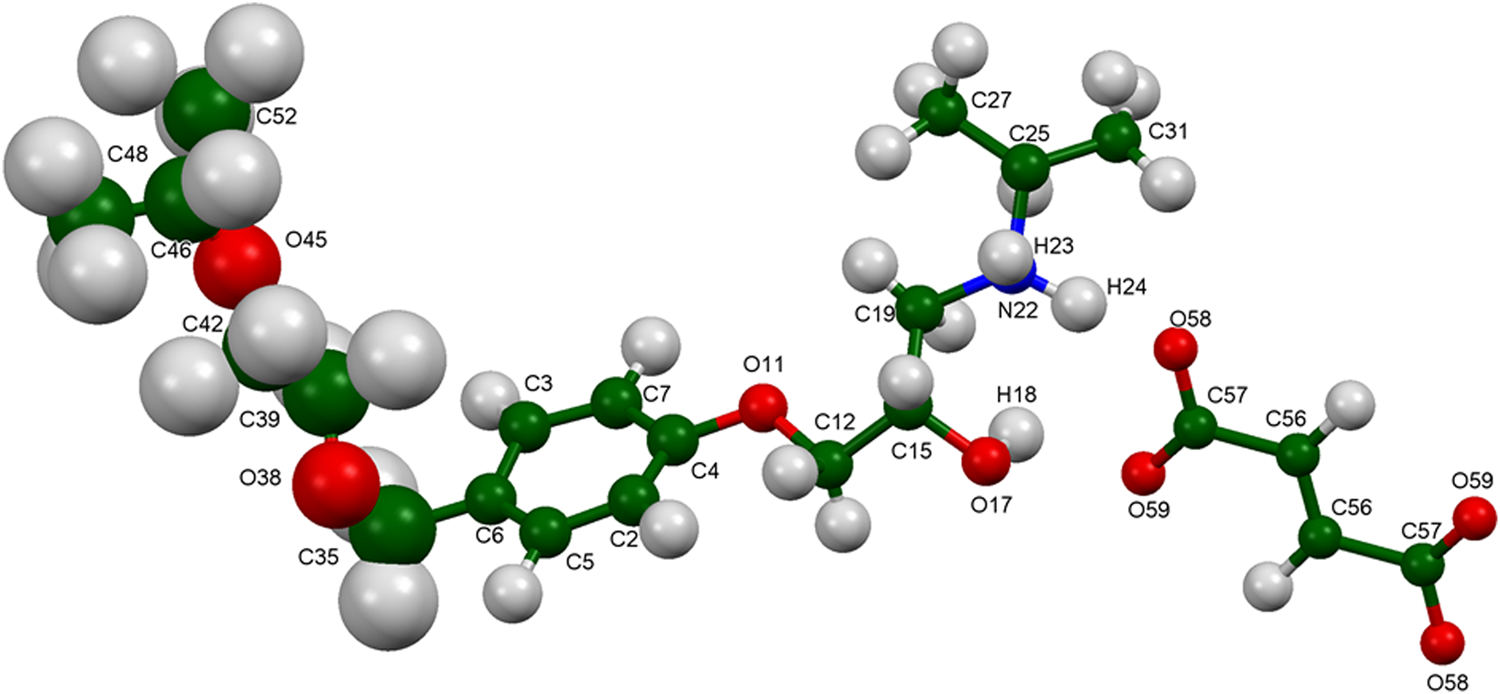
Figure 10. Molecular structure of bisoprolol fumarate, with the atom numbering. The atoms are represented by 50% probability spheroids.

Figure 11. Crystal structure of bisoprolol fumarate, viewed down the b-axis.

Figure 12. Crystal structure of bisoprolol fumarate, viewed down the b-axis, and including the thermal ellipsoids.
All of the bond distances and angles and almost all the torsion angles fall within the normal ranges indicated by a Mercury/Mogul Geometry Check (Macrae et al., Reference Macrae, Bruno, Chisholm, Edington, McCabe, Pidcock, Rodriguez-Monge, Taylor, van de Streek and Wood2008). The torsion angles C12–O11–C4–C2 and O45–C42–C39–O38 are flagged as unusual. The value of 28° for C12–O11–C4–C2 lies on the tail of a bimodal 0/180° distribution of similar torsion angles. The value of 174° for O45–C42–C39–O38 lies in a minor trans population of a mainly ±gauche distribution of similar torsion angles.
Quantum chemical geometry optimization (DFT/B3LYP/6-31G*/water) using Spartan ‘16 (Wavefunction, 2017) indicated that the observed conformation of the bisoprolol cation is 9.1 kcal mol−1 higher in energy than the local minimum. The geometry differences span the whole molecule but are largest in the cationic side chain. Molecular mechanics conformational analysis indicated that the observed conformation is 4.9 kcal mol−1 higher in energy than the global minimum-energy conformation, but that the general shapes of the molecules are similar. These energy differences indicate that cation–anion interactions are significant in determining the molecular conformation.
Analysis of the contributions to the total crystal energy using the Forcite module of Materials Studio (Dassault, 2017) suggests that bond and angle distortion terms are the most significant contributions to the intramolecular deformation energy, but that they are relatively small. The intermolecular energy is dominated by electrostatic attractions, which in this force-field-based analysis include hydrogen bonds. The hydrogen bonds are better analyzed using the results of the DFT calculation.
Hydrogen bonds are prominent in the crystal structure (Table I). The cation and anion are linked by N22–H24⋯O and O17–H18⋯O59 hydrogen bonds. The result of these is a ring with a graph set (Etter, Reference Etter1990; Bernstein et al., Reference Bernstein, Davis, Shimoni and Chang1995; Shields et al., Reference Shields, Raithby, Allen and Motherwell2000) R2,2(9). The cations are linked by N22–H23⋯O17 hydrogen bonds. The result is a complex chain of hydrogen bonds roughly along the 320 axis. The energies of the N–H⋯O hydrogen bonds were calculated by the correlation of Wheatley and Kaduk (Reference Wheatley and Kaduk2018), and that of the O–H⋯O hydrogen bonds was calculated by the correlation of Rammohan and Kaduk (Reference Rammohan and Kaduk2018). The crystal structure is characterized by alternation hydrophilic and hydrophobic layers parallel to the ab-plane. Several C–H⋯O hydrogen bonds contribute to the crystal energy. Visually, hydrophobic–hydrophobic interactions seem to take place, but there is only weak evidence for them in the Mulliken population analysis.
TABLE I. Hydrogen bonds (CRYSTAL14) in bisoprolol fumarate.

a Intramolecular.
A calculation of the Connolly surface (probe radius = 1.2 Å) using Materials Studio (Dassault, 2017) indicated that the free volume was 3.8%. A void calculation in Mercury using the same radius yielded no voids. The volume/non-H atom is 20.9 Å3. The calculated density is 1.130 g cm−3.
The Bravais–Friedel–Donnay–Harker (Bravais, Reference Bravais1866; Friedel, Reference Friedel1907; Donnay and Harker, Reference Donnay and Harker1937) morphology suggests that we might expect platy morphology for bisoprolol fumarate, with {001} as the principal faces. A fourth-order spherical harmonic preferred orientation model was included in both the synchrotron and laboratory refinements. The texture indices were 1.12 and 1.20, respectively, so preferred orientation was significant in these rotated capillary specimens. The powder pattern of bisoprolol fumarate from this synchrotron data set is included in the Powder Diffraction File™ as entry 00-066-1625.
SUPPLEMENTARY MATERIAL
The supplementary material for this article can be found at https://doi.org/10.1017/S0885715619000757.
ACKNOWLEDGEMENTS
We thank Lynn Ribaud and Saul Lapidus for their assistance in the data collection and Andrey Rogachev for the use of computing resources at IIT.
FUNDING INFORMATION
Use of the Advanced Photon Source at Argonne National Laboratory was supported by the U. S. Department of Energy, Office of Science, Office of Basic Energy Sciences, under Contract No. DE-AC02-06CH11357. This work was partially supported by the International Centre for Diffraction Data.
CONFLICTS OF INTEREST
The authors have no conflicts of interest to declare.


