I. INTRODUCTION
Atorvastatin calcium trihydrate (ACT) (brand name Lipitor®) is a statin medication used to prevent cardiovascular disease and treat high levels of low-density lipoprotein cholesterol. ACT is also prescribed to reduce triglycerides and increase levels of good high-density lipoprotein cholesterol. The IUPAC name (CAS Registry number 344423-98-9) is calcium (3R,5R)-7-[2-(4-fluorophenyl)-3-phenyl-4-(phenylcarbamoyl)-5-propan-2-ylpyrrol-1-yl]-3,5-dihydroxyheptanoate trihydrate. A two-dimensional molecular diagram is shown in Figure 1.
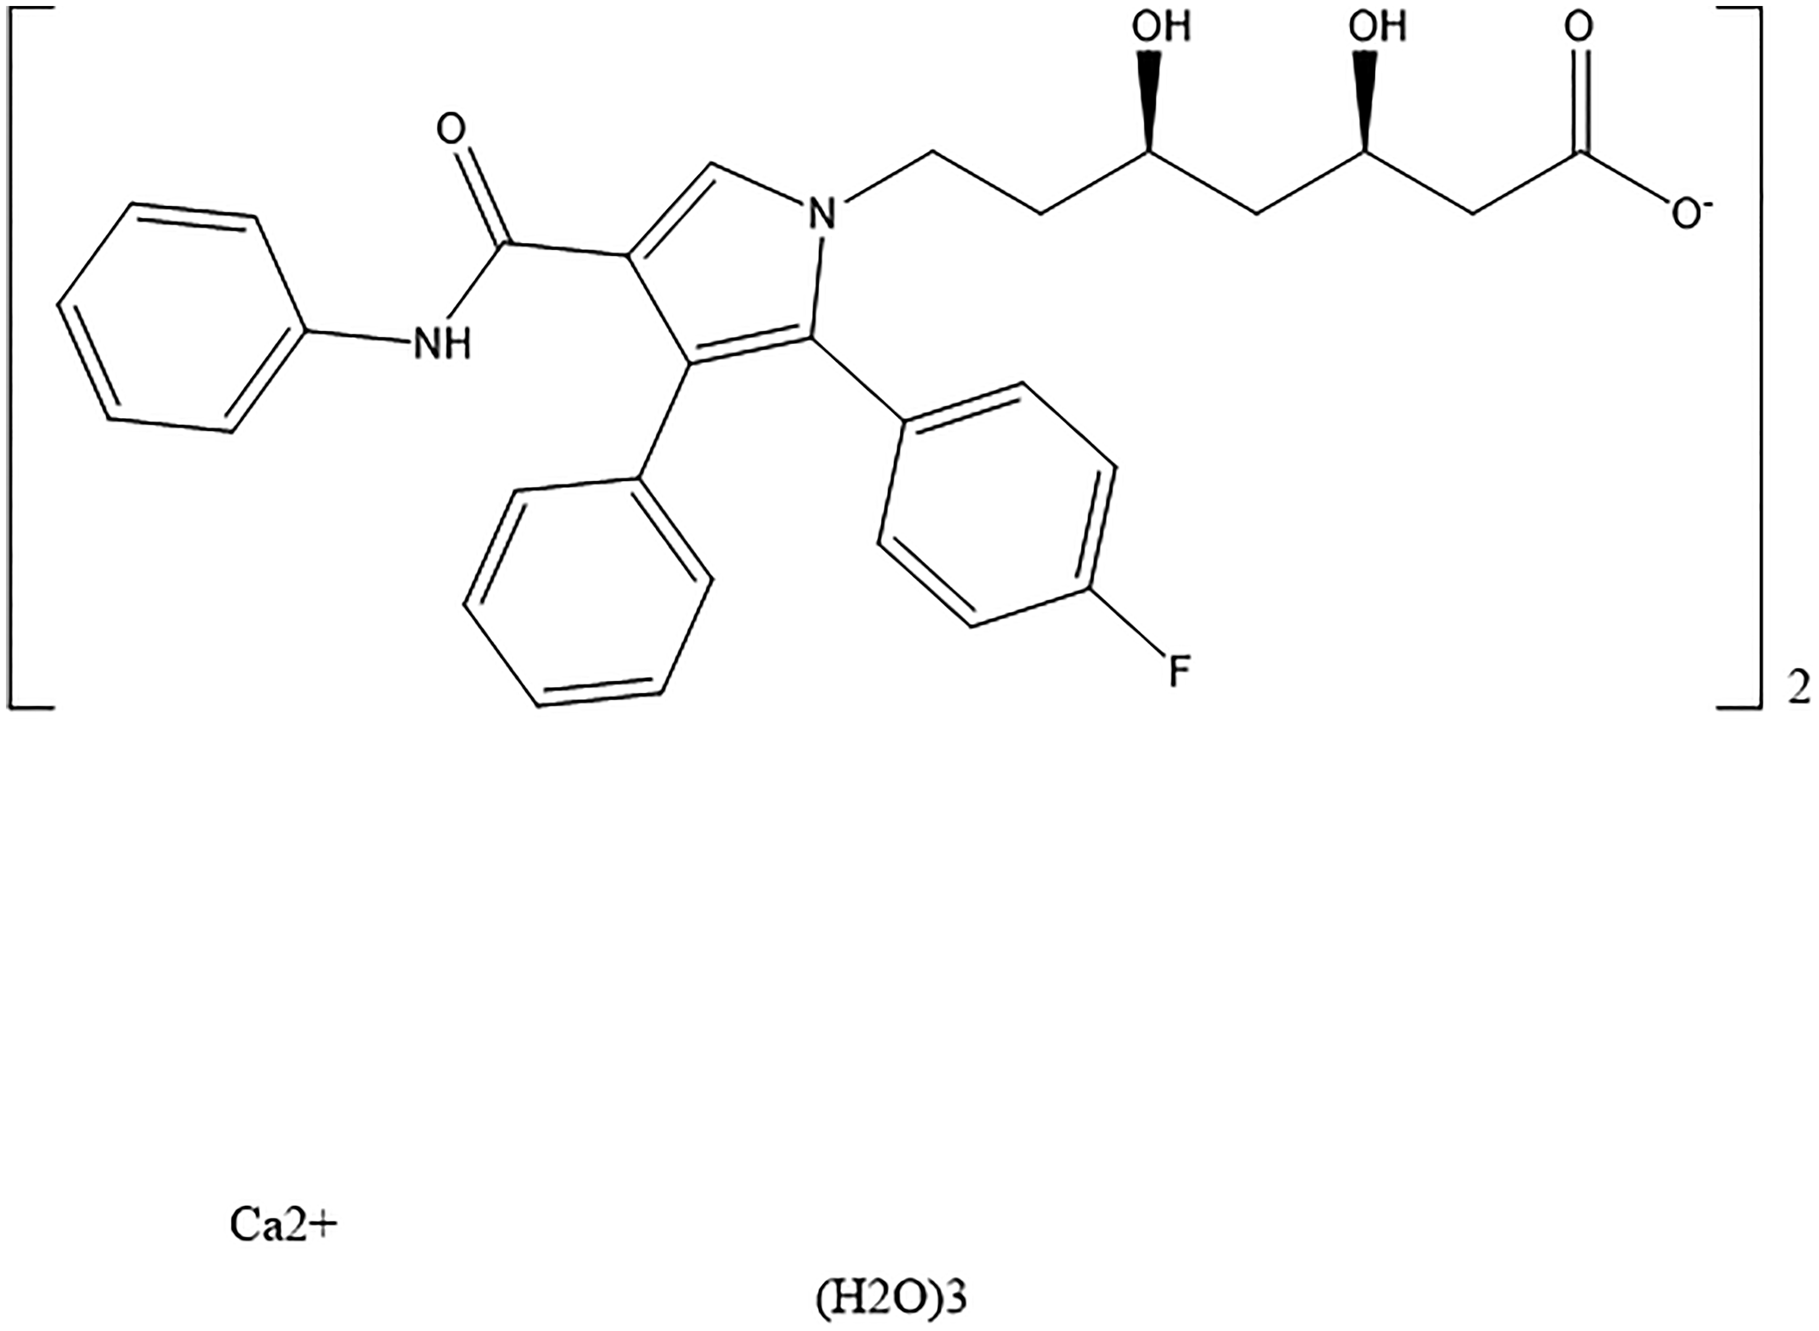
Figure 1. The molecular structure of ACT.
A star quality powder pattern of ACT Form I, based on synchrotron data, is contained in Powder Diffraction File (PDF®) entry 00-062-1582 (Antonio et al., Reference Antonio, Benini, Ferreira, Rosa and Pavia-Santos2008). Another star quality pattern of this compound from laboratory data is reported in PDF entry 00-060-1196 (Vickers, Reference Vickers2009). Crystal structure data are not reported in either high-quality diffraction entry. Low precision patterns of ACT are reported in PDF entries 00-065-1478 (Sonje et al., Reference Sonje, Kumar, Meena, Kohli, Puri, Jain, Bansal and Brittain2010), 00-059-1421, 00-059-1426, and 00-059-1315 (Byrn et al., Reference Byrn, Coates, Gushurst, Krzyaniak, Li, Morrison, Park and Vlahova2006). Patterns of a number of other reported crystalline forms and solvates/hydrates of atorvastatin calcium phases are also contained in the PDF. Atorvastatin calcium crystallizes in at least 12 forms (Antonio et al., Reference Antonio, Benini, Ferreira, Rosa and Pavia-Santos2008). Crystalline Form I of ACT was claimed in US Patent 5,969,156 [Briggs et al., Reference Briggs, Jennings, Wade, Harasawa, Ichikawa, Minohara and Nakagawa1999; Warner–Lambert (now Pfizer)]. Form I is described as having greater stability than the amorphous product and more favorable filtering and drying characteristics.
This work was carried out as part of a project (Kaduk et al., Reference Kaduk, Crowder, Zhong, Fawcett and Suchomel2014) to determine the crystal structures of large-volume commercial pharmaceuticals and include high-quality powder diffraction data for these pharmaceuticals in the PDF (Gates-Rector and Blanton, Reference Gates-Rector and Blanton2019).
II. EXPERIMENTAL
ACT was a commercial reagent, purchased from United States Pharmacopeial Convention (USP) Lot #H0M533, and was used as-received. The white powder was packed into a 1.5-mm diameter Kapton capillary and rotated during the measurement at ~50 Hz. The powder pattern was measured at 295 K at beamline 11-BM (Lee et al., Reference Lee, Shu, Ramanathan, Preissner, Wang, Beno, Von Dreele, Ribaud, Kurtz, Antao, Jiao and Toby2008; Wang et al., Reference Wang, Toby, Lee, Ribaud, Antao, Kurtz, Ramanathan, Von Dreele and Beno2008) of the Advanced Photon Source at Argonne National Laboratory using a wavelength of 0.413342 Å from 0.5° to 50° 2θ with a step size of 0.001° and a counting time of 0.1 s step−1.
The pattern was indexed using DICVOL14 (Louër and Boultif, Reference Louër and Boultif2014). Among the several suggested triclinic unit cells, the one with the highest figure of merit was a = 5.4471, b = 9.8902, c = 29.5984 Å, α = 95.846, β = 94.206, γ = 105.275°, and V = 1521.87 Å3. This is very close to the “alternate” unit cell of Antonio et al. (Reference Antonio, Benini, Ferreira, Rosa and Pavia-Santos2008), and its volume corresponds to Z = 1. A reduced cell search in the Cambridge Structural Database (Groom et al., Reference Groom, Bruno, Lightfoot and Ward2016) yielded no hits.
An atorvastatin anion was built in Spartan ‘18 (Wavefunction, 2018), saved as a mol2 file, and converted into a Fenske–Hall Z-matrix using OpenBabel (O'Boyle et al., Reference O'Boyle, Banck, James, Morley, Vandermeersch and Hutchison2011). Initial attempts to solve the structure with Monte Carlo-simulated annealing techniques using several programs, with two atorvastatin fragments, one Ca, and three O atoms (water molecules), were unsuccessful. The chirality of one of the atorvastatin C atoms was inverted from R to S. Under the assumption that each oxygen atom of the carboxyl group would bond to at least one Ca cation, the oxygen atoms were removed from the carboxyl group of the atorvastatin anion, and an octahedral CaO6 fragment was built using Spartan ‘18. Two atorvastatin-O2, the CaO6 fragment, and two O atoms (water molecules) were used to solve the structure with Free Objects for Crystallography (Favre-Nicolin and Černý, Reference Favre-Nicolin and Černý2002). The maximum sinθ/λ was 0.25 Å−1, and the R wp and GOF in a Le Bail fit were 12.622% and 5.421, respectively. One of the 45 trials yielded a cost factor (79,680) much lower than the others, which were all greater than 100,000. The carboxyl groups were regenerated from the separate fragments; each carboxyl group bridged two Ca cations, and the bridging took place in the equatorial plane of the Ca coordination sphere. One of the axial oxygen atoms appeared to be a coordinated water molecule, and the second axial position was very close to one of the side chain hydroxyl groups and was eliminated. One of the water molecules was too close to a ligand and was eliminated. There was a void in the crystal structure, and the third water molecule was placed in that position. Repeated force-field geometry optimizations using the Forcite module of Materials Studio (Dassault, 2018) (including six Ca–O bonds), coupled with Vienna Ab Initio Structure Package (VASP) geometry optimizations and Rietveld refinements, yielded a refinable structure model. The final refinement was started from the results of the VASP optimization.
Rietveld refinement was carried out using GSAS-II (Toby and Von Dreele, Reference Toby and Von Dreele2013). Only the 1.0–22.0° portion of the diffraction pattern was included in the refinement (d min = 1.083 Å). The coordinates of Ca39 were fixed to define the origin. All non-H-bond distances and angles were subjected to restraints, based on a Mercury/Mogul Geometry Check (Bruno et al., Reference Bruno, Cole, Kessler, Luo, Motherwell, Purkis, Smith, Taylor, Cooper, Harris and Orpen2004; Sykes et al., Reference Sykes, McCabe, Allen, Battle, Bruno and Wood2011) of the molecule. The Mogul average and standard deviation for each quantity were used as the restraint parameters. The hydrogen atoms were included in calculated positions, which were recalculated during the refinement using Materials Studio. The U iso were grouped by chemical similarity, and the U iso in the two anions were constrained to be the same. The background was modeled using a 6-term shifted Chebyshev polynomial, along with one peak at 5.32° to model the scattering from the Kapton capillary.
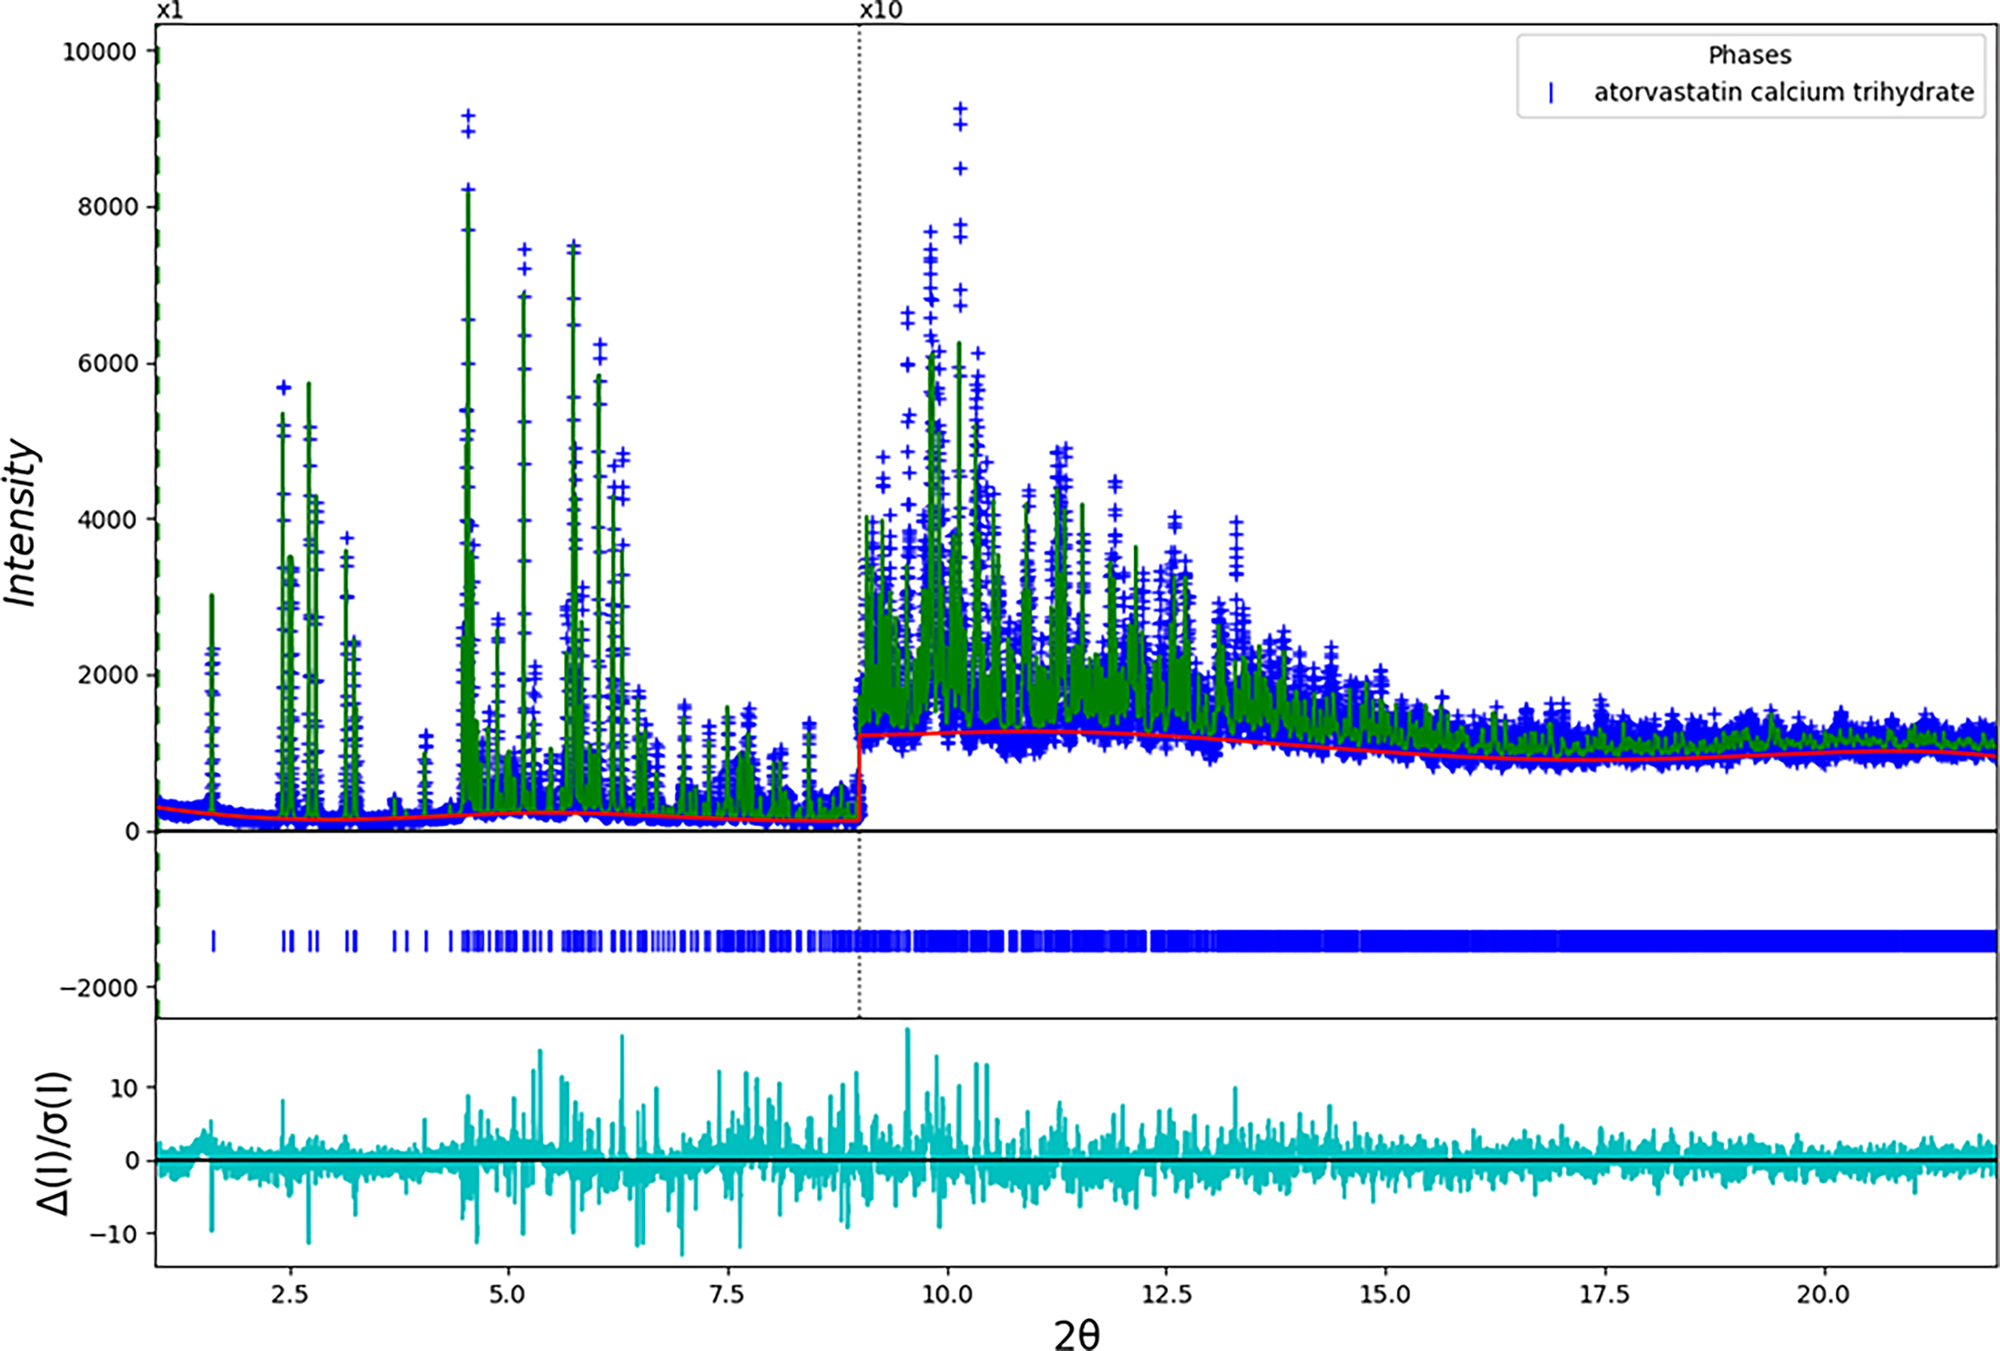
The final refinement of 297 variables using 21,003 observations and 214 restraints yielded the residuals R wp = 0.1476 and GOF = 2.12. The weighted profile residual was only 17% larger than the residual from the Le Bail fit. The largest peak (1.48 Å from O38) and hole (2.14 Å from N73) in the difference Fourier map were 0.82 and −0.57(15) eÅ−3, respectively. The largest errors in the fit (Figure 2) are in the intensities of some of the low angle peaks.

Figure 2. (Color online) The Rietveld plot for the refinement of ACT Form 1. The blue crosses represent the observed data points, and the green line is the calculated pattern. The cyan curve is the normalized error plot. The vertical scale has been multiplied by a factor of 10× for 2θ > 9.0°.
A density functional geometry optimization (fixed experimental unit cell) was carried out using VASP (Kresse and Furthmüller, Reference Kresse and Furthmüller1996). The calculation used the Generalized Gradient Approximation-Perdew Burke Ernzerhof functional, a plane wave cutoff energy of 400.0 eV, and a k-point spacing of 0.5 Å−1 leading to a 3 × 2 × 1 mesh. The calculation was carried out on 16 2.4 GHz processors (each with 4 Gb RAM) of a 64-processor HP Proliant DL580 Generation 7 Linux cluster at North Central College and took ~38 h. To obtain the Mulliken overlap populations for the hydrogen bond analysis, a density functional geometry optimization starting from the VASP-optimized structure was carried out using CRYSTAL14 (Dovesi et al., Reference Dovesi, Orlando, Erba, Zicovich-Wilson, Civalleri, Casassa, Maschio, Ferrabone, De La Pierre, D-Arco, Noël, Causà and Kirtman2014). The basis sets for the H, C, N, and O atoms were those of Gatti et al. (Reference Gatti, Saunders and Roetti1994), and the basis sets for F and Ca were that of Peintinger et al. (Reference Peintinger, Vilela Oliveira and Bredow2013). The calculation was run on eight 2.1 GHz Xeon cores (each with 6 Gb RAM) of a 304-core Dell Linux cluster at IIT, using eight k-points and the B3LYP functional, and took ~114 h.
III. RESULTS AND DISCUSSION
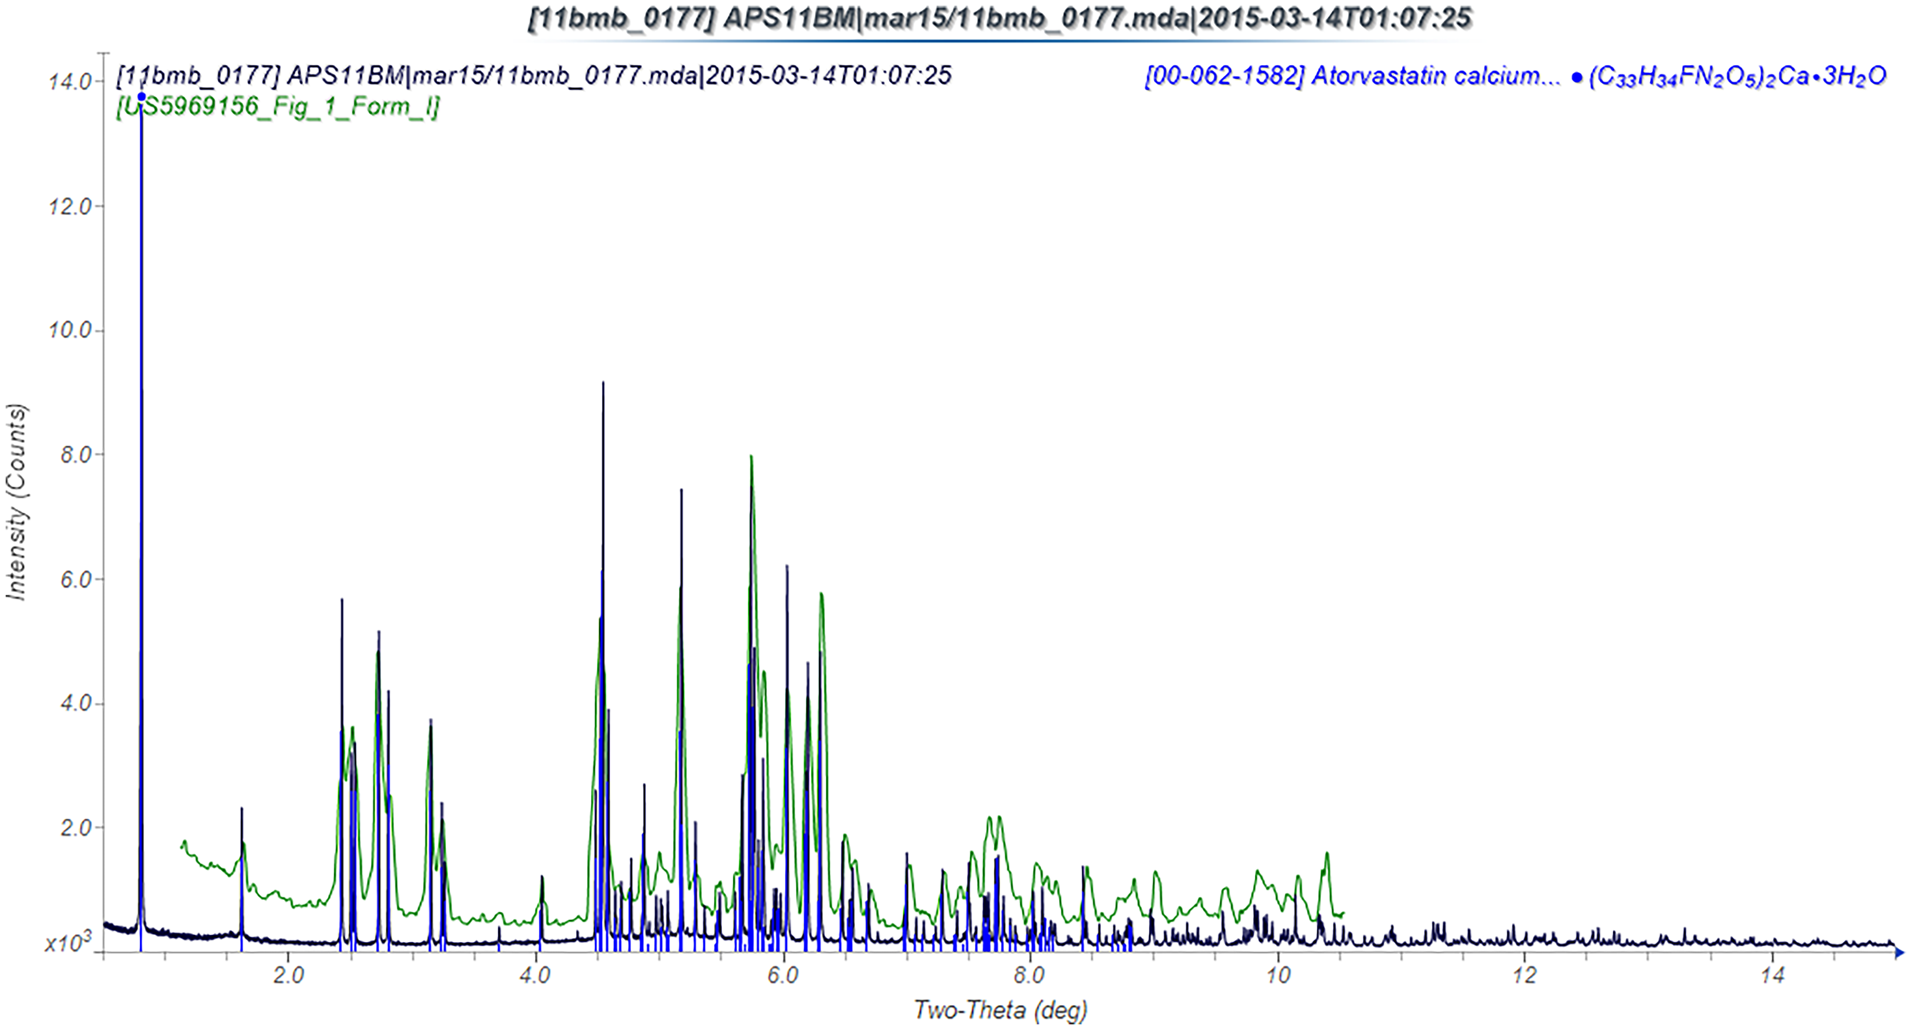
The powder pattern of this study is an excellent match to PDF entry 00-062-1582 (Antonio et al., Reference Antonio, Benini, Ferreira, Rosa and Pavia-Santos2008) and to that reported in US Patent 5,969,156 (Briggs et al., Reference Briggs, Jennings, Wade, Harasawa, Ichikawa, Minohara and Nakagawa1999), indicating that our sample is representative of ACT Form I (Figure 3). The agreement of the two density functional theory (DFT) geometry optimizations is good but not perfect (Figure 4). The root-mean-square (RMS) Cartesian displacement between the two structures is 0.194 Å. The differences are a reminder that there is uncertainty even in a DFT calculation. The remaining discussion will emphasize the CRYSTAL14 result. The refined atom coordinates of ACT and the coordinates from the DFT optimizations are reported in the Crystallographic Information Frameworks (CIFs) (see Deposited Data).

Figure 3. (Color online) Comparison of the current synchrotron powder pattern of ACT to the PDF entry 00-062-1582 and the powder diffraction pattern of Figure 1 of US Patent 5,969,156.

Figure 4. (Color online) Comparison of the VASP-optimized (green) and CRYSTAL14-optimized (blue) structures of ACT.
The RMS Cartesian displacement of the non-hydrogen atoms of the Rietveld-refined and the DFT-optimized structures is 0.713 Å (Figure 5). The maximum displacements are in the side chain of molecule 1 (lower atom sequence numbers). Even though the refinement was started from the DFT-optimized structure, the atoms of this side chain moved significantly. In the Rietveld refinement, the water molecule O85 moved to 1.102 Å from the hydroxyl group O38; this is chemically unreasonable. Although there are unusual torsion angles in both of the atorvastatin anions, they are not overly concentrated in the side chain of molecule 1. Except for the side chain of anion 1, the reasonable agreement between the refined and optimized structures is evidence that the experimental structure is correct (van de Streek and Neumann, Reference van de Streek and Neumann2014). The rest of this discussion concentrates on the CRYSTAL-optimized structure. The asymmetric unit (with atom numbering) is illustrated in Figure 6, and the crystal structure is presented in Figures 7(a) and 7(b).

Figure 5. (Color online) Comparison of the Rietveld-refined (red) and CRYSTAL14-optimized (blue) structures of ACT.

Figure 6. (Color online) The asymmetric unit of ACT, with the atom numbering. The atoms are represented by 50% probability spheroids.

Figure 7. (Color online) (a) The crystal structure of ACT, viewed down the a-axis. (b) The crystal structure of ACT, viewed down the b-axis.
The most prominent feature of the crystal structure (Figure 7) is a hydrophilic (calcium, water molecules, and hydroxyl groups) layer parallel to the ab-plane. The atorvastatin anions bond to each side of the hydrophilic layer, forming a triple layer. The phenyl rings on the outside of these triple layers interdigitate. The calcium coordination sphere is distorted octahedral. The equatorial plane is composed of bridging carboxylate groups (each oxygen bonded to one calcium) from each of the two atorvastatin anions. The axial coordination is the hydroxyl group O43 from anion 1 and the coordinated water molecule O42. The calcium lies 0.244 Å from the center of the six oxygen atoms. The average deviation of an O–Ca–O angle from the ideal octahedral value is 7.7(85)°. The square root of the average angular variance calculated by Platon (Spek, Reference Spek2009) is 13.7°. The calcium atomic valence calculated from the sum of the bond valences (Brown, Reference Brown2002) is 2.06.
All of the bond distances and almost all of the bond angles and torsion angles fall within the normal ranges indicated by a Mercury Mogul Geometry check (Macrae et al., Reference Macrae, Bruno, Chisholm, Edington, McCabe, Pidcock, Rodriguez-Monge, Taylor, van de Streek and Wood2008). The C70–C69–C68 angle of 120.5° (average = 114.2(15), Z-score = 4.1) is flagged as unusual. The Z-score is probably the result of the relatively low standard deviation on the average. The C16–C15–N32–C31 torsion angle is flagged as unusual. This describes the orientation of one of the phenyl rings in anion 1 in respect to the core of the molecule. The torsion angles C36–C35–C34–N28 and C36–C35–C34–C30 are also flagged as unusual. These describe the orientation of the side chain of anion 1 with respect to the core of the molecule.
The RMS Cartesian displacement of the non-hydrogen atoms in the two atorvastatin anions is 1.983 Å [Figure 8(a)]. The largest differences are in the conformations of the side chains, but there are significant differences throughout the molecule. Including the Flexibility option in Mercury Automatic Overlay decreases the RMS displacement to 0.605 Å [Figure 8(b)]. Both ligands have the R,R configuration, as expected.

Figure 8. (Color online) (a) Comparison of the two atorvastatin anions. Anion 1 is indicated in green and anion 2 is in orange. (b) Comparison of the two atorvastatin anions, after invoking the Flexibility option in Mercury Molecule Overlay. Anion 1 is indicated in green and anion 2 is in orange.
Quantum chemical geometry optimizations (DFT/B3LYP/6-31G*/water) using Spartan ‘18 (Wavefunction, 2018) indicated that the observed conformations of anions 1 and 2 are 25.1 and 18.7 kcal mol−1 higher in energy than their respective local minima. The local minimum of anion 1 is 1.0 kcal mol−1 lower in energy than that of anion 2. This difference is approximately the expected error of such calculations, so the two conformations should be considered equivalent in energy. The global minimum energy conformation (found by a molecular mechanics conformational search) was more compact than the observed conformations and contained intramolecular hydrogen bonds. The carboxyl-containing side chain and the phenyl ring connected to the central five-membered ring by the amide linkage rotate toward each other to form a charge-assisted N–H⋯O intramolecular hydrogen bond. Thus, intermolecular interactions are important in determining the solid-state conformation.
The analysis of the contributions to the total crystal energy using the Forcite module of Materials Studio suggests that angle distortion terms are dominant in the intramolecular deformation energy and that torsion contributions are also significant. The intermolecular energy is dominated by electrostatic attraction, which in this force-field-based analysis include hydrogen bonds. The hydrogen bonds are better analyzed using the results of the DFT calculation.
Hydrogen bonds are prominent in the crystal structure (Table I). The two free water molecules (O89 and O86) act as donors in two strong O–H⋯O hydrogen bonds. The coordinated water molecule (O42) forms one stronger O–H⋯O hydrogen bond and one weaker hydrogen bond. The hydroxyl groups O38 and O43 (coordinated to Ca) both participate in strong O–H⋯O hydrogen bonds to the free water molecules. The hydroxyl group O65 forms a strong O–H⋯O hydrogen bond to the carboxyl oxygen O85. The remaining hydroxyl group O83–H160 does not form conventional hydrogen bonds; there are small but significant overlap populations between H160 and H148 and H151. The O–H⋯O hydrogen bonds form a two-dimensional network parallel to the ab-plane. The amide nitrogen N77 forms an N–H⋯O hydrogen bond to the ketone O78, while the amide in N32 participates in an N–H⋯C hydrogen intramolecular bond. There are 12 C–H⋯O hydrogen bonds. Although probably individually weak, the large number means that they contribute significantly to the crystal energy.
Table I. Hydrogen bonds (CRYSTAL14) in ACT Form I.

a Intramolecular.
The volume enclosed by the Hirshfeld surface (Figure 9; Hirshfeld, Reference Hirshfeld1977; Turner et al., Reference Turner, McKinnon, Wolff, Grimwood, Spackman, Jayatilaka and Spackman2017) is 1502.88 Å3, 98.79% of the unit cell volume. The molecules are thus not tightly packed. All of the significant close contacts (red in Figure 9) involve the hydrogen bonds.

Figure 9. The Hirshfeld surface of ACT. Intermolecular contacts longer than the sums of the van der Waals radii are colored blue, and contacts shorter than the sums of the radii are colored red. Contacts equal to the sums of radii are white.
The Bravais–Friedel–Donnay–Harker (Bravais, Reference Bravais1866; Friedel, Reference Friedel1907; Donnay and Harker, Reference Donnay and Harker1937) morphology suggests that we might expect platy morphology for ACT, with {001} as the major faces, consistent with the layered nature of the structure. A fourth-order spherical harmonic preferred orientation model was included in the refinement; the texture index was 1.028, indicating that preferred orientation was slight in this rotated capillary specimen. The powder pattern of ACT from this synchrotron data set has been submitted to ICDD for inclusion in the PDF.
IV. DEPOSITED DATA
The CIF files containing the results of the Rietveld refinement (including the raw data) and the DFT geometry optimization were deposited with the ICDD. The data can be requested at info@icdd.com.
ACKNOWLEDGEMENTS
The use of the Advanced Photon Source at Argonne National Laboratory was supported by the U.S. Department of Energy, Office of Science, Office of Basic Energy Sciences, under Contract No. DE-AC02-06CH11357. This work was partially supported by the International Centre for Diffraction Data. We thank Lynn Ribaud and Saul Lapidus for their assistance in the data collection, and Andrey Rogachev for the use of computing resources at IIT.
CONFLICTS OF INTEREST
The authors have no conflicts of interest to declare.