I. INTRODUCTION
There is a combination of factors that occur in some specimens that can make quantitative analysis difficult. This is especially true if the quantification is done without the use of standards, using one of the standardless methods based on fundamental parameters. One such factor is features in the spectrum that interfere with weak peaks from trace elements. The features may come from a poorly behaved background, from simply too much background to allow sufficiently low detection limits, from diffraction peaks due to large grains, or from scattered anode lines. Diffraction peaks in particular are common and have been well documented and investigated by several authors (Scruggs et al., Reference Scruggs, Haschke, Herczeg and Nicolosi2000, Sutton et al., Reference Sutton, Rivers and Smith1986, Tissot and Goehner, Reference Tissot and Goehner1992, and Verkhovodov, Reference Verkhovodov2005). In micro-XRF, the particular spot on the specimen may be important. Hence, it may not be possible to move to a different location to help reduce the artifacts or make a definitive quantification of an element subject to interference. The usual method for removing or reducing these features is the use of a primary beam filter. Such a filter will pass higher-energy radiation while blocking lower energy primary radiation due to the dramatic energy dependence of the mass absorption coefficient. The use of absorption edges in the filter allows further control of the primary spectrum to render specific regions free of spurious features.
Specimens that have important light elements make use of primary beam filters difficult or impossible. If the major components of the matrix are light elements (here taken to mean elements with characteristic emission lines below about 3 to 5 keV), then quantification of these major elements is essential to quantify their effects on heavier elements. This is true even if only the trace elements are of interest since the matrix composition will dominate the quantitative analysis of any standardless method (and many methods using standards).
Examples of specimens that exhibit these difficulties are metal alloys with aluminum and/or silicon and geological samples or gemstones. Metal alloys often have preferential ordering, causing strong diffraction peaks to appear in the XRF spectrum. Specific trace metals that are often important are trace lead for RoHS screening as well as chromium, manganese, tungsten, and molybdenum for alloy identification. Diffraction peaks in steels and other metal alloys typically seem to occur in the spectral regions of Cr(K) and Mn(K) degrading detection limits and causing errors in quantification. These artifacts are greatly reduced by the use of primary beam filters, but their use also reduces the signal from aluminum and silicon, which are important elements in some alloys. These lighter elements, if present, will cause large matrix corrections and thus it is important to detect and quantify them.
Gemstones and many other geological samples are usually highly crystalline, which almost guarantees that some diffraction peaks will be present in the XRF spectrum. The matrix for these materials is aluminosilicate, so quantification of aluminum and silicon is mandatory for any standardless method. Trace metals are important for determining specimen provenance and for distinguishing natural from artificial gemstones.
Standardless methods based on fundamental parameter calculation of the expected net intensities for each element are capable of making this calculation for a variety of excitation and measurement conditions. In principle, net intensities taken under different measurement conditions can be used for quantification. As long as each calculated intensity is compared to measured intensities taken under the conditions that are used for the calculation, the quantitative results should be correct. Of course, the accuracy will depend on how well the fundamental parameter calculation can correct

Figure 1. (Color online) X-ray fluorescence spectra from two locations on a specimen of CDA955 copper alloy. The vertical axis has been expanded to show the background and weaker peaks. Note the distortion of the Mn peak, spurious peaks near 3 and 5 keV, and the varying background near the Pb peak. These distortions make the Mn and trace element quantification unreliable.
for different conditions. This paper will present the results of an investigation of two specimens that suffer from the above difficulties and that have been quantified without the use of standards. The specimens are quantified first without the use of a primary-beam filter, then with an appropriate filter in the primary beam. The two spectra (with and without the filter) are then used together, with some elements quantified using one spectrum and some quantified using the other spectrum. The results are compared and the benefits and drawbacks are discussed.
II. FIRST EXAMPLE: COPPER ALLOY CDA955
CDA955 is a majority copper alloy with approximately 10% Al plus minor amounts of manganese, iron, and nickel. It also contains trace amounts of silicon, tin, zinc, and lead. It thus contains both light and heavy elements covering a wide range of concentrations. The grain orientation can cause diffraction peaks, as will be evident in the spectra below.
A copper alloy specimen was obtained as a disk from Brammer standards (Houston, TX) of alloy CDA955 with a certified composition. The specimen was measured on an EDAX Orbis XRF spectrometer with a Rh anode X-ray tube operated at 40 kV and an 80 mm2 Si(Li) detector. This instrument had a 30 μm polycapillary optic in the primary beam. A digital pulse processor was used with a pulse shaping time of 25.6 μs and hardware pulse pileup rejection. Data were collected for 300 s with the specimen chamber evacuated. For the spectrum without a filter (the primary beam is open), the X-ray tube was operated at an emission current of 20 μA. A 127-μm-thick niobium primary beam filter was used for the second spectrum and in this case the X-ray tube current was increased to 1000 μA.
Figure 1 shows the XRF spectrum from two different locations on the specimen. With the 30 μm polycapillary optic only a small spot is illuminated. The different regions can be compared to determine which features are associated with the bulk material and which are spurious or not representative. This provides a convenient method to verify
whether each spectrum suffers from the difficulties being investigated. In the more general case, comparing different locations may not be possible. It is hoped that the method being developed here will make it possible to distinguish spurious features and allow reliable quantification even in the presence of the difficulties.
The vertical scale has been expanded to better show the weaker peaks and the background. The major element peaks are off scale. Note the differences between the two locations near the tin L emission line at 3.44 keV in Figure 1. There are similar discrepancies below the manganese K α emission line at 5.90 keV and between the manganese and iron emission lines (the iron K α emission line is at 6.40 keV). There is also a large variable background where the lead L peaks should be. It would be very difficult to reliably detect the lead in this specimen using either of these spectra.
A primary-beam filter of 127-μm-thick niobium eliminates most of these spurious features. Figure 2 shows the same two locations but with the filter in the primary beam. Now the transition metal peaks are reliable and the lead peak is clearly visible. Lead can be readily detected and quantified using these spectra. However, the aluminum peak is very small and the Sn peak is lost. Note the presence of the copper L peak below the aluminum peak. Even though the filter dramatically reduces the primary X-ray intensity at lower
TABLE I. Standardless quantification using each spectrum separately.
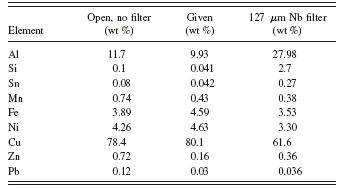
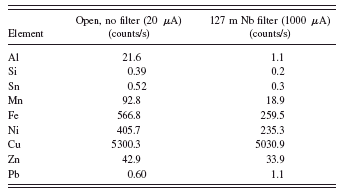
TABLE II. Net intensities from the spectra with and without the filter.
energies, the copper L emission is still excited by cascade from copper K and the aluminum K is still weakly excited by secondary fluorescence.
The net intensities from the red spectra in Figures 1 and 2 were extracted by a linear least-squares fit and used to produce a quantitative estimate of the amount of each element present. A standardless method was used, which relies on fundamental parameter calculations and normalization of the elements to 100% (Elam et al., Reference Elam, Shen, Scruggs and Nicolosi2004). Since all of the elements present are observed in the XRF spectrum, this normalization is appropriate and allows quantification without the use of any standards.
The specimen was initially quantified using each spectrum separately in the conventional manner. Net intensities from each spectrum were used to quantify all of the elements present. Table I shows the results of this quantification compared to the values from the certificate supplied by the manufacturer. If we use the spectrum taken with the unmodified primary radiation (no filter), the trace quantification is very poor. The lead level in particular is four times too high. Note that the lead quantification would fail a RoHS screening test at ∼700 ppm and would force further tests on this specimen even though it is well below the RoHS regulatory level. With the niobium filter, the aluminum value is so far off that it affects all the other results because the matrix composition is incorrect.
We would like to use the quant results without the filter for aluminum, silicon, and tin and the results with the filter for all the others. However, the intensities are very different for the change in conditions. Can the FP method correct for
TABLE III. Standardless quantification results using both spectra. See text for details.
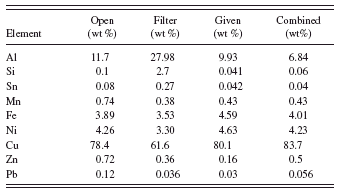

Figure 3. (Color online) Micro-XRF spectra from two locations on a sanidine mineral standard. Clear diffraction peaks are labeled and the variations with location make it difficult to determine the Cr and Mn contents.
these different measurement conditions adequately to give acceptable quantification results? Table II gives the net intensities obtained from each of the spectra.
The intensities are about the same for the transition metals in the two spectra. The increase in the tube current has approximately compensated for the loss by introducing the filter. However, the count rate for the aluminum peak is reduced by a factor of 20 and the silicon and tin peaks are also reduced significantly. The change in tube emission current is simply a multiplicative factor, but the energy dependence results from the strong energy dependence of the mass absorption coefficient of the filter material. The tabular values of the niobium absorption cross sections will be required to compensate for this if we use net intensities from the filtered spectrum for the higher energy peaks and the unfiltered spectrum for the low energy peaks.
In Table III the two columns from Table I for the separate spectra are reproduced, as are the given values. Now the given values are moved over for easier comparison to the combined result. The combined column gives the results of using the open spectrum (no filter) to quantify aluminum, silicon, and tin. The filtered spectrum is used to quantify the remaining elements. Note that both sets of elements are used together in the normalization to 100%.
By using the fundamental parameter method to combine the two spectra, we get good results for all elements. Lead is now quantified well enough to pass RoHS screening and get accurate categorization. The matrix composition is correct and the values of iron and other elements are thus obtained with the expected accuracy. Zinc is still too high because of the overlap of the strong copper K beta peak
III. SECOND EXAMPLE: SANIDINE MINERAL CHIPS
The mineral sanidine is a very crystalline material that often exhibits diffraction peaks in the XRF spectrum. It has chemical formula KAlSi3O8 and thus is composed mostly of sodium and aluminum silicates. In its natural state, it also has trace amounts of several metals, such as iron. The precise quantification of these trace elements is important for provenance determination.

Figure 4. (Color online) Two locations on the sanidine sample taken with a 250 μm aluminum filter. This eliminates the diffraction peaks as expected and yields believable trace element peaks. However the sodium peak is no longer visible.
Several chips of sanidine were measured as part of a mineral standard from SPI Supplies, Inc. (West Chester, PA). This standard contains 53 minerals mounted in epoxy with a polished surface and is intended as a standard for electron microprobe analysis. The manufacturer supplies a certificate with analytical values for major, minor, and trace elements. However, these are natural materials and not all trace elements in each chip are quantified. The specimen was measured as received. Typical chip sizes are about 50×200 μm2 as estimated from electron micrographs in the supplier catalog. A typical specimen has several tens of chips. With the 30 μm polycapillary used for these measurements only a single chip is illuminated at one time by the primary X-ray beam.
The specimen was again measured on an EDAX Orbis XRF spectrometer with a Rh anode X-ray tube operated at 30 kV, an 80 mm2 Si(Li) detector, and a 30 μm polycapillary optic in the primary beam. For the spectrum without a filter (the primary beam is open), the X-ray tube was operated at an emission current of 60 μA. A 250-μm-thick aluminum primary-beam filter was used for the second spectrum and in this case the X-ray tube current was increased to 300 μA. The live time, pulse processing, and chamber atmosphere were the same as for the CDA955 example above.
Figure 3 shows the spectra taken from two locations. As for the copper alloy example, there are spurious features in
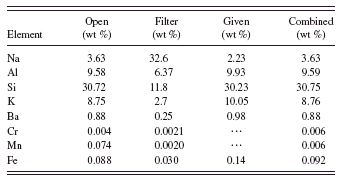
TABLE IV. Quantitative results for the open spectrum (no filter) and the spectrum with a 250 μm aluminum filter analyzed separately.
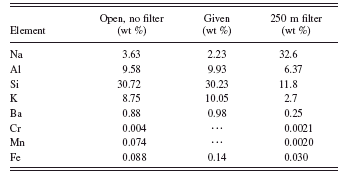
TABLE V. Combined method quantitative results.
the spectrum that are location dependent. Several diffraction peaks are clearly visible and comparable in size to the trace element peaks. It is difficult to state whether there is any manganese or chromium present in the sample above the usual detection limits and the region around 9 keV is particularly distorted.
A primary-beam filter of 250 μm of aluminum eliminates the diffraction peaks as shown in Figure 4. Now we can believe the trace metal peaks, but the Na peak is gone. The spectra were quantified as for the copper alloy example, with the exception that the oxygen content was entered as a known amount using the value from the supplier of 46.28 wt % for all analyses. With this information the normalization to 100% could again be used without resorting to determining the oxygen by stoichiometry. This was done to prevent the oxygen stoichiometry from adding an additional variable into the results.
Tables IV and V give the quantitative results for analyzing each spectrum individually in the conventional manner and for the combined method presented here. For quantification using only the spectrum with unmodified primary radiation (no filter), the quantification looks pretty good but we cannot really believe the trace metal peaks. For example, without the filter, the manganese result is of the same order as the iron impurity. If we quantify with the filtered spectrum, then the trace metal values, especially for manganese, are more consistent with the differences in spectral peak intensities between Mn(K) and Fe(K). However, the quantification of the light elements is very poor, which throws the Fe quantification off because the matrix is wrong. The combined method again gives good results for all elements. Agreement with the values from the supplier is excellent for all constituents listed and the values for the trace amounts of chromium and manganese (not listed in the certificate) are reasonable.
IV. CONCLUSION
In micro-XRF analysis, one often encounters microcrystalline particles of metals or gemstone chips. These and other samples can have problems with X-ray fluorescence quantitative analysis because they contain both light and heavy elements and they exhibit interferences from background and/or spurious peaks. The situation can be improved by collecting a spectrum with unfiltered excitation to obtain the low energy region and then collecting a separate spectrum with a primary-beam filter to obtain reliable elemental intensities free from diffractive artifacts for the (heavier) trace elements. Using multiple spectra with a unified fundamental parameter method can allow these samples to be quantified via a standardless analysis. We have developed this method and successfully employed it for analysis of a copper alloy and a sanidine mineral chip. The combined method gives better results for all elements than the single spectrum quantification as judged by agreement with the values from the supplier. The next step in our work is to extend the examples to other variations in measurement conditions, such as combining different tube voltages.


