I. INTRODUCTION
Zirconium is a metal with below-normal c/a ratio (c/a <1633). Zirconium has very low absorption cross-section for thermal neutrons, high hardness, ductility, and corrosion resistance. Therefore, zirconium and zirconium-rich alloys are used in the nuclear industry, specifically for the fuel element cladding tubes of light water reactors (Murty, Reference Murty1989). Coated tubes form a barrier against the escape of fission products into the coolant, contributing at the same time to the geometrical stability of the reactor active zone. For the crucial importance for nuclear reactor safety, an extraordinary attention is paid to the properties and behavior of zirconium under extreme conditions.
To better understand such behavior and further improve operating characteristics of the fuel, it is also very important to examine in detail the dependence of the zirconium mechanical properties on its structure and texture. The present paper aims to contribute to the mentioned issues by revealing the texture changes caused in α-zirconium by application of uniaxial tension performed under several different conditions.
In our work, the texture of two series of zirconium samples is investigated by means of neutron and X-ray diffraction. The first set of samples was deformed on uniaxial tensile machine INSTRON 5882 at room temperature (RT), whereas an elevated temperature (300 °C) was applied during the second set deformation. Both the series of samples were deformed in the step-like manner (strain step 5%) up to the final strain 30%.
Experimental pole figures are used, together with values of inverse pole figures calculated by Mueller formula (Horta et al., Reference Horta, Roberts and Wilson1969), to analyze the preferential orientation of grains.
A majority of zirconium texture analyses deals, in the first order, with the basal pole distribution being of a key importance for the resulting material properties. On the other hand, distribution of prismatic or pyramidal plane poles can serve as a strong indicator for the degree of annealing and, moreover, is of significant importance for a more detail quantitative texture analysis performed by means of the orientation distribution function (ODF) of grains (Tenckhoff, Reference Tenckhoff2005).
Plastic deformation in α-zirconium is realized by slip and twinning mechanisms. The most frequent slip occurs on the
![]() $\lcub 10\bar 10\rcub $
first-order prism planes along the
$\lcub 10\bar 10\rcub $
first-order prism planes along the
![]() $\langle 12\bar 30\rangle $
direction. The same direction is preferred in the case of slip on the basal planes. In regions of a high-stress concentration, the
$\langle 12\bar 30\rangle $
direction. The same direction is preferred in the case of slip on the basal planes. In regions of a high-stress concentration, the
![]() $\lcub 10\bar 11\rcub $
slip is observed. Activation of slip with the 〈c〉 component was also noticed on the first- and second-order pyramidal planes
$\lcub 10\bar 11\rcub $
slip is observed. Activation of slip with the 〈c〉 component was also noticed on the first- and second-order pyramidal planes
![]() $\lcub 10\bar 11\rcub $
and
$\lcub 10\bar 11\rcub $
and
![]() $\lcub 11\bar 21\rcub $
along the 〈c + a〉 direction (Tenckhoff, Reference Tenckhoff2005). Most common twinning modes are
$\lcub 11\bar 21\rcub $
along the 〈c + a〉 direction (Tenckhoff, Reference Tenckhoff2005). Most common twinning modes are
![]() $\lcub 10\bar 12\rcub $
$\lcub 10\bar 12\rcub $
![]() $\langle \bar 1011\rangle $
tensile twins and
$\langle \bar 1011\rangle $
tensile twins and
![]() $\left\{{11\bar 22} \right\}\langle \bar 1\bar 123\rangle $
compressive twins at RT and
$\left\{{11\bar 22} \right\}\langle \bar 1\bar 123\rangle $
compressive twins at RT and
![]() $\left\{{10\bar 11} \right\}\langle 10\bar 12\rangle $
twins at the elevated temperatures (Tenckhoff, Reference Tenckhoff2005).
$\left\{{10\bar 11} \right\}\langle 10\bar 12\rangle $
twins at the elevated temperatures (Tenckhoff, Reference Tenckhoff2005).
II. SAMPLES
The initial α-zirconium plate was forged, hot rolled to the thickness 3.3 mm and annealed at 664 °C for several hours. Shape, dimensions, and coordination system of the tensile specimens prepared from the treated plate are shown in Figure 1 (here ND, TD, and RD stand for the normal, transverse, and rolling directions, respectively). The purity of the zirconium material was checked by mass spectroscopy and the vacuum extraction method. The main impurities are indicated in Table I.
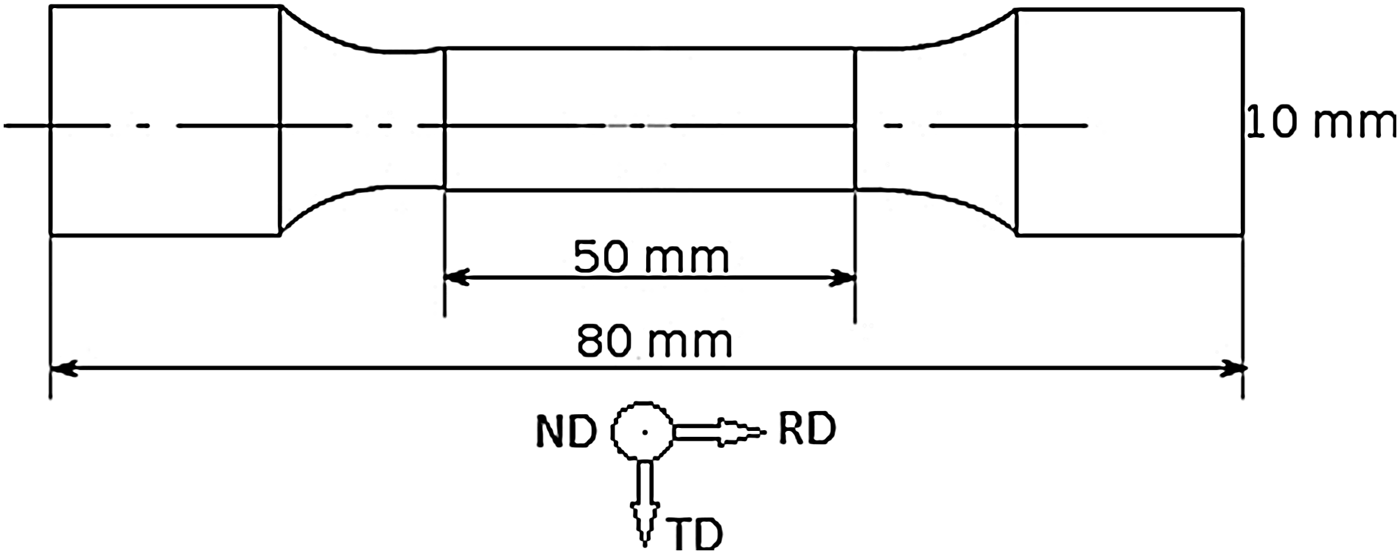
Figure 1. Shape and dimensions of measured zirconium samples.
Table I. Amount of impurities in the measured zirconium samples.

III. DIFFRACTION EXPERIMENTS
The neutronographic texture measurements were performed on the KSN-2 neutron diffractometer situated at the horizontal channel of the research reactor LVR-15 located in the Nuclear Research Institute, plc. Rez, Czech Republic. The monochromatic neutrons having wavelength 0.1362 nm were used. The single-crystal Cu(200) was used as monochromator. The KSN-2 diffraction device offers good intensity and the best resolution value of Δd/d = 0.007 in the region d ~1.0 ÷ 0.1 nm (d is interplanar spacing). The samples were mounted in reflection geometry with its normal parallel to the direction of interest – usually RD, TD, or ND – and the reflected intensities were measured depending on the Bragg angle. All the obtained neutronographic patterns were corrected for the non-linear background and then evaluated using the Rietveld method implemented in the software package GSAS (Larson et al., Reference Larson and Von Dreele1997). The resulting peak intensities were normalized to the intensities of a standard sample (sample with grains randomly oriented) using the Mueller formula and the relative pole densities of the selected crystallographic planes p hkil along the principal directions ND, RD, and TD were obtained. The latter reflect the relative level of the preference of the grains being oriented with the particular crystallographic direction along the corresponding direction of the specimen under test. In untextured sample with random orientation of grains, p hkil = 1. Value p hkil > 1 along a certain specimen direction says that, within the tested sample volume, more crystalline grains are oriented by the examined plane {hkil poles parallel to the selected specimen direction than it is the case in the untextured specimen. The method and its application on characterization of zirconium textures is in more details described elsewhere (Vetvicka, Reference Vetvicka2014).
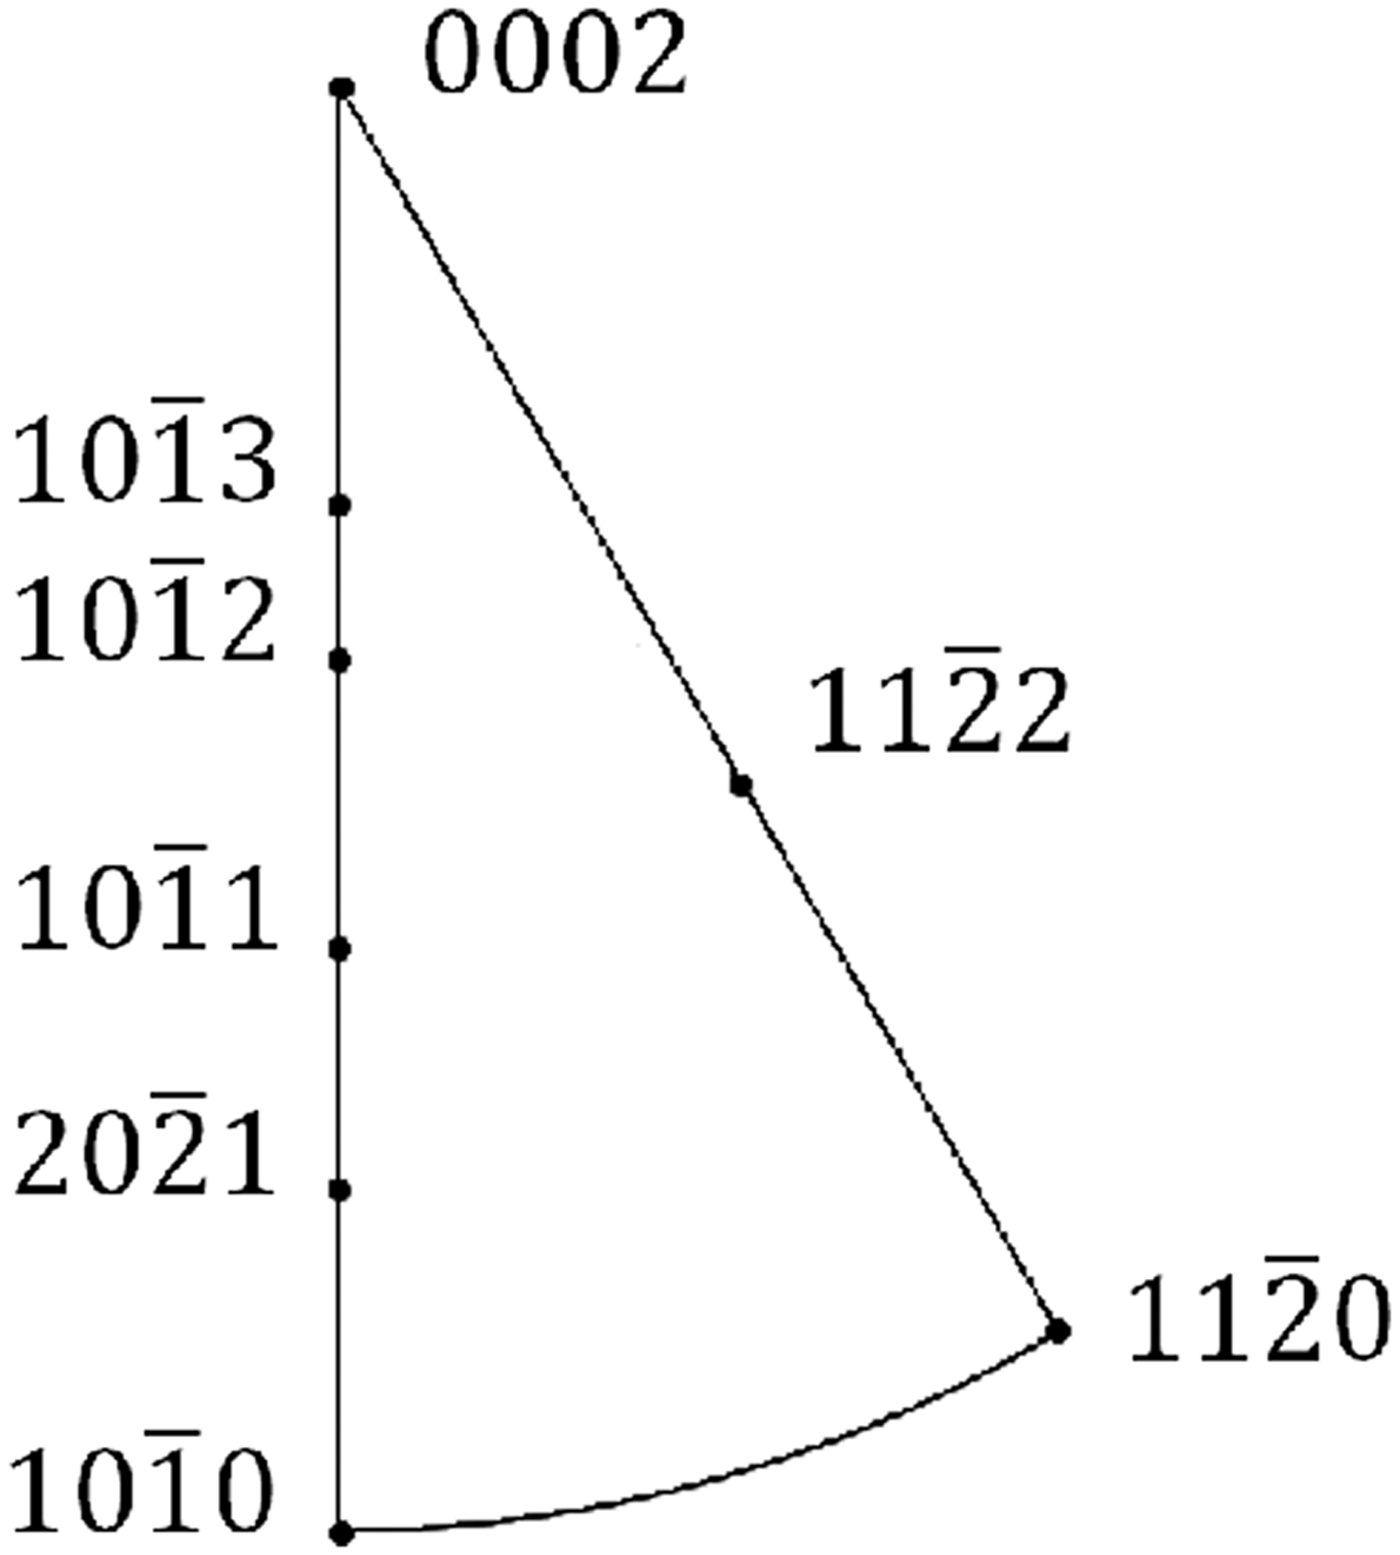
Figure 2 shows the positions of crystallographic poles within the inverse pole figure of zirconium.
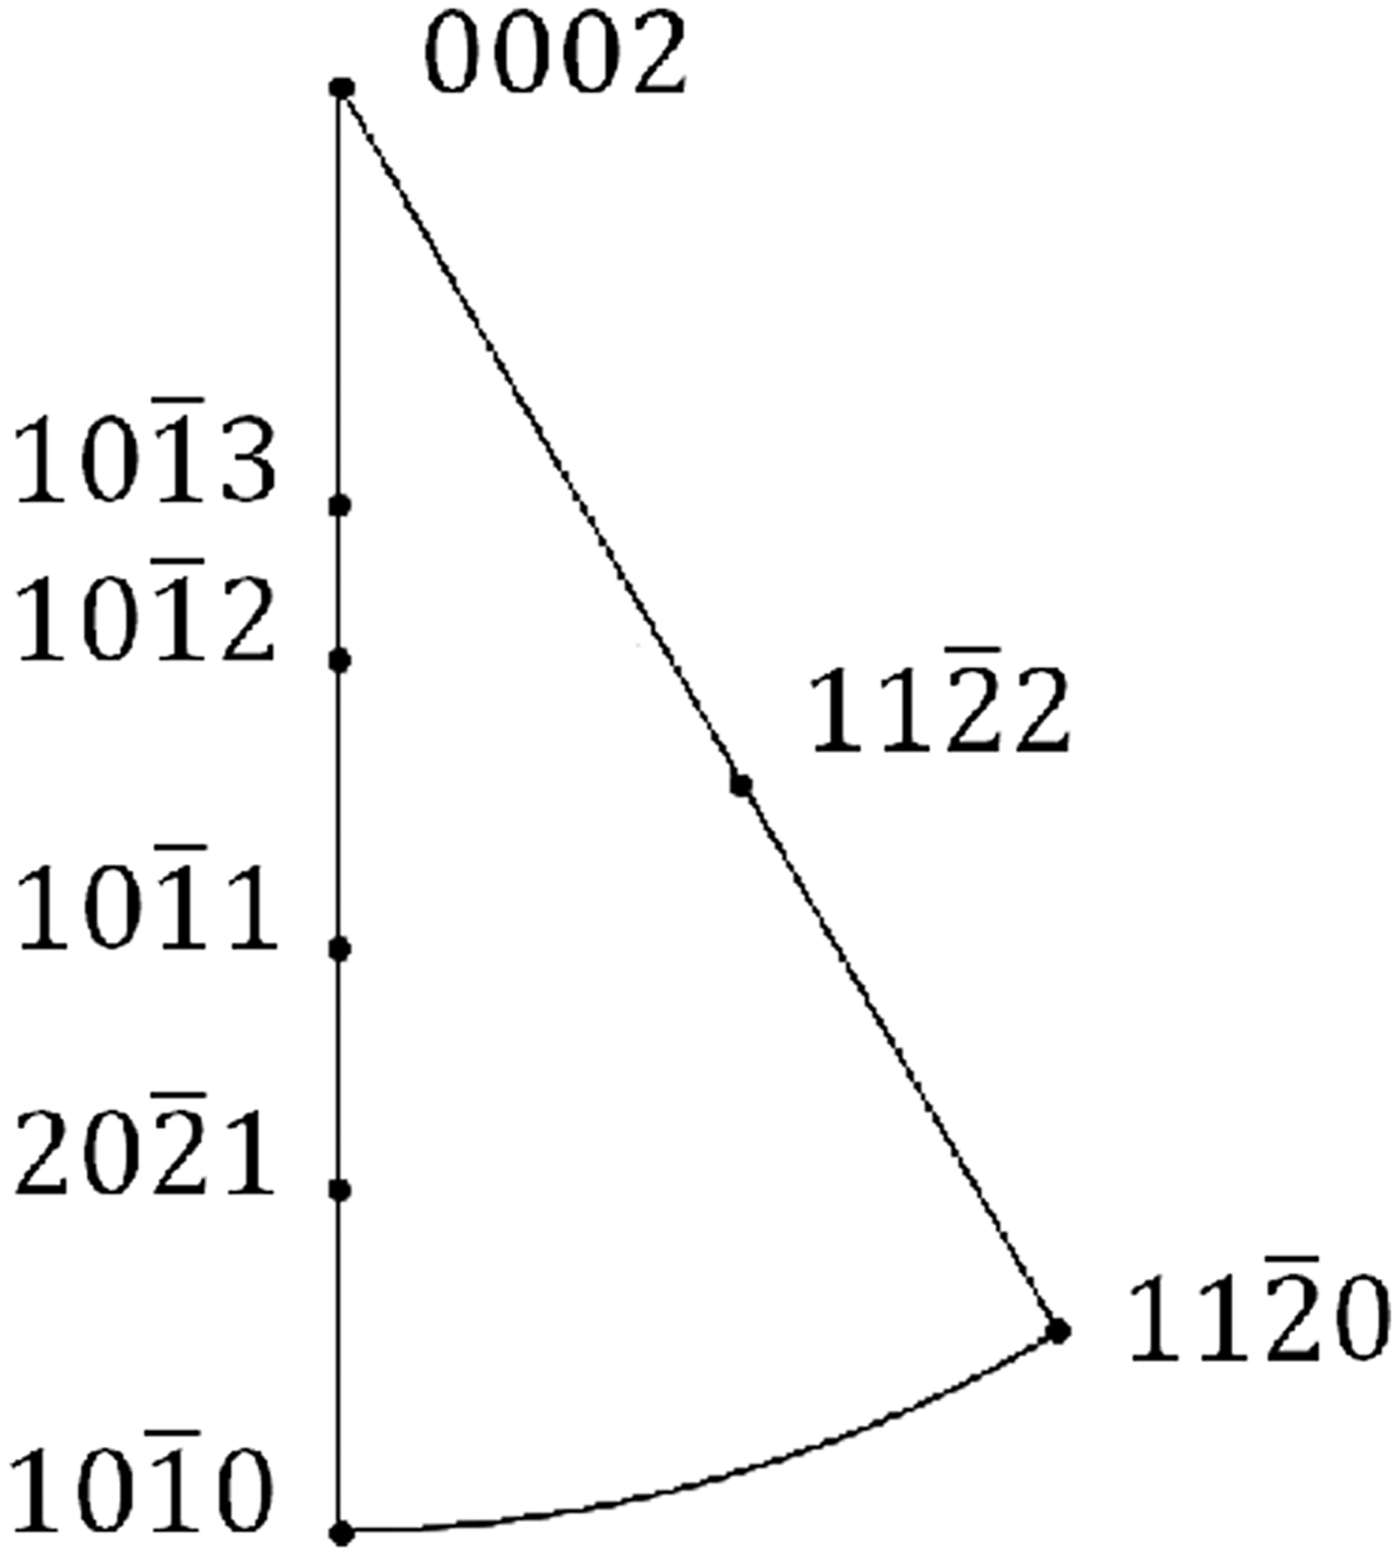
Figure 2. Location of the reflection plane poles on the stereographic projection of the symmetrically non-equivalent spherical triangle of α-zirconium.
The X-ray texture measurements were performed at theta/theta X'Pert PRO diffractometer with Cr X-ray tube. The range of the sample inclinations was from 0° to 80°. Full pole figures for planes (0002) and
![]() $\lpar 10\bar 10\rpar $
were calculated from the ODF determined using the measured incomplete pole figures (the limiting polar angle being 70°). Software package X'Pert Texture, PANalytical was used to perform the calculations.
$\lpar 10\bar 10\rpar $
were calculated from the ODF determined using the measured incomplete pole figures (the limiting polar angle being 70°). Software package X'Pert Texture, PANalytical was used to perform the calculations.
IV. RESULTS
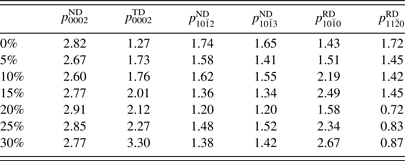
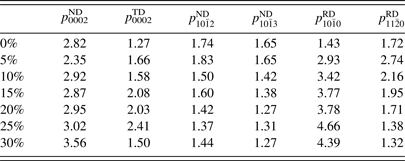
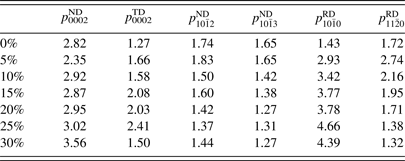
Pole densities p hkil calculated by the Mueller formula are summarized in Table II (RT) and Table III (300 °C).
Table II. Calculated p hkil values of the chosen crystallographic planes (cf. Figure 2) and the principal specimen directions obtained for the samples deformed at RT.
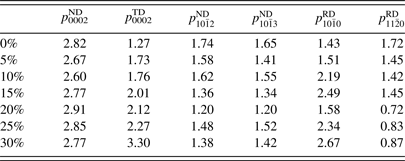
Table III. Calculated p hkil values of the chosen crystallographic planes (cf. Figure 2) and the principal specimen directions obtained for the samples deformed at 300 °C.
Measured pole figures for planes (0002) and
![]() $\lpar 10\bar 10\rpar $
for samples deformed at 5, 15, and 30% at RT and 300 °C are shown in Figure 3.
$\lpar 10\bar 10\rpar $
for samples deformed at 5, 15, and 30% at RT and 300 °C are shown in Figure 3.

Figure 3. (Colour online) Pole figures of planes (0002) and
![]() $\lpar 10\bar 10\rpar $
observed for the samples deformed at 5, 15, and 30% at RT and 300 °C, respectively.
$\lpar 10\bar 10\rpar $
observed for the samples deformed at 5, 15, and 30% at RT and 300 °C, respectively.
V. DISCUSSION
The orientation of basal poles is found to be tilted from ND toward TD by ±45° for both deformation conditions (Figure 3). Such orientation was already observed (Santisteban et al., Reference Santisteban, Vicente-Alvarez, Vizcaino, Banchik, Vogel, Tremsin, Vallerga, McPhate, Lehmann and Kockelmann2012) and interpreted as evidence of
![]() $\left\{{11\bar 22} \right\}\, \langle \bar 1\bar 123\rangle $
compressive twinning mode around 60°. The intensity ratios p
hkil
(Tables II and III) are compatible with latter result. The values p
0002
ND and p
0002
TD are significantly higher than 1 and the value of p
0002
TD is markedly increasing with the deformation ratio, especially for the samples deformed at RT, what indicates a gradual tilt of the basal poles toward TD. The value of pole density p
0002
ND does not significantly change during the deformation at RT (Table II). On the other hand, p
0002
ND grows remarkably (from 2.82 to 3.56) during the deformation at 300 °C (Table III).
$\left\{{11\bar 22} \right\}\, \langle \bar 1\bar 123\rangle $
compressive twinning mode around 60°. The intensity ratios p
hkil
(Tables II and III) are compatible with latter result. The values p
0002
ND and p
0002
TD are significantly higher than 1 and the value of p
0002
TD is markedly increasing with the deformation ratio, especially for the samples deformed at RT, what indicates a gradual tilt of the basal poles toward TD. The value of pole density p
0002
ND does not significantly change during the deformation at RT (Table II). On the other hand, p
0002
ND grows remarkably (from 2.82 to 3.56) during the deformation at 300 °C (Table III).
Santisteban et al. (Reference Santisteban, Vicente-Alvarez, Vizcaino, Banchik, Vogel, Tremsin, Vallerga, McPhate, Lehmann and Kockelmann2012) observed that part of the {0002} poles was also oriented along the tensile direction (RD) for samples deformed at RT as well as at 300 °C. Such rotation coheres with the
![]() $\left\{{10\bar 12} \right\}\, \langle 10\bar 11\rangle $
tensile twinning mode (Allen et al., Reference Allen, Quinta da Fonseca, Preuss, Robson, Daymond and Comstock2009). In our case, such orientation is only found in X-ray pole figures obtained on the sample deformed at 300 °C. No evidence for such texture component is indicated by neutron diffraction giving values p
0002
RD around 0.01 and 0.1 for samples deformed at RT and 300 °C, respectively.
$\left\{{10\bar 12} \right\}\, \langle 10\bar 11\rangle $
tensile twinning mode (Allen et al., Reference Allen, Quinta da Fonseca, Preuss, Robson, Daymond and Comstock2009). In our case, such orientation is only found in X-ray pole figures obtained on the sample deformed at 300 °C. No evidence for such texture component is indicated by neutron diffraction giving values p
0002
RD around 0.01 and 0.1 for samples deformed at RT and 300 °C, respectively.
From the calculated values
![]() $p_{10\bar 10}^{{\rm RD}} $
(Tables II and III) it follows that
$p_{10\bar 10}^{{\rm RD}} $
(Tables II and III) it follows that
![]() $\left({10\bar 10} \right)$
plane poles orient to be parallel to RD for both deformation conditions. The same situation is observed in case of
$\left({10\bar 10} \right)$
plane poles orient to be parallel to RD for both deformation conditions. The same situation is observed in case of
![]() $\left({11\bar 20} \right)$
planes.
$\left({11\bar 20} \right)$
planes.
The
![]() $\lpar 10\bar 12\rpar $
and
$\lpar 10\bar 12\rpar $
and
![]() $\lpar 10\bar 13\rpar $
plane poles prefer to be collinear with ND (Tables II and III).
$\lpar 10\bar 13\rpar $
plane poles prefer to be collinear with ND (Tables II and III).
VI. CONCLUSIONS
The above-mentioned texture changes observed on the α-zirconium samples subjected to tensile test performed under different thermal conditions can be summarized as follows:
-
• The rotation of {0002} poles from the normal direction toward the transverse direction is remarkably preferred for all the measured samples and is not affected by change of the tensile test conditions.
-
• From the X-ray texture measurements it can be seen that the
 $\left\{{10\bar 12} \right\}\, \langle 10\bar 11\rangle $
tensile twinning mode is taking place for the deformation performed at 300 °C only.
 -
• The temperature increase of the tensile test from the RT to 300 °C results in increase of the overall texture sharpness.
-
• Bulk texture provided by neutron diffraction generally corresponds with the texture obtained by the X-ray diffraction.
-
• Overall level of the resulting texture increases the deformation progress.
ACKNOWLEDGEMENTS
This work was supported by the Grant Agency of the Czech Technical University in Prague (grant no. SGS13/219/OHK4/3T/14) and the Czech Science Foundation (grant no. GACR 14-36566G).


