1. INTRODUCTION
Whenever good thermal insulation combined with high heat resistance is required, autoclaved aerated concrete (AAC) is a commonly used inorganic construction material. Unlike ordinary concrete, AAC consists up to 85% by volume of pores and results from hydrothermal treatment during production.
The main mineral phase found in AAC is tobermorite (C5S6H5), so that essential properties of AAC products such as sufficient strength for construction and low heat conductivity partially depend on this phase and its mineralogical properties. The formation process of tobermorite and its morphological characteristics have been widely investigated. Particularly the influence of doping with foreign ions on the morphology of tobermorite has been a major subject in the literature. A high amount of both aluminum and sulfate ions are assumed to be incorporated into the structure of tobermorite (Mostafa et al., Reference Mostafa, Shaltout, Omar and Abo-El-Enein2009; Matsui et al., Reference Matsui, Kikuma, Tsunashima, Ishikawa, Matsuno, Ogawa and Sato2011) and they are both abundant in customary AAC raw mixes. In tobermorite structure by coupled substitution, two moles of tetrahedral Si4+ can be replaced by Al3+ and Na+ (Wang et al., Reference Wang, Ma, Zheng and Wang2017). The substitution reflects in a larger c unit-cell parameter confirmed by several authors (Hara and Inoue, Reference Hara and Inoue1980; Jackson et al., Reference Jackson, Chae, Mulcahy, Meral, Taylor, Li, Emwas, Moon, Yoon, Vola, Wenk and Monteiro2012; Biagioni et al., Reference Biagioni, Bonaccorsi, Lezzerini and Merlino2016). Mostafa et al. suggested a substitution by (SO4)2− and compensatory 2OH− for the replacement of (SiO4)4− (Mostafa et al., Reference Mostafa, Shaltout, Omar and Abo-El-Enein2009). Besides substitution in tobermorite structure, these ions occur in different minerals in AAC. According to the literature, phases formed during autoclaving containing (SO4)2− are essentially hydroxylellestadite and anhydrite (Matsushita et al., Reference Matsushita, Aono and Shibata2005). During green cake hydration, sulfate carriers react resulting in the formation of ettringite and AFm phases (Schreiner et al., Reference Schreiner, Jansen, Ectors, Goetz-Neunhoeffer, Neubauer and Volkmann2018), though during autoclaving these unstable hydration products are decomposed enabling new formation of anhydrite. The only notable aluminum containing phase occurring in AAC is hydrogarnet, which is usually observed when Supplementary materials provide additional Al3+ (Skawinska et al., Reference Skawinska, Owsiak, Baran and Hernik2017). Some approaches describing the effect of Supplementary materials containing (SO4)2− and Al3+ on the thermal and mechanical properties of AAC with promising findings have been published (Mostafa, Reference Mostafa2005; Koutný et al., Reference Koutný, Opravil and Pořízka2014; Małaszkiewicz and Chojnowski, Reference Małaszkiewicz and Chojnowski2017). In addition, a reduction of sulfate in AAC is desirable from an environmental point of view because of rapid elution at landfills after disposal (Bergmans et al., Reference Bergmans, Nielsen, Snellings and Broos2016). For clarification of the above-mentioned reasons, the effect of (SO4)2− and Al3+ ions on tobermorite in AAC or their occurrence as minor phases should be further investigated.
The morphology of tobermorite without or with very low aluminum incorporation is described as plate-like, while Al-substituted tobermorite (Al-tobermorite) shows more lath-like morphology (Mostafa et al., Reference Mostafa, Shaltout, Omar and Abo-El-Enein2009). There are various findings on the effect of sulfate ions, since there are studies that show that there is no considerable effect on the morphology of tobermorite (Sauman, Reference Sauman1972), whereas Mostafa et al. (Reference Mostafa, Shaltout, Omar and Abo-El-Enein2009) observed leafy morphology of sulfate-substituted tobermorite (S-tobermorite) in SEM micrographs.
In many studies, the characterization of tobermorite morphology is principally based on SEM images for both AAC and purely synthesized samples. It should, however, be taken into account that in SEM images, apparent observable single crystals are not necessarily equal to actual single crystals. Observed particle shape and sizes can be polycrystals or clusters that consist of several coherently scattering domains (CSDs), which is the unit that can be detected by XRD analysis. Merlino et al. (Reference Merlino, Bonaccorsi and Armbruster2000) observed individual domains within one tobermorite crystal at a higher structural resolution. In a nano-structural AFM investigation of tobermorite by Yang (Reference Yang2006), a crystal picked from an AAC sample appears to be composed of layers of 1.4 nm tobermorite. Additionally, there are experimental approaches dealing with observed particle sizes by electron microscopy in comparison with domain sizes determined by XRD (Ungár et al., Reference Ungár, Tichy, Gubicza and Hellmig2005; Triloki et al., Reference Triloki, Garg, Rai and Singh2014). In the work of Ungár et al. (Reference Ungár, Tichy, Gubicza and Hellmig2005), it is summarized that CSDs determined by XRD analysis are always smaller or at the most equal to the sizes observed by electron microscopy. It is additionally a key question whether the shapes of CSDs can determine the morphological shapes and in how far this can be observed by SEM analysis.
In this study, both CSDs and morphology of tobermorite in AAC samples are characterized based on XRD data and SEM images. In doing so, the limits of investigation of tobermorite in AAC using solely SEM images are discussed. The lattice parameters and domain morphology of tobermorite are calculated and linked with the influence of aluminum and sulfate ions. For this purpose, a recently published geometric approach to anisotropic peak broadening (Ectors et al., Reference Ectors, Goetz-Neunhoeffer and Neubauer2015) is implemented in the Rietveld refinement (Rietveld, Reference Rietveld1969). Expecting anisotropic shapes in accordance with the orthorhombic crystal system, a triaxial cylinder model is used in this study to approach tobermorite domains. The benefits of using this approach instead of calculating isotropic domain sizes for tobermorite in AAC samples have already been pointed out in an earlier work (Schreiner et al., Reference Schreiner, Jansen, Ectors, Goetz-Neunhoeffer, Neubauer and Volkmann2018).
2. MATERIALS AND METHODS
AAC green cakes were prepared on a laboratory scale using custom-made stirrer and molds. In this way, it was possible to add, replace and omit raw materials of special interest. All of the raw mixes contained quartz flour, lime (CaO), cement (OPC), water (w/s = 0.8), foaming agent (aluminum powder), and at least one more additional raw material at various amounts. The supplementary materials included perlite, metakaoline, diatomite, calcined clay, calcium aluminate cement (CAC), and anhydrite. The chemical composition of these materials is attached as Supplementary file to this paper. More than 20 different formulations were created leading to a wide variety of samples. The resulting Al2O3 contents (calculated from XRF data) in the bulk raw mixtures range from 1 to 5.75 wt.-%. SO3 contents (calculated from XRF data) range from 0.7 to 2.3 wt.-%. The aluminum supplied by the foaming powder is not included here because of the very low amount. The dosage was the same for all samples.
After initial hydration of at least 140 min at 60–70 °C, the green cakes were demolded and autoclaved within the course of an industrial production (190 °C, saturated steam pressure 12 bar). The autoclaved samples were then dried at 60 °C and a representative amount was crushed and ground using a McCrone mill in order to receive appropriate powders for XRD analysis. The suitability of wet McCrone milling of AAC samples was described in a recent study (Schreiner et al., Reference Schreiner, Jansen, Ectors, Goetz-Neunhoeffer, Neubauer and Volkmann2018).
For SEM analysis, crushed but unground samples of 0.5–1 cm were broken with a pair of pliers and fixed to the sample carrier with conductive carbon cement. The rims were covered with a conductive silver paste Silver DAG. The surfaces of the samples were sputtered with a conductive 5 nm Cr layer. A Zeiss Auriga 40 Crossbeam FIB/SEM located at Schlenk Metallic Pigments GmbH was used. Pictures were obtained in secondary electron contrast with a low acceleration voltage of 1 kV in a vacuum of 5 × 10⁻⁶ mbar.
The chemical composition of all used materials was determined (XRF) in order to calculate the overall composition of the raw mix and the mass attenuation coefficient for G-factor quantification (Jansen et al., Reference Jansen, Goetz-Neunhoeffer, Stabler and Neubauer2011). A tube voltage from 20 to 50 kV and current from 0.8 to 2.0 mA were used for different targets for energy-dispersive XRF (Spectro Xepos).
For XRD analysis, the samples were prepared into front loading sample holders. Measurements were performed at a Bruker D8 diffractometer at 23 °C with an angular range from 6 to 80° 2θ (CuKα radiation), a step width of 0.0236° 2θ and a time per step of 0.54 s. A tube voltage of 40 kV and current of 40 mA were set. The diffractometer was equipped with a LynxEye detection system. In order to receive phase quantities, an external quartzite standard was measured along with the investigated samples with equal parameters (G-factor) and Rietveld refinement by use of TOPAS 5.0 (Bruker AXS, Karlsruhe, Germany) was applied. All structures used for Rietveld method, which are listed in Table I, were imported to TOPAS with their atomic displacement parameters (ADPs) or with appropriate equivalent ADPs. Schreiner et al. (Reference Schreiner, Jansen, Ectors, Goetz-Neunhoeffer, Neubauer and Volkmann2018) visualized the triaxial cylinder model used for Rietveld refinement of tobermorite and showed its influence on the fit (Figure 1) using the macro for refinement of anisotropic peak broadening because of domain morphology (Ectors et al., Reference Ectors, Goetz-Neunhoeffer and Neubauer2015).
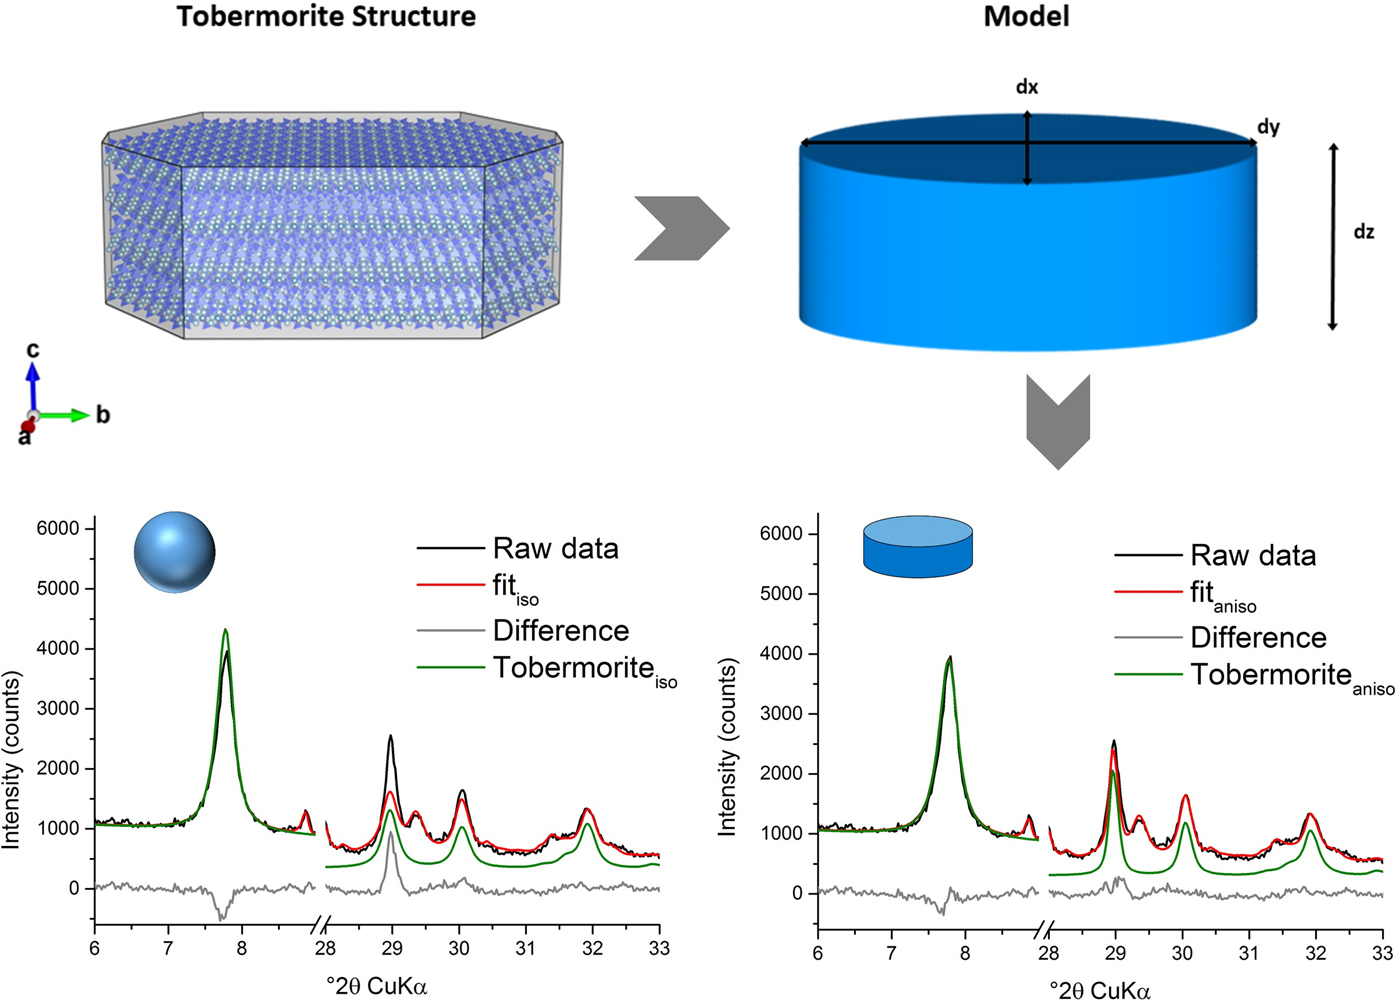
Figure 1. (Color online) Triaxial cylinder model used for approximation of domains of tobermorite in Rietveld refinement and influence on the fit of tobermorite in AAC (Schreiner et al., Reference Schreiner, Jansen, Ectors, Goetz-Neunhoeffer, Neubauer and Volkmann2018).
Table I. Crystal structure data used for Rietveld refinements.
3. RESULTS AND DISCUSSION
3.1 XRD analysis
Lattice parameters and domain morphology of tobermorite were calculated based on Rietveld refinement. Most of the used supplementary materials provide different amounts of Al3+, and for this reason, the respective effects on domain sizes and lattice parameters in most of the samples can be compared as they add up to a consistent range of data points. The overall amount of (SO4)2− in the samples is – to a relevant degree – exclusively driven by the amount of supplementary anhydrite, so that only fewer samples are used to compare the effect of sulfate on domain sizes and lattice parameters.
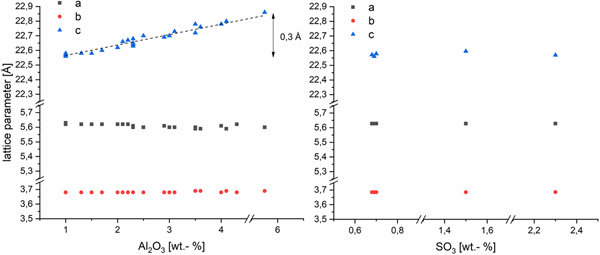
The effects of Al3+ and (SO4)2− in the AAC on the lattice parameters of tobermorite are shown in Figure 2. The a and b parameters are not depending on the amount of Al2O3 in the dry mix. In accordance with the literature (Hara and Inoue, Reference Hara and Inoue1980; Jackson et al., Reference Jackson, Chae, Mulcahy, Meral, Taylor, Li, Emwas, Moon, Yoon, Vola, Wenk and Monteiro2012; Biagioni et al., Reference Biagioni, Bonaccorsi, Lezzerini and Merlino2016), c parameter of our samples increases linearly with the supplied amount of Al2O3. In this study, a gain of 0.3 Å is triggered by increasing the Al2O3 content (referred to the dry mix, also hereafter) from 1 to 5.75 wt.-%. Whereas for changes in sulfate content, no impact on any of the lattice parameters can be observed within the range of 0.7–2.3 wt.-% SO3 (referred to the dry mix, also hereafter).
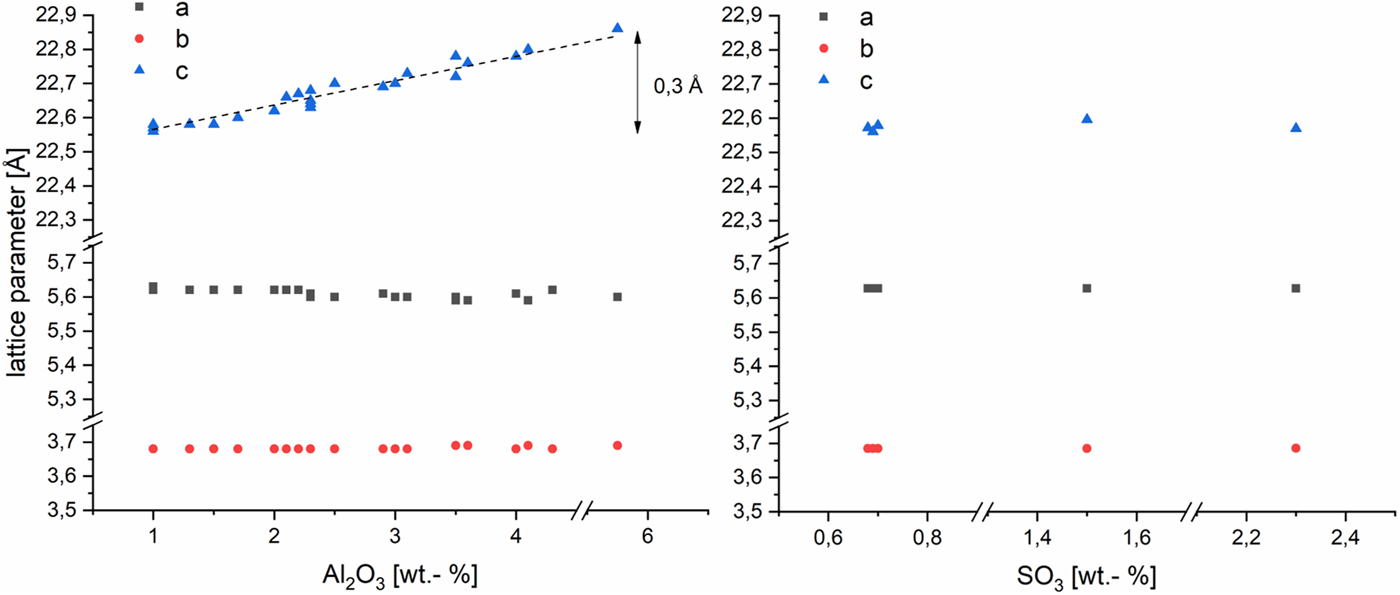
Figure 2. (Color online) Lattice parameters of tobermorite in samples with varying Al2O3 (left) and SO3 (right) contents in AAC. SD~0.005 Å.
The main focus of XRD analysis in this work is the refinement of anisotropic peak broadening of tobermorite associated with substitution by Al3+ and (SO4)2−. By use of a triaxial cylinder model (Figure 1), domain sizes in a (rx), b (ry), and c (rz) direction (r = radii of orthogonal shape) are calculated for tobermorite in each sample, as explained in a recent work (Schreiner et al., Reference Schreiner, Jansen, Ectors, Goetz-Neunhoeffer, Neubauer and Volkmann2018).
In Figure 3, the calculated cylinder diameter (rx + ry) of tobermorite domains in proportion to the calculated cylinder heights (2rz) are plotted vs. the amount of Al2O3. The mixes contain at least 1 wt.-% Al2O3, as a particular minimum amount of aluminate-bearing OPC was used in each dry mix. For tobermorite in samples containing a low amount of Al2O3 rather flat and tabular domains are calculated, as visualized by the thinner and more expanded cylinder. Up to an amount of 3.5 wt.-% of Al2O3 increasingly thicker and bulkier domains are formed, indicated by the taller cylinder. Within this range, the influence of Al3+ on the domain morphology of tobermorite was found to be nearly linear and exclusive. In the samples that contain more than 3.5 wt.-% Al2O3 this linear trend can no longer be observed. Keeping in mind that the used supplementary materials not only differ in terms of the Al2O3 content, it can be assumed that there are further ions influencing tobermorite domain morphology. In addition, it appears that the limit of substitution by Al3+ in tobermorite structure is reached at more than 3.5 wt.-% Al2O3, as formation of katoite is observed primarily in these samples. The deviations of tobermorite domain morphology from 3.5 to 5.75 wt.-% can be explained either by the influence of different ions or by the possibility that as soon as katoite is present, the incorporation of Al3+ in tobermorite structure is no longer proportional. Even though barely detected by XRD, we could observe katoite outstandingly well in SEM micrographs. This finding matches the results in the work of Skawinska et al. (Reference Skawinska, Owsiak, Baran and Hernik2017), in which more formation of katoite was observed in AAC samples containing more Al2O3 by clay mineral (halloysite) addition. However, looking at the influence of Al3+ on the c unit-cell parameter, a limit of substitution is not observed within the examined range. Eventually, some supplementary materials may contribute to a rise in overall Al2O3 content, but there are minerals that dissolve only poorly during hydrothermal curing – such as microcline (feldspar). In this case, there will be almost no impact on the domain morphology of tobermorite, as no Al3+ is provided for reaction.
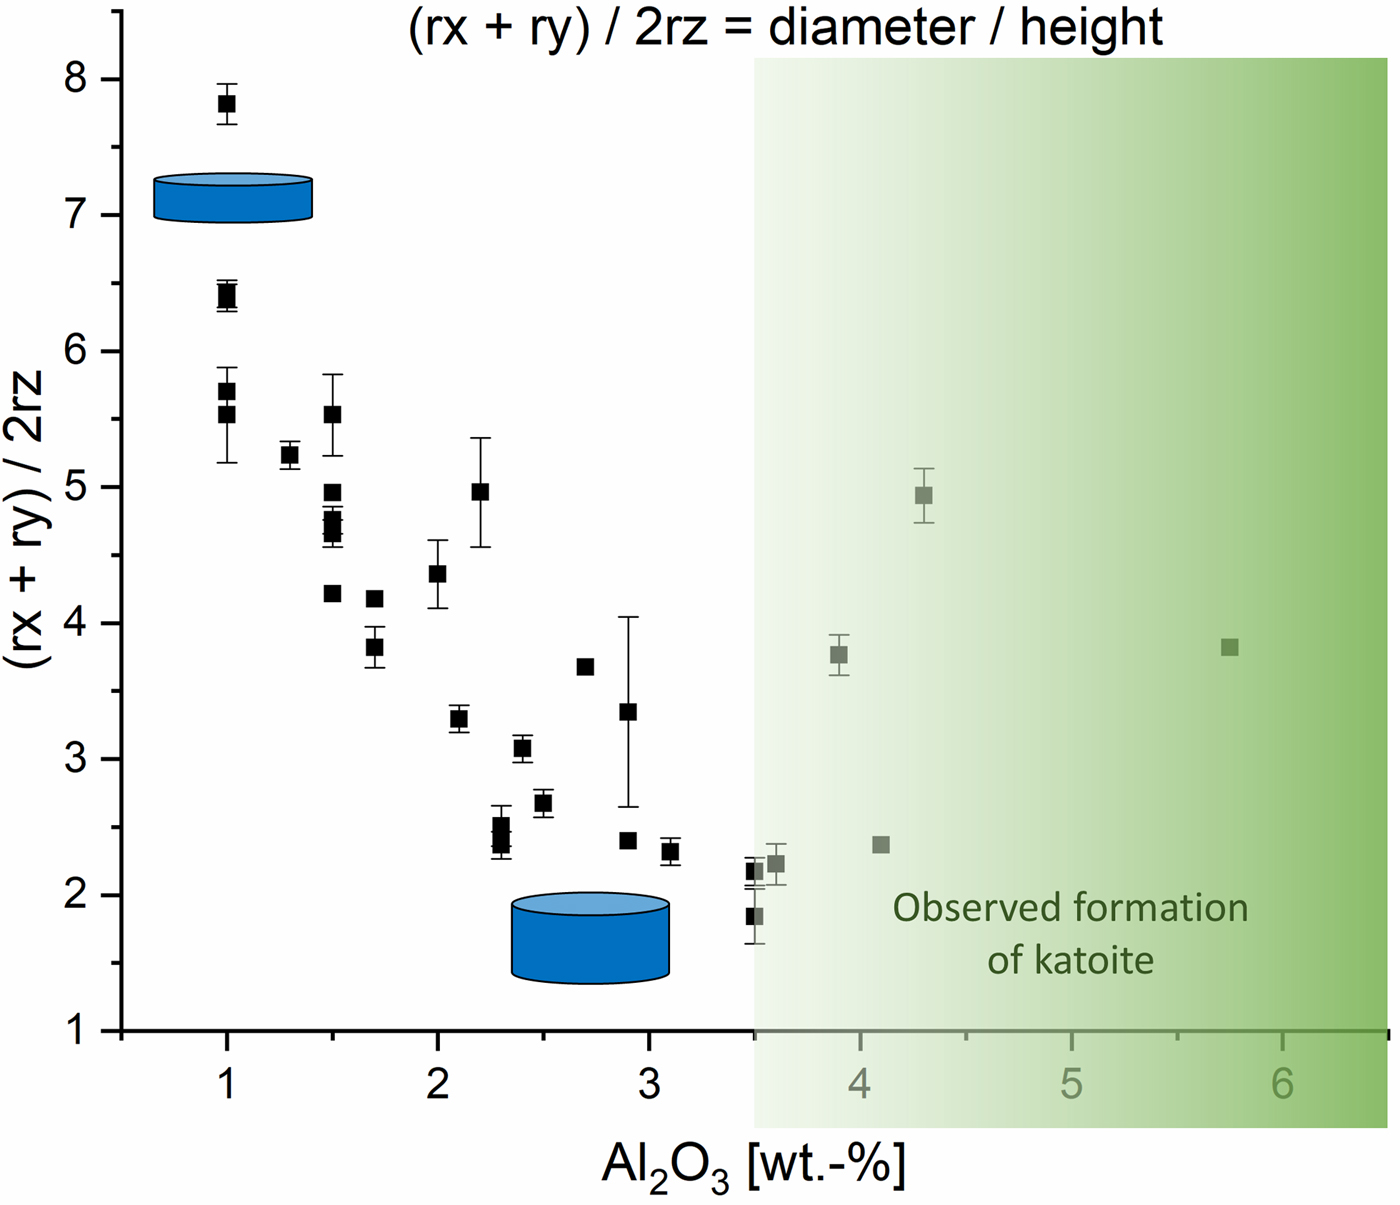
Figure 3. (Color online) Influence of Al2O3 content on the domain morphology of tobermorite: ratio of rx + ry to 2rz.
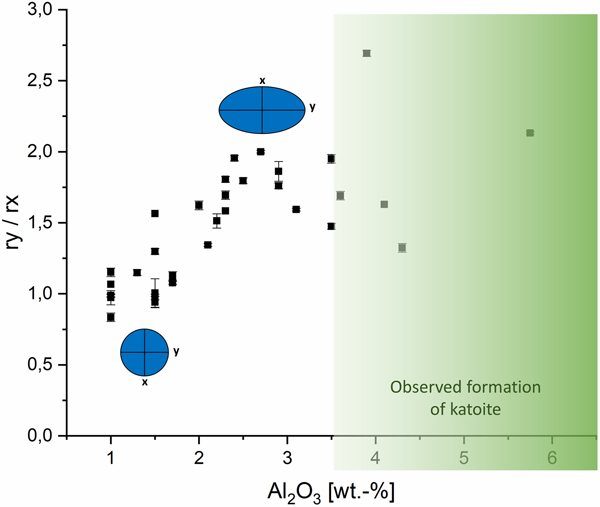
The effect of Al3+ on tobermorite domains can not only be seen when comparing mean cylinder diameter with height. In Figure 4, the ratio of ry to rx is plotted. The ellipses represent the projection of the flat face of the cylinder perpendicular to z direction. In the samples with low Al2O3 content, ry is more or less equal to rx. In this case, the domains resemble a biaxial cylinder. With rising Al2O3 content, the flat face shows increasingly elliptic shape and a distinctly triaxial cylinder is calculated. At more than 3.5 wt.-% Al2O3, the trend ends in a similar manner to the trend in Figure 3 for equivalent reasons. In summary, we can calculate that substitution by Al3+ in tobermorite structure leads to mean aspect ratios characterized by taller (relatively greater rz) and simultaneously elliptic (ry > rx) cylinders. Tobermorite with lower Al3+ incorporation shows flat (relatively smaller rz) and nearly biaxial (ry ~ rx) domain morphology.

Figure 4. (Color online) Effect of Al2O3 content on the domain morphology of tobermorite: ratio of ry to rx.
To show the effect of sulfate ions in AAC on the domain morphology of tobermorite, Figure 5 includes both the impact on the ratio of cylinder diameter (rx + ry) to height (2rz) and the shape of the projected flat face. An amount of 0.7 wt.-% SO3 is the minimum of the examined range, as OPC containing sulfate carriers were used in each sample. It can be seen that there is no considerable effect caused by variance of the SO3 content. Deviations in the diameter-to-height ratio appear to be caused mainly by different components of the supplementary materials. Looking at the ratio of ry to rx, only biaxial cylinders are calculated. The observation that there is no clear effect of sulfate ions on domain morphology of tobermorite is supported by the fact that the amount of anhydrite detected by quantitative XRD analysis (QXRD) matches the expected maximum amount of anhydrite calculated from the amount of SO3 in the dry mixes (Figure 6). It appears that no or very low sulfate is available for substitution in tobermorite structure considering the quantities of anhydrite determined by QXRD and the error of G-factor quantification. Consequently, based on these data, there is no evidence of sulfate incorporation into tobermorite structure in AAC.
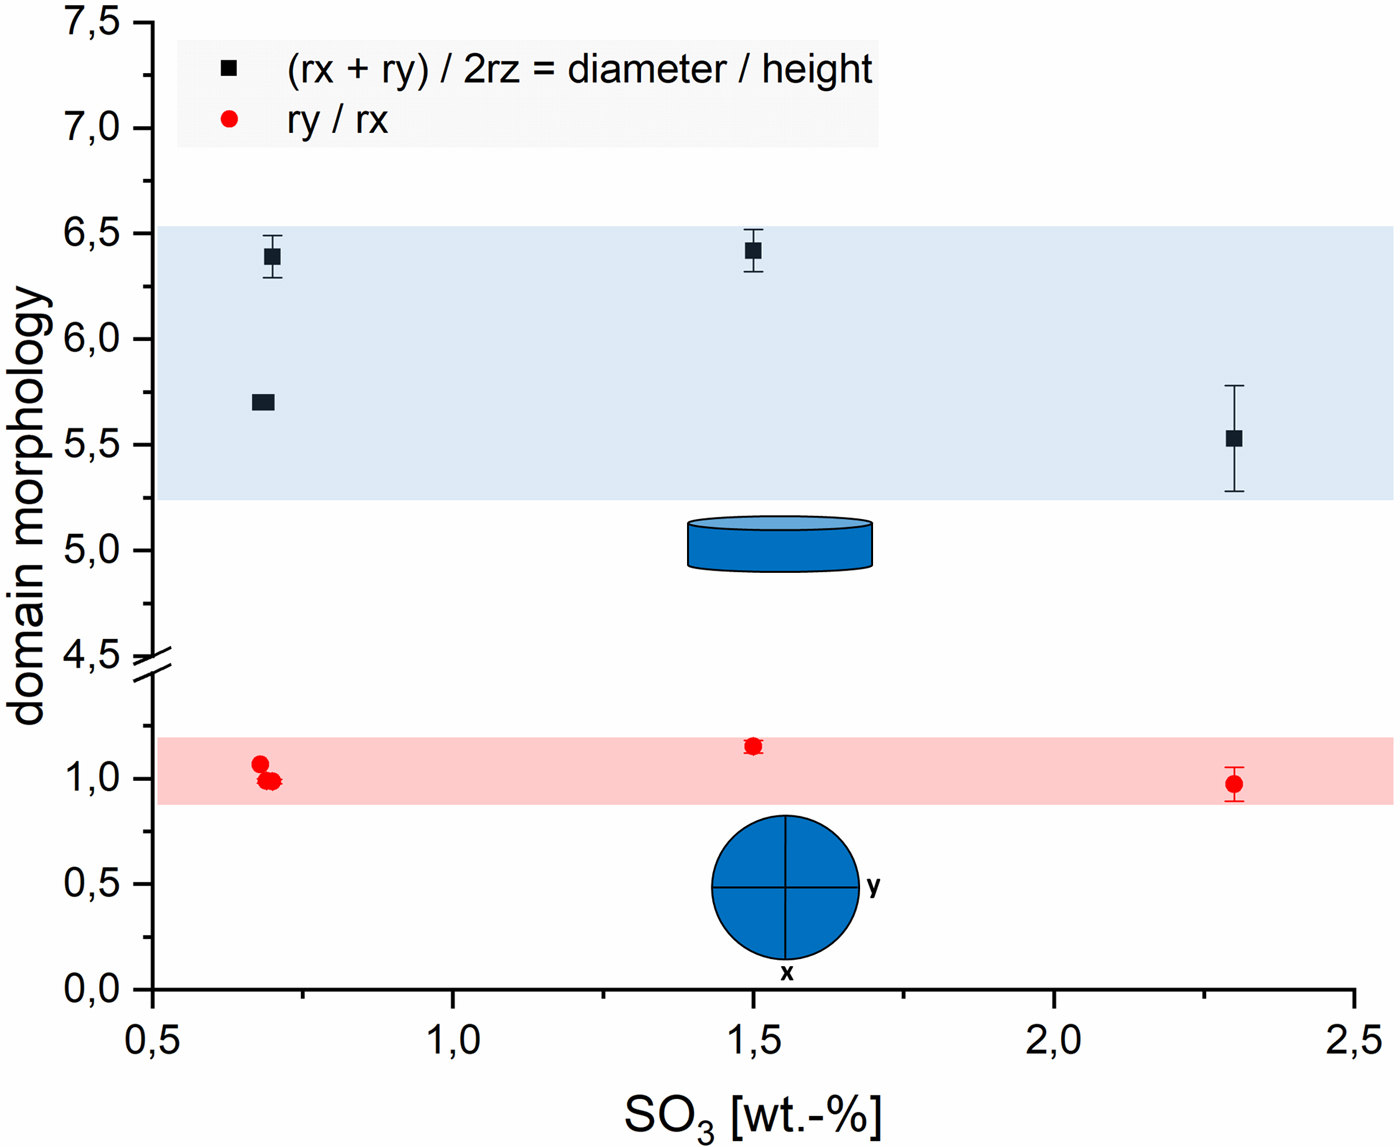
Figure 5. (Color online) Influence of SO3 content on the domain morphology of tobermorite: ratio of rx + ry to 2rz (black) and ratio of ry to rx (red).
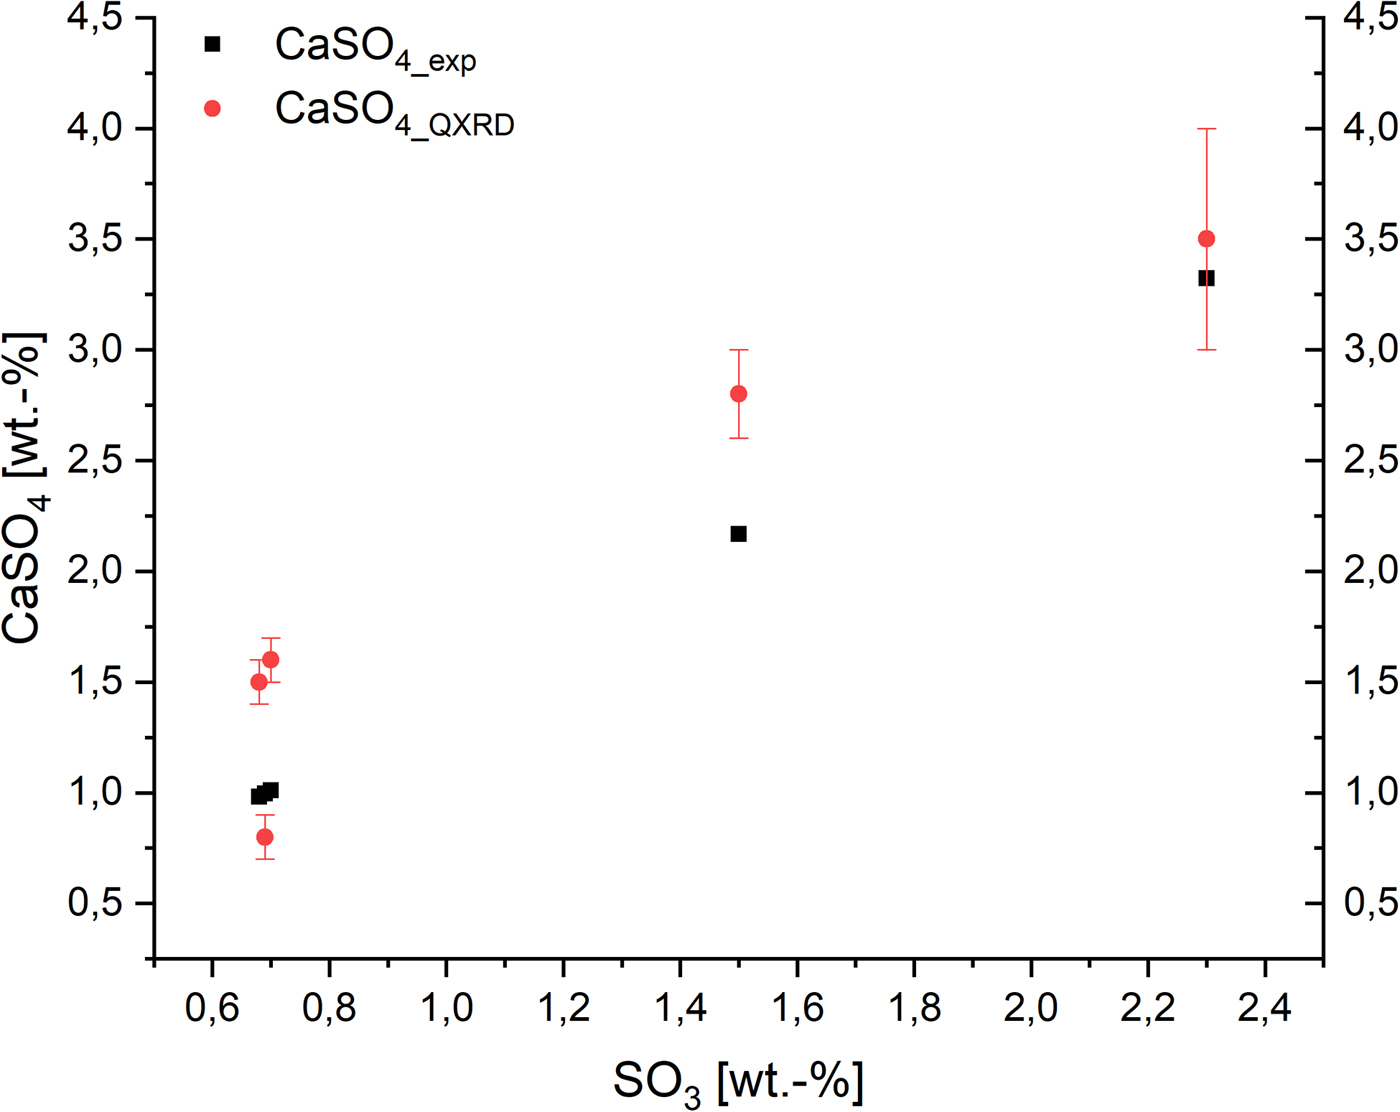
Figure 6. (Color online) Expected maximum amount of anhydrite (black) based on SO3 content in the dry mixes compared with the amount determined by QXRD (red).
3.2 SEM analysis
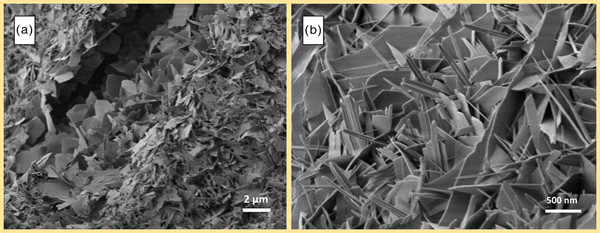
For SEM analysis, primarily samples with different Al2O3 contents were investigated. In order to examine the morphology of tobermorite, sections with supposedly crystalline tobermorite were focused on. In AAC, tobermorite growth without nearby restriction is only found in the pores. In Figure 7, the proportions of tobermorite grown in a visible pore compared with tobermorite grown in the dense skeletal material (lower and right part of the image) can be seen. A distinct description of tobermorite morphology in AAC can only be done by focusing on the crystals found in pores, because in the dense matrix it is not possible to reliably trace and identify three-dimensional shapes of tobermorite. However, the major amount of tobermorite by weight is certainly located in these dense sections. Moreover, it is well recognizable that there is a vast range of particle sizes of tobermorite, so that estimating average sizes is not reasonable.
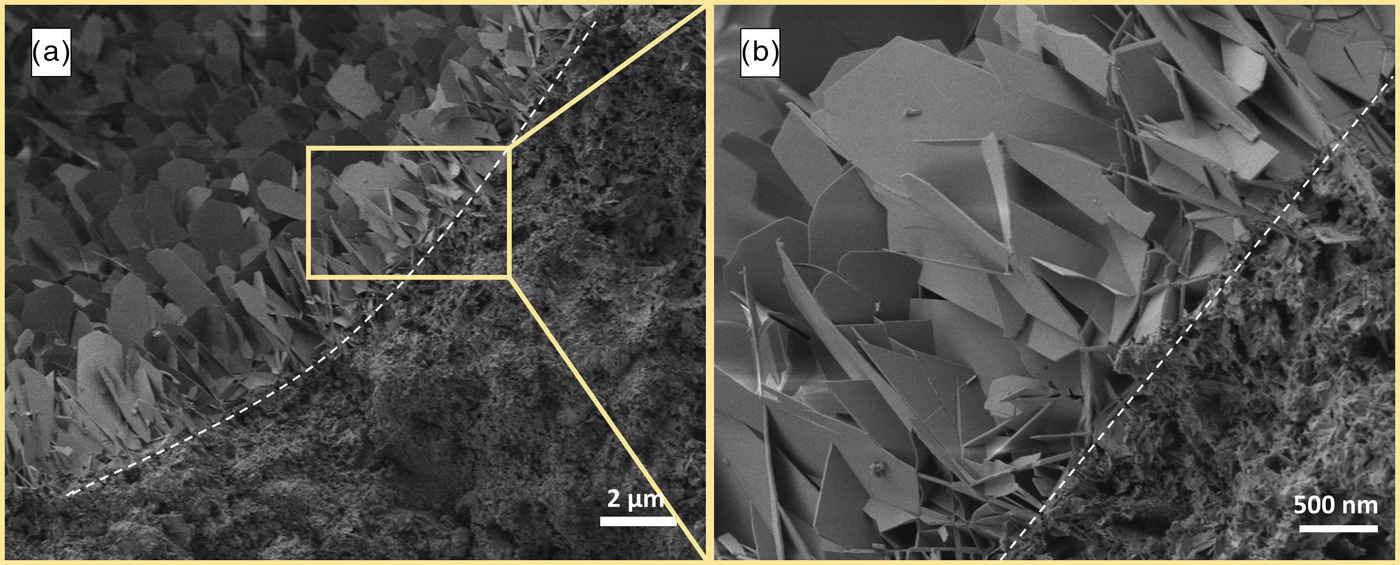
Figure 7. (Color online) Comparison of particle sizes of tobermorite grown in a pore and in the solid skeleton in AAC sample (a) with detailed view (b).
In Figure 8, two spots of a sample with low Al2O3 content (~1 wt.-%) are displayed. With regard to observations by SEM from other authors, plate-like morphology of tobermorite should be observed. In a smaller pore in Figure 8(a), this type of morphology is indeed found, as mostly plate-like tobermorite is present. Figure 8(b) shows tobermorite grown in a different pore. Even though this section originates from the same sample, clearly needle-like morphology of tobermorite can be seen besides fewer platy crystals. A similar observation can be made in Figure 9. The three micrographs originate from a sample containing considerably more Al2O3 (~4 wt.-%). As explained in Section 3.1, a distinctive formation of katoite [Figure 9(a)] occurs, and as expected, lath-like morphology of tobermorite can be found [Figure 9(b)]. However, several investigated pores clearly exemplify additional plate-like morphology [Figure 9(c)].
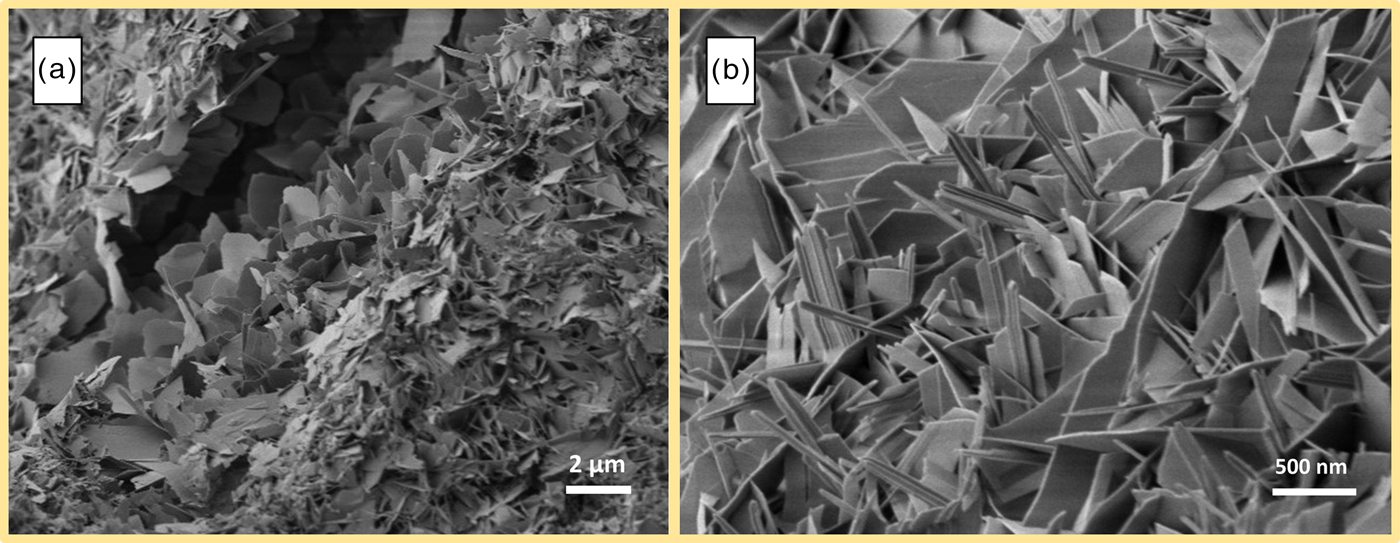
Figure 8. (Color online) Plate-like tobermorite in a small pore (a) and needle-like morphology in a greater pore (b) in AAC sample containing 1 wt.-% Al2O3.
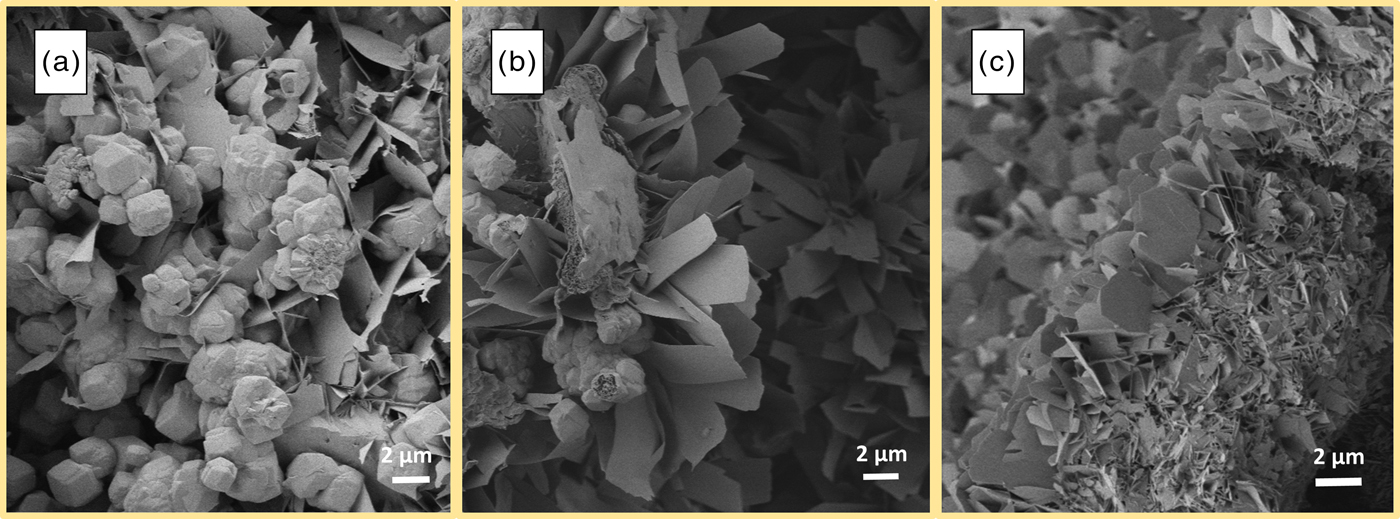
Figure 9. (Color online) Katoite (a), lath-like morphology (b), and plate-like morphology (c) of tobermorite in AAC sample containing nearly 4 wt.-% Al2O3.
All findings considered, it can be concluded that morphology characterization of tobermorite in AAC based on SEM micrographs is difficult because of the quite heterogeneous appearances of tobermorite in a single sample. We were not successful to observe a clear effect of aluminum and sulfate ions on morphology based on SEM analysis. In addition, most of the areas in the samples are showing that tobermorite is densely packed in the solid skeleton and aggregated with different crystalline and amorphous phases. However, compared with XRD analysis, katoite can be observed very well in SEM micrographs.
4. SUMMARY AND DISCUSSION
Based on the presented results, some conclusions can be drawn regarding the effect of aluminum and sulfate ions on tobermorite lattice parameter and domain morphology and regarding the suitability of the applied methods in the context of this question.
XRD analysis and Rietveld refinement using the implemented approach to anisotropic peak broadening account for most of the clear results in this study. In agreement with the literature (Hara and Inoue, Reference Hara and Inoue1980; Jackson et al., Reference Jackson, Chae, Mulcahy, Meral, Taylor, Li, Emwas, Moon, Yoon, Vola, Wenk and Monteiro2012; Biagioni et al., Reference Biagioni, Bonaccorsi, Lezzerini and Merlino2016), substitution by Al3+ in tobermorite structure leads to an increase of the c unit-cell parameter, whereas no effect of (SO4)2− can be observed. We cannot prove whether sulfate ions are even incorporated into tobermorite structure in AAC at all and whether a limit of substitution for aluminum ions is reached in this study. The amount of anhydrite detected by QXRD suggests that the entire available sulfate is transformed into anhydrite, so that no significant amount of sulfate ions is left to be incorporated into tobermorite structure. In agreement to this result, no dependency of sulfate ions is observed for the domain morphology of tobermorite. Al-rich tobermorite shows more triaxial (ry > rx) shaped domains than tobermorite with low substitution of Si4+ by Al3+, which is characterized by flat and nearly biaxial (ry ~ rx) domain morphology. A limit of substitution cannot be observed regarding the lattice parameters, as c increases linearly with the Al2O3 content within the complete examined range. Regarding the domain morphology, a linear influence by Al3+ can only be observed from 1–3.5 wt.-% Al2O3. At more than 3.5 wt.-% Al2O3, there is evidence for formation of katoite. It should as well be kept in mind that some aluminum-rich minerals such as microcline barely dissolve during autoclaving. The calculated domain morphology of Al-tobermorite complies with the lath-like morphology observed by SEM analysis in the literature, which indicates that domain morphology can indeed determine the bulk morphology. Investigation of multiple additional examples would be required in order to clarify this suggestion.
Crystals of cubic katoite were clearly observed in SEM micrographs, though structural analysis of tobermorite was barely feasible by SEM analysis. In the first place, the majority of data collected by XRD measurements is based on the dense matrix in AAC, which can hardly be analyzed by SEM. XRD analysis is leading to very reliable averaged data from the bulk material, whereas SEM data cover only a very small area in the sample and cannot be assumed to show the true average. Above all, estimating general crystal sizes of tobermorite by SEM is hardly practicable because of the broad range of the observed sizes. Further on, because of the diversity of visible morphologies of tobermorite even in pores, a comparison to domain sizes and domain morphology calculated from XRD patterns cannot be drawn properly. We conclude that XRD analysis appears to be more suitable for structural analysis of average tobermorite in AAC because all the difficulties regarding SEM analysis in this context do not apply for XRD analysis. A distinct and representative value for domain sizes of tobermorite is attained using the implemented approach to anisotropic peak broadening. Even though frequently performed in some of the cited literature, in this work, we explained in how far SEM is no suitable method in order to gain reliable and statistical information on tobermorite in AAC.
In order to examine a morphologically more homogenous material, non-aerated and purely synthesized tobermorite on a laboratory scale could presumably be more suitable for SEM analysis. Consequently, prospective studies covering the investigation of purely synthesized tobermorite depending on the chemical composition of raw materials would be of great scientific interest.
SUPPLEMENTARY MATERIAL
The supplementary material for this article can be found at https://doi.org/10.1017/S0885715619000149.
ACKNOWLEDGEMENT
The authors emphasize that this work would not have been possible without the support and provisioning of material and laboratory devices from Rodgauer Baustoffwerke GmbH & Co. KG. The authors further thank Schlenk Metallic Pigments GmbH for granting SEM analysis in their laboratory.