

When Hurricane Sandy struck the US eastern seaboard in October 2012, a network of sea-level stations transmitted in real-time measurements of the storm surge to scientists and authorities. Unfortunately, the storm damaged several stations and, as reported by The New York Times (Gillis Reference Gillis2014), a scientist confirmed that a “station got washed off the face of the earth,” thus interrupting the flow of measurements when they were needed most. These stations and their tide gauges are crucial because they measure the strength of storms where they are most deadly and destructive—on the coast. The United States has 227 sea-level stations and has further invested in hurricane-hardened tide gauges along its coast. While Mexico has 27 stations Malaysia has only seven. Other countries such as Cambodia have not even deployed a single sea-level station. What explains this variation in protection against ocean-originated hazards? Clearly, factors such as previous natural disasters, the length of a coastline, coastal population, exposure to tectonic plates, importance of commercial navigation, and engagement in international cooperation, as well as wealth, might determine cross-national variance in the number of sea-level stations. This paper shows that even when these variables are taken into consideration, political institutions play a very important, yet nuanced role, in the protection of individuals against ocean-originated disasters.
It is well known that democratic governments provide more protection to their citizens than non-democratic regimes (e.g., Kahn Reference Kahn2005; World Bank 2010). In line with this research, and using the number of sea-level stations as a lower bound for protection against ocean-originated hazards, the paper shows that leaders in large coalition systems provide more protection than leaders in small coalition systems. Yet, the article also argues that autocrats provide large-scale protection against natural hazards if members of their winning coalition are located in a vulnerable area. The empirical evidence presented by this paper indicates that if the national capital is close to the coast—thus exposing members of the ruling coalition to ocean-originated hazards—autocrats also deploy sea-level stations.
Sea-level stations are the first and most essential line of defense against ocean-originated hazards. They are located strategically along coasts and rely on tide gauges to measure changes to sea levels, including those caused by tsunamis, coastal floods, and hurricanes. As mentioned before, these stations measure the strength of these disasters on the coast, which is where they kill the largest number of people and cause the greatest amount of material losses. As sea levels rise and large sectors of the population continue to settle in coastal areas, these simple, relatively inexpensive, and reliable stations are the main instrument to protect individuals and businesses from ocean-originated disasters. In this light, this article argues that a cross-national analysis of sea-level stations is also an exploration of the provision of disaster protection.
The paper is organized as follows. The paper first presents the logic of disaster protection as explained by leaders’ incentives to stay in office. The article then discusses how the location of political supporters might force leaders across political systems to provide large-scale protection against natural hazards. The third section discusses the function of sea-level stations in saving lives. The fourth section of the paper presents the data used for estimation as well as empirical results from count models of the number of sea-level stations. The paper closes with a discussion on future work.
THE LOGIC OF PROTECTION AGAINST NATURAL DISASTERS
A large body of research on the political economy of natural hazards has found that countries with democratic institutions, low-income inequality, and good governance practices, experience fewer disaster-related casualties (e.g., Sen Reference Sen1983; Sen Reference Sen1991; Kahn Reference Kahn2005; Toya and Skidmore Reference Toya and Skidmore2007; Cavallo and Noy Reference Cavallo and Noy2009; World Bank 2010). Indeed, countries can mitigate the effects of natural hazards by enforcing building codes (Anbarci, Escaleras and Register Reference Anbarci, Escaleras and Register2005), providing adequate infrastructure (Stromberg Reference Stromberg2007), reducing the effect of corruption on construction (Escaleras, Anbarci and Register Reference Escaleras and Register2007; Keefer, Neumayer and Plümper Reference Keefer, Neumayer and Plümper2011), and providing public goods associated with disaster prevention and relief (Quiroz Flores and Smith Reference Quiroz Flores and Smith2013).
Democratic politicians provide adequate disaster relief because they can derive long-lasting electoral credit from their performance during emergencies (Bechtel and Hainmueller Reference Bechtel and Hainmueller2011) and improve their chances of re-election (e.g., Garrett and Sobel Reference Garrett and Sobel2003; Sylves and Buzas Reference Sylves and Buzas2007; Reeves Reference Reeves2011; Chen Reference Chen2013). Conversely, democrats are punished for poor responses to disasters (Achen and Bartels Reference Achen and Bartels2004; Malhotra and Kuo Reference Malhotra and Kuo2009; Healy and Malhotra Reference Healy and Malhotra2009; Healy and Malhotra Reference Healy and Malhotra2010; Gasper and Reeves Reference Gasper and Reeves2011). In autocratic countries, however, deadly natural disasters can wipe out the political opposition and consequently reduce protest and internal challenges (Brass Reference Brass1986; Keller Reference Keller1992; Albala-Bertrand Reference Albala-Bertrand1993; Quiroz Flores and Smith Reference Quiroz Flores and Smith2013). In other words, depending on where disasters strike and whom they kill, they can delay or hasten leaders’ deposition from office.
In this context, Quiroz Flores and Smith (Reference Quiroz Flores and Smith2013) use Selectorate Theory (Bueno de Mesquita et al. Reference Bueno de Mesquita and Smith2003; Smith Reference Smith2008; Bueno de Mesquita and Smith Reference Bueno de Mesquita, Smith, Siverson and Morrow2009) to theoretically and empirically explore the effects of natural disasters on leader survival. In their account, leaders maximize their tenure in office by providing a mix of public and private goods that depends on political institutions, particularly the winning coalition (W) and the selectorate (S). According to Quiroz Flores and Smith (Reference Quiroz Flores and Smith2013): “The winning coalition is the set of essential supporters that the leader relies on to maintain power. The selectorate is the set of people from which a leader forms her winning coalition. The sizes of winning coalitions and selectorates vary greatly and shape political incentives.”
In systems with large winning coalitions such as the United States, leaders maximize their tenure in office by providing a larger mix of public goods. In the context of disaster prevention, a public good can take the shape of an early warning system to alert the population of incoming tsunamis. In Hawaii, for instance, a destructive tsunami will activate the State Emergency Alert System. Part of the system consists of sirens scattered across the islands that produce a loud and steady 3-minute siren tone prompting citizens to move to higher ground. Escaleras and Register (Reference Escaleras, Anbarci and Register2008) find that tsunami warning systems significantly reduce the number of casualties and suggest that if such mechanism had existed in the Indian Ocean in 2004, it would have saved close to 14,000 lives.
In systems with small winning coalitions, such as Burma, leaders maximize their tenure in office by providing a larger mix of private goods to a small number of supporters. In this political context, instead of spending large amounts of resources in disaster prevention that could benefit large sections of the population, leaders in small coalition systems can compensate their political supporters for any losses caused by natural disasters (Brass Reference Brass1986; Albala-Bertrand Reference Albala-Bertrand1993; Pelling Reference Pelling1999; Mustafa Reference Mustafa2003). In fact, autocrats might benefit politically from the occurrence of deadly natural disasters because, as suggested by Quiroz Flores and Smith (Reference Quiroz Flores and Smith2013), “Dead people cannot revolt.”
In line with this logic, Quiroz Flores and Smith (Reference Quiroz Flores and Smith2013) find that disaster-related casualties in large coalition systems increase the likelihood of leader replacement, while they reduce it in small coalition systems. Hence, in order to minimize the likelihood of deposition, democrats have strong incentives to provide protection against disasters, which leads to the following prediction.
Hypothesis 1: All else equal, leaders in large coalition systems provide more protection against natural disasters than their counterparts in small coalition systems.
The Location of the Winning Coalition
As argued above, democrats have incentives to provide disaster protection in the form of public goods. In contrast, autocrats provide protection in the form of private goods (Quiroz Flores and Smith Reference Quiroz Flores and Smith2013). For example, in the late 1990s, the Burmese Junta began the process of moving the capital of the country from Rangoon to Naypyidaw, an area sheltered by mountains and away from vulnerable regions in the south such as the Irrawaddy Delta, which was widely affected by Cyclone Nargis in 2008. The cyclone killed more than 138,000 individuals, but not the Junta leaders and their families who were well protected in the new capital.
Evidently, not all leaders can afford to relocate a capital city and yet they must provide protection to members of their winning coalition. This paper thus argues that autocrats, just like democrats, provide large-scale disaster protection if vulnerable members of the winning coalition cannot be separated from the general public.
In this densely inhabited planet it is difficult to find many countries where members of the winning coalition and the general population live in completely separate areas. Indeed, some ruling elites live in exclusive neighborhoods, although this may depend on income inequality or the particulars of an authoritarian regime (Geddes, Wright and Frantz Reference Geddes, Wright and Frantz2014). Unfortunately, exclusive neighborhoods, slums, and city centers are equally vulnerable to disasters that are large in a planetary scale. For instance, the Global Historical Tsunami Database of the National Geophysical Data Center/World Data Service (2013) has records of dozens of tsunamis with a horizontal inundation of more than 4 km and up to 8 km.
It could also be argued that members of the winning coalition are not concentrated in a single city. Indeed, some members of the ruling elite live in a capital city, such as Brasilia, while others live in major commercial cities, such as Sao Paulo or Mumbai. In fact, some cities such as Belize City, New York, or Istanbul, are economically more important than the official capital. Yet, political power is generally more concentrated in country’s capital than in other cities. This is often the case in highly centralized countries such as Mexico City and France, and in some particular types of authoritarian regimes such as those ruled by military forces (Geddes, Wright and Frantz Reference Geddes, Wright and Frantz2014). This logic leads to the following prediction.
Hypothesis 2: All else equal, leaders across all political systems will provide protection against natural disasters if the country’s capital is in a vulnerable area.
For this hypothesis to work, the location of a capital needs to be exogenous to the occurrence of disasters.Footnote 1 As mentioned before, the location of some capitals has been carefully chosen. However, the location of the majority of these new capital cities—Belmopan, Brasilia, or even Ankara—was related to internal control and protection from foreign invasions and not necessarily to the occurrence of natural hazards. The endogenous location of a capital city due to disaster propensity is more an exception than a rule. In Latin America, for instance, capital cities are located in the ancient centers of indigenous civilization, such as Mexico City.Footnote 2 The same logic applies to many capital cities in former colonies in Africa or South East Asia. Furthermore, the location of several cities throughout Europe and Asia has been determined by the politics of Empire or the importance of trade and not by potential natural hazards (McGranahan, Balk and Anderson Reference McGranahan, Balk and Anderson2007). Altogether, it is safe to assume that the location of national capitals is exogenous to the occurrence of natural disasters.
THE MEASUREMENT OF PROTECTION: OCEAN-ORIGINATED DISASTERS AND OTHER DETERMINANTS OF THE NUMBER OF SEA-LEVEL STATIONS
Up to this point, the paper has been vague in the use of the term “disaster protection.” The type of disaster protection implemented by countries depends on the origin and frequency of natural hazards. Recent literature has placed an emphasis on disaster frequency because countries with high disaster propensity experience fewer disaster-related casualties and milder negative economic effects (Keefer, Neumayer and Plümper Reference Keefer, Neumayer and Plümper2011; Neumayer, Plümper and Barthel Reference Neumayer, Plümper and Barthel2014). Yet, a discussion on the origin of disasters has been slightly neglected by the political science literature.
This paper focuses on natural hazards that originate in oceans and seas—such as tropical and extra-tropical storms, coastal floods, and tsunamis, among others—for two main reasons. First, they are quite frequent; storms account for 17 percent of all worldwide natural disasters between 1900 and 2008.Footnote 3 Tsunamis are not as frequent as storms but they can be very deadly, as demonstrated by the 2004 Indian Ocean tsunami that killed more than 230,000 people. Second, because as sea levels rise and large sectors of the population continue to settle in coastal areas, countries have become increasingly vulnerable to ocean-originated hazards.
In the context of ocean-originated hazards, the goal of current technology for disaster prevention is to determine in real-time whether and to what extent sea level, both on the open ocean and along shores, has been altered beyond its normal systematic changes. Observed sea levels are a function of a mean sea level, tides, and disturbances (UNESCO 1985). These disturbances come in two types. The first type is made of meteorological residuals often caused by tropical and extra-tropical storms. The second type of disturbances consists of very extreme alterations to the sea level, such as those produced by a tsunami.
Storms kill very few people in the open ocean and ships barely notice tsunamis away from the coast. Indeed, storms and tsunamis are deadly and destructive mostly on the shore and it is precisely for this reason that the large majority of sea-level stations are located on the coast.Footnote 4 The stations are often evenly distributed along countries’ shores for several reasons. First, the stations need to be located close to populated areas if they are to meet their coastal protection goals. For example, 163.8 million Americans were living in coastal watershed counties in 2010 (National Oceanic and Atmospheric Administration (NOAA) 2013); this is 52 percent of the total US population.
Second, stations need to be positioned in different places because the bathymetry near continental shelves and the topography of coasts are not the same along countries’ long shorelines. Third, a large number of independent stations reduces the probability of not having access to real-time measurements of changes to the sea level. Fourth, multiple stations can produce better forecasts necessary for evacuation purposes. For instance, if an earthquake triggers a tsunami off the southern coast of Chile and begins to propagate on the Pacific Ocean, sea-level stations along the Chilean coastline will provide information about the magnitude of the wave. This information, if relayed appropriately, can be used for evacuation purposes along the northern coast of Chile.
Moreover, sea-level stations also play a role in areas that are country specific. For example, the sea-level station at the UK’s Newlyn Tidal Observatory, in the southwest of Britain, provides the national reference from which all heights above mean sea level are based on.Footnote 5
The factors mentioned above, including country-specific coastal populations, local bathymetry and topography, the need for national references and standards, as well as reliability and independence, suggest that countries have strong incentives to invest on their own network of stations. Indeed, coastal hazards can be so specific that free riding on the networks of others can have deadly consequences.
This does not prevent countries from exchanging information in particular circumstances. For instance, as a tsunami propagates from Chile, sea-level stations in Mexico (10 hours after the earthquake) and New Zealand (12 hours after the earthquake) will record changes to the sea level and contribute to the forecasting of the wave that will eventually hit Hawaii 15 hours after an earthquake. Since 2001, Hawaii has experienced tsunami evacuations in 2010, 2011, and 2012. The tsunamis originated in Chile, Japan, and Canada, respectively. Sea-level stations along the coasts of countries in the Pacific Ocean, as well as open ocean buoys, played a crucial role in the decision to evacuate Hawaii in these occasions.
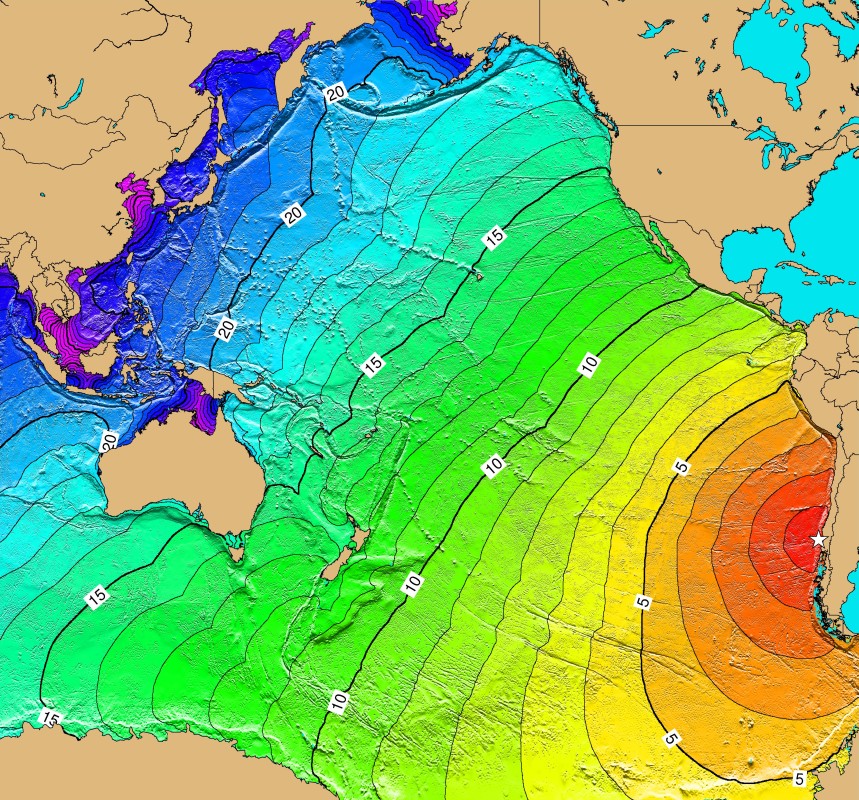
This type of propagation is illustrated in Figure 1 for the Chilean earthquake of May 22, 1960. This was the most powerful earthquake ever recorded by instruments and it generated a tsunami that reached Hawaii and Japan.
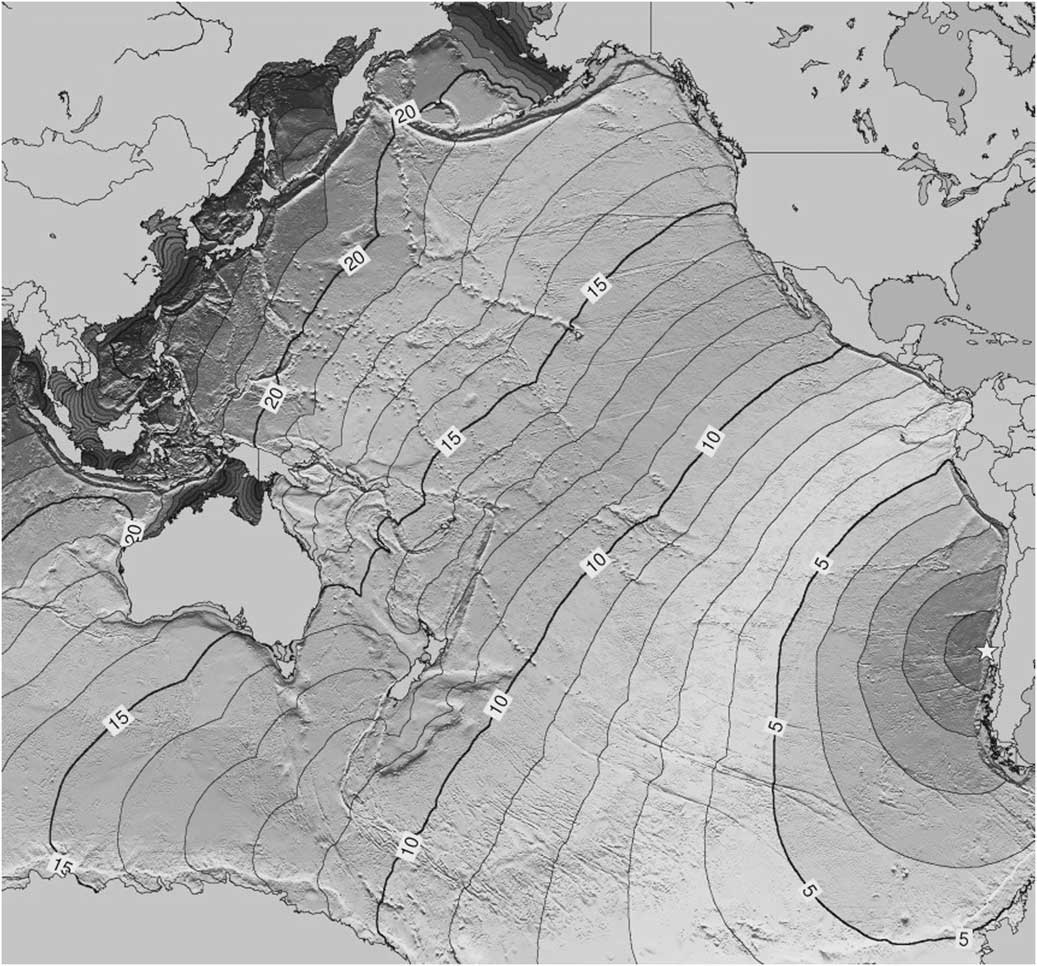
Fig. 1 Propagation in hours of Chilean tsunami of May 22, 1960Note: The map of the propagation is publicly available at http://www.ngdc.noaa.gov/hazard/icons/1960_0522.jpg
In this context, countries have incentives to exchange sea-level information, particularly in oceans where countries are subject to the same disaster, such as the Pacific or the Indian Oceans. For instance, 147 countries exchange sea-level measurements under the auspices of the Intergovernmental Oceanographic Commission. Yet, the technology of a tide gauge is so basic and so well known that countries do not really need international assistance to deploy them even when they may benefit several countries.
Stations are also crucial for countries with dynamic ocean economies with assets closely connected to commercial navigation. The US ocean economy in 2010 was valued at US $117 billion dollars/year (NOAA 2010). In all, 10 percent of this amount is lost to natural disasters (Regnier Reference Regnier2008). In this context, independent measurements of the sea level are crucial for any port, but particularly for strategic ports such as Singapore, Hong Kong, Rotterdam, New York, or Hamburg. In addition, the measurement of the sea level is crucial for our general understanding of the oceans and the earth, including rising sea levels.
In short, sea-level stations not only protect coastal population but also contribute to navigation and research. They are reliable, resilient, easy to maintain, and relatively inexpensive to deploy, and often provide country-specific services. Hence, an analysis of the number of sea-level stations provides a lower bound for protection against sea-originated disasters across the planet. If countries do not have tide gauges, they are not likely to have more advanced forecasting and protection technology.
DATA AND ESTIMATION
According to Hypothesis 1, leaders in large coalition systems should deploy more sea-level stations than their counterparts in small coalition systems. Hypothesis 2 states that leaders across all political systems should deploy more stations if the country’s capital is close to the coast. This section empirically tests these hypotheses using a new database of the number of sea-level stations.
The unit of analysis is the country in February of 2014. The dependent variable is called Stations and it has a mean of 6.19 and a variance of 496.42. In February 2014, 88 countries had at least one sea-level station, while 55 countries did not possess a single one of them. Landlocked countries were dropped from the analysis. The country with the largest number of sea-level stations is the United States with 227 stations; France follows with 83, Chile with 76 stations, and the United Kingdom with 68 stations. In all, 28 different countries, including Bangladesh and the Ukraine, have only one station. The sample contains 143 observations.
Figure 2 presents a histogram of the variable Stations. In February of 2014, there were 914 known stations across the world but due to the limited availability of some of the variables, the data set used for estimation has 886 stations. The list and number of stations was obtained from the Sea Level Station Monitoring Facility (SLSMF).Footnote 6 The SLSMF monitors world sea-level stations under the Global Sea Level Observing System Core Network and Regional Tsunami Warning Systems. These programs are coordinated by UNESCO’s Intergovernmental Oceanographic Commission.
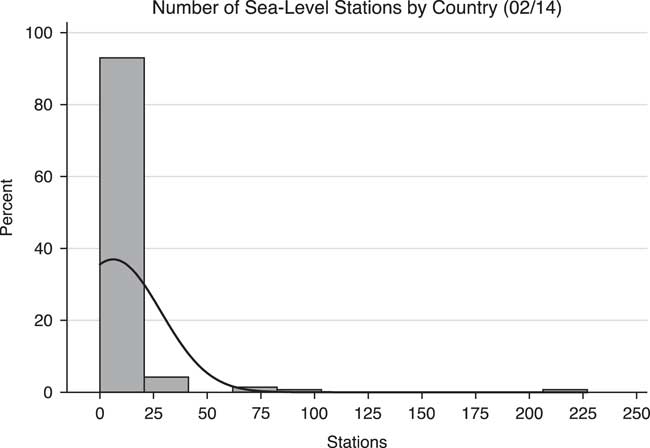
Fig. 2 Number of sea-level stations by country (February 2014)
The paper argues that leaders in large coalition systems provide more protection against disasters than their counterparts on small coalition systems. The estimate of the winning coalition (W) is a composite index of institutional variables that reflects the openness of a political system. Specifically, Bueno de Mesquita et al. (Reference Bueno de Mesquita and Smith2003) operationalize W as a composite index of POLITY IV data on competitiveness of executive recruitment, openness of executive recruitment, and competitiveness of participation regime. The composition of the winning coalition also includes regime type as defined by Banks’s Cross-National Time-Series Data Archive. Systems with small winning coalitions resemble autocracies, while systems with large winning coalitions are more similar to democracies. The size of the winning coalition has a minimum normalized value of 0 and a maximum of 1. The paper updated the value of W as described above using POLITY IV data from 2012 and Banks’s Cross National Data for 2011.Footnote 7
Hypothesis 2 focuses on the exposure of the winning coalition to ocean-originated hazards. As mentioned above, the paper argues that members of the winning coalition are more vulnerable to ocean-originated disasters if a country’s capital is near the sea. In order to measure proximity to the coast, the paper used the CIA’s latitude and longitude for all 194 capitals in the world and calculated the distance from those coordinates to the nearest shore using Google Maps.Footnote 8 The distance in kilometers from each capital (Capital Distance) to the nearest shore is presented in Appendix 1 and a histogram of this variable is presented in Figure 3. The median distance to the shore is 8.095 km (Bandar Seri Begawan in Brunei is 8.49 km away from the shore), while the minimum and maximum distances are 0.01862 (Port of Spain in Trinidad and Tobago) and 1146.76 (Islamabad in Pakistan) kilometers, respectively. All 194 files with the distance calculated with Google Maps are available at the author’s website.Footnote 9

Fig. 3 Distance from national capitals to the nearest shore
Estimation results use the natural logarithm plus one of Capital Distance as a first measure of shore proximity; this variable is labeled ln(Capital Distance). This functional form is quite useful because it measures orders of magnitude, thus minimizing potential measurement error.
As mentioned before, sea-originated disasters are most destructive in coastal areas. These areas include the seashore but also zones that are relatively close to it. For instance, Hurricane Sandy affected large portions of Manhattan, while the 7.5 m wall of water produced by the storm surge of Typhoon Haiyan in the Philippines in November 2013 virtually washed away the city of Tacloban.Footnote 10 Some tsunamis have horizontal inundations that reach 8 km. In other words, some cities located a few kilometers away from the shore might not be safe from ocean-originated hazards.
Large coastal cities illustrate the complexity in measuring exposure—although a city center might be far away from the shore, the city itself may reach the coast. For instance, the CIA’s coordinates for Tunis, the capital of Tunisia, locate it 9.78 km away from the shore but the city is evidently a coastal city. Lisbon, the capital of Portugal, has coordinates that are 12.52 km away from the shore. Yet, an earthquake and subsequent tsunami destroyed the city in 1755. To account for this, the paper relies in a dummy variable called Sea Capital that is equal to 1 if the variable Capital Distance is less or equal to its median of 8.095 km. Robustness tests estimate models with other functional forms of distance to the shore.
The empirical analysis also controls for previous disasters. Countries are better prepared for disasters when they have high disaster propensity (Keefer, Neumayer and Plümper Reference Keefer, Neumayer and Plümper2011; Neumayer, Plümper and Barthel Reference Neumayer, Plümper and Barthel2014). In order to account for previous occurrences of sea-originated disasters, model specification includes the natural logarithm plus one of the cumulative number of storms by country from 1900 to 2008; this variable is labeled ln(Number Storms). The number of storms is provided by the Emergency Events Database (EM-DAT) at the Centre for Research on the Epidemiology of Disasters (CRED).Footnote 11 This database contains information about the occurrence and characteristics of more than 16,000 disasters in the world since 1900. It is well known that the EM-DAT database is susceptible to reporting biases (Guha-Sapir, Hargitt and Hoyois Reference Guha-Sapir, Hargitt and Hoyois2004) and yet it provides one of the best publicly available databases on natural disasters.
As an additional measure of exposure to ocean-originated hazards, the paper includes the natural logarithm plus one of the length of a country’s coastline in kilometers (ln(Length Coast)). This variable was obtained from the CIA’s World Factbook.Footnote 12 The paper also explores the percentage of a country’s population in low elevation coastal zones (LECZ Population Pc). This variable was obtained from the Urban-Rural Population Estimates, v1 (2000) from NASA’s Socioeconomic Data and Application Center’s collection on Low Elevation Coastal Zones. Unfortunately, data are only available for the year 2000. At the time of writing, this is best source of global population data in low elevation coastal zones.Footnote 13
The paper also controls for countries’ vulnerability to tsunamis. Tsunamis can be caused by earthquakes, volcanoes, and landslides, among other factors. Earthquakes and volcanoes are more common in the Pacific Ocean because it contains multiple tectonic plates: Chile is mostly affected by the Nazca Plate, Mexico by the Cocos Plate, the west of the continental United States and Canada is affected by the Juan de Fuca and the Pacific Plates, Japan is vulnerable to the Pacific and the Philippine Plates, and Indonesia is vulnerable to the Pacific and the Australian Plates. All countries in the Pacific Ocean have experienced short and long distance tsunamis. Therefore, the paper includes a dummy variable Pacific that is equal to 1 if the country has a coast on the Pacific Ocean and equal to 0 otherwise. This variable is also equal to 1 if the country is close to the point where the Pacific, Philippine, Australian, and Eurasian Plates converge. Indonesia is a country in this location. The list of the countries in the Pacific Ocean is presented in Appendix 2.
As multiple countries may experience the same natural hazards, sea-level stations may play a role in reducing regional vulnerability. It is therefore possible that engagement in international cooperation and participation in international organizations might contribute to the development and deployment of sea-level stations. To account for participation in international organizations related to the observation of sea levels, the paper created a dummy variable called IOC Membership that is equal to 1 if a country is a member of UNESCO’s Intergovernmental Oceanographic Commission in March of 2014.
Likewise, it is possible that bilateral links might contribute to the deployment and maintenance of stations. In order to account for this, the paper controls for the number of diplomatic representatives in each country; this variable is labeled Diplomatic Representation. For instance, there are 179 diplomatic representatives at the level of charge d’affaires, minister, ambassador, and other high-ranking positions in the United States. This is the largest number of representation in a single country. The smallest number is in Nauru, where there are only 11 diplomats of the aforementioned ranks. Of course, the number of diplomatic representatives in a country is not a perfect measure of foreign assistance, but it gives a sense of how important a country is and how much technical assistance it may receive. The most recent measurement of this variable is for 2005 and it was obtained from the Diplomatic Exchange Database (Bayer Reference Bayer2006) at the Correlates of War Project.
It was argued before that sea-level stations are also important for navigation, both commercial and recreational. Countries with economies that rely on commercial navigation therefore need to deploy more stations. As a measure of the importance of commercial navigation, and particularly global shipping, the paper uses a country’s liner shipping connectivity index (Shipping). This index, provided by the 2010 World Bank’s World Development Indicators, captures a country’s connection to global shipping networks through a measure of a country’s “number of ships, their container-carrying capacity, maximum vessel size, number of services, and number of companies that deploy container ships in a country’s ports. For each component a country’s value is divided by the maximum value of each component in 2004, the five components are averaged for each country, and the average is divided by the maximum average for 2004 and multiplied by 100. The index generates a value of 100 for the country with the highest average index in 2004.”Footnote 14 In the database used for estimation in this paper, the country with the maximum index value is China with an index of 132.47, while Qatar has the lowest value with an index of 2.1.Footnote 15 Summary statistics for all variables are presented in Appendix 3.
Estimation Results
The main estimation results are presented in Table 1, with coefficients and standard errors in parentheses. Models 1–3 are negative binomial count models where the dependent variable is the number of sea-level stations by country. Model 1 is a baseline model that maximizes the number of observations by only controlling for ln(Capital Distance), ln(Number Storms), ln(Length Coast), LECZ Population Pc, Pacific, IOC Membership, and Diplomatic Representation.Footnote 16 Model 2 adds the winning coalition W and the variable Shipping. Model 3 replaces the variable ln(Capital Distance) with the dummy variable Sea Capital, which is equal to 1 if the variable Capital Distance is less or equal to its median of 8.095 km.
Table 1 Main Estimation Results

Note: DV: Number of sea-level stations. Unit: Country.
*p<0.10, **p<0.05, ***p<0.01.
Model 4 estimates a zero inflated negative binomial count model where the count equation is given as in Model 3 and where the inflation equation is determined by the size of the winning coalition, the natural logarithm of the number of people killed by storms plus 1 (ln(Storm Deaths)), and their interaction term. The mean number of deaths is 9555.5 with a variance of 3.39e09. This specification for the inflation equation is chosen because the effect of disaster-related casualties also depends on political systems (Quiroz Flores and Smith Reference Quiroz Flores and Smith2013). In this model, 70 countries have at least one sea-level station, while 46 do not have sea-level stations.
This section tests whether leaders in large coalition systems deploy more sea-level stations than their counterparts in small coalition systems, and whether leaders across political systems deploy more stations if the country’s capital is near the coast.
First, the positive and statistically significant coefficients for W in Models 2–4 indicate that countries will large winning coalitions have more sea-level stations than countries with small winning coalitions. Substantively, results from Model 2 indicate that when the size of the winning coalition increases from 0 to 1, and all other covariates are set at their means, the number of stations jumps from 0.52 stations (with an SE of 0.21 and 95 percent confidence interval of (0.10, 0.94)) to 2.75 stations (with an SE of 0.55 and 95 percent confidence interval of (1.67, 3.83)). According to Model 3, when the size of the winning coalition increases from 0 to 1, and all other covariates are set at their means, the number of stations jumps from 0.13 stations (with an SE of 0.08 and 95 percent confidence interval of (−0.03, 0.29)) to 4.94 stations (with an SE of 1.38 and 95 percent confidence interval of (2.24, 7.65)). According to Model 4, when the size of the winning coalition increases from 0 to 1, and all other covariates are set at their means, the number of stations jumps from 0.13 stations (with an SE of 0.09 and 95 percent confidence interval of (−0.04, 0.32)) to 5.29 stations (with an SE of 1.53 and 95 percent confidence interval of (2.28, 8.31)). These quantities of interest confirm that countries with large winning coalitions have more sea-level stations.
In order to test whether leaders across political systems deploy more stations if the country’s capital is near the coast, the paper focuses on the test of the restriction (Sea Capital)+(W)(Sea Capital).Footnote 17 According to Model 3, the point estimate for this restriction is −0.64 with an SE of 0.40. To facilitate a substantive interpretation of the restriction and its interaction term (Brambor, Clark and Golder Reference Brambor, Clark and Golder2006), Figure 4 presents point estimates of the restriction and their 95 percent confidence interval for different values of W according to Model 3.Footnote 18

Fig. 4 Point estimate of the linear restriction (Sea Capital)+(W)(Sea Capital) Note: CI=confidence interval.
Figure 4 indicates that for large values of W—specifically W=1 and W=0.75—the linear restriction is not significant; this means that the location of the capital in democratic countries does not determine the number of sea-level stations. This is precisely what the theory suggested—the logic of survival in large coalition systems compels politicians to provide large-scale protection regardless of the location of the capital city. However, as the size of the winning coalition decreases and political institutions become less democratic, the restriction becomes statistically significant and positive. In fact, the point estimate of the linear restriction when W=0 is the same as the point estimate of Sea Capital. The same conclusion can be derived from Model 4, where the estimate of (Sea Capital)+(W)(Sea Capital) is −0.62 with standard error if 0.41, which is indistinguishable from 0.
Altogether, these results indicate that exposure of the capital city to ocean-originated hazards increases the number of stations in autocratic systems. Democratic politicians, according to the logic of political survival, provide protection to the entire country, including the capital city regardless of its location.
This notwithstanding, the quantities of interest for the restriction (Sea Capital)+(W)(Sea Capital) are not as highly significant as the quantities produced by changes in the size of the winning coalition discussed above.Footnote 19 Substantively, Model 3 predicts that a country with an inland capital and W=0, and all other covariates set at their means, will have 0.11 stations (with standard error of 0.07 and 95 percent confidence interval of (−0.03, 0.25)). As predicted by the theory, this point estimate is not statistically significant—autocrats do not provide protection if members of the winning coalition are not exposed to hazards. However, if this same country moved the capital to the coast, the number of stations would increase to 1.05 stations (with standard error of 0.49 and 95 percent confidence interval of (0.07, 2.03)). This quantity is statistically significant and positive, which was also predicted by the theory—autocrats provide protection to coalition members if they are exposed to disasters. Yet, the paper expresses some reservation about these results because the confidence intervals for these two quantities of interest slightly overlap. At the 90 percent confidence level, the overlapping is minimal.Footnote 20 The same trend is repeated in Model 4.
In sum, political institutions, and particularly the size of the winning coalition, have the strongest effect on the number of sea-level stations—a change from very small to very large coalitions is associated with a range of two to five additional stations. This is a result that holds for a number of robustness tests presented in the next section. Evidence on the effect of coastal capitals on the number of stations, although significant in point estimates, is more mixed in terms of quantities of interest.
Robustness Tests
To test the robustness of these results, the paper estimated eight additional models, which are presented in Appendix 4. Model 3r—an unrestricted version of Model 3—includes the variables ln(GDPpc), ln(Population), and FDI in the specification. Model 5 estimates the effect of the quadratic polynomial of a capital’s distance to the shore in order to avoid defining a coastal capital according to an arbitrary threshold. Model 6 replaces the variable ln(Number Storms) with (ln(Storm Deaths)), which is the natural logarithm plus one of the cumulative number of people killed by storms by country from 1900 to 2008. This variable was also obtained from the EM-DAT at the CRED. The mean number of deaths is 9555.5 and it has a variance of 3.39e09.
In order to obtain a better balance in covariates, Models 7–11 drop influential observations.Footnote 21 Model 7 eliminates the four countries with the largest number of stations—the United States with 227 stations, France with 83, Chile with 76, and the United Kingdom with 68 observations. Model 8 eliminates observations with countries with a tradition of ocean research—the United States, France, and the United Kingdom. The countries eliminated from Models 7 and 8 are also wealthy, democratic countries. Model 9 drops the observations for the United States and Russia, as a history of political, military, and scientific competition may have determined the number of stations. Model 10 eliminates observations for very wealthy countries—these are countries with a natural logarithm of GDP per capita above the 90th percentile. Model 11 eliminates observations for countries with W=1, the maximum value for the size of the winning coalition.
The models in Appendix 4 present similar characteristics to the models in Table 1. First, all models present a positive and statistically significant estimate for the size of the winning coalition. Second, the estimate for Sea Capital is positive and significant, which is equivalent to the case where W=0 in (Sea Capital)+(W)(Sea Capital).Footnote 22 This suggests that autocratic countries with costal capitals also provide protection against disasters.
The point estimates of the restriction (Sea Capital)+(W)(Sea Capital) are −0.71, −0.29, −0.66, −0.68, −0.47, and −0.28 for Models 6, 7, 8, 9, 10, and 11, respectively. These point estimates have standard errors of 0.41, 0.40, 0.40, 0.42, 0.48, and 0.36, respectively. Clearly, these linear restrictions are not statistically significant, with the exception of Model 6 where the restriction is significant at the 90 percent confidence level. This suggests that the location of the capital does not determine the number of stations in countries with large W systems.
Model 5 confirms that autocratic countries with coastal capitals also deploy sea-level stations. This model relies on a quadratic polynomial of a capital’s distance to the shore and its interaction with the size of the winning coalition. The point estimate of the quadratic polynomial of distance is −0.017 with an SE of 0.008, which is statistically significant. Hence, when W=0, as the distance between the capital and the coast increases, autocratic governments deploy fewer stations. This is consistent with theoretical expectations stated in Hypothesis 2. Likewise, the point estimate of the quadratic polynomial of distance and its interaction with W is 0.005 with an SE of 0.003, which is not significant. This suggests distance from the shore to the capital in democratic countries does not determine the number of sea-level stations.
In terms of substantive results, the size of the winning coalition has the strongest and most consistent effect on the predicted number of sea-level stations—changes from very small to very large coalitions is always associated with additional stations. The quantities of interest for the effect of Sea Capital, again, present the same trend—the point estimates have the sign and significance predicted by theory, but their differences are not as significant due to overlapping confidence intervals, particularly in model 10 where very wealthy countries were dropped from the analysis. In spite of this, empirical results still provide strong and clear evidence in favor of the positive effect of democratic political institutions on protection against ocean-originated hazards.
CONCLUSION
Recent research on natural disasters has concentrated on the political effects of these natural hazards (Brass Reference Brass1986; Keller Reference Keller1992; Albala-Bertrand Reference Albala-Bertrand1993;Garrett and Sobel Reference Garrett and Sobel2003; Achen and Bartels Reference Achen and Bartels2004; Sylves and Buzas Reference Sylves and Buzas2007; Malhotra and Kuo Reference Malhotra and Kuo2009; Healy and Malhotra Reference Healy and Malhotra2009; Healy and Malhotra Reference Healy and Malhotra2010; Bechtel and Hainmueller Reference Bechtel and Hainmueller2011; Gasper and Reeves Reference Gasper and Reeves2011; Keefer, Neumayer and Plümper Reference Keefer, Neumayer and Plümper2011; Reeves Reference Reeves2011; Chen Reference Chen2013; Quiroz Flores and Smith Reference Quiroz Flores and Smith2013; Neumayer, Plümper and Barthel Reference Neumayer, Plümper and Barthel2014). Most of this work has highlighted the qualities of democratic institutions, but little emphasis has been placed on the protection provided by autocratic leaders. This paper takes a first step in this direction.
Using sea-level stations as lower bound for protection against ocean-originated disasters, the paper consistently shows that leaders in large coalition systems deploy more sea-level stations than their counterparts in small coalition systems. The paper further contributes to our understanding of the relationship between politics and disasters by arguing that autocrats also provide protection when their key political supporters are located in a vulnerable area of their country. Empirical evidence suggest that if the national capital is near the coast, thus exposing members of the ruling coalition to ocean-originated hazards, leaders across political systems install more sea-level stations. Nonetheless, this conclusion should be taken with some caution, as some quantities of interest vary in significance.
Future research should address this and other shortcomings in the paper, such as alternative measures of disaster protection, particularly as countries may experience different types of disasters. At the time, sea-level stations continue to be the most important instrument to understand the effects of ocean-originated hazards where they are most lethal and destructive—on the shore. However, as disasters become more complex, new methods to protect the population are currently being deployed. Up to this point, this paper has shown that political institutions continue to determine protection against ocean-originated hazards, at least as defined by the number of sea-level stations.
Appendix
Table A1 Distance from National Capitals to the Nearest Shore

Appendix 2
Table A2 Countries in the Pacific Ocean

Appendix 3
Table A3 Summary Statistics

Appendix 4
Table A4 Robustness Tests


