


The nature and quality of democracy is closely connected to questions of which members of the polity are able to participate in the electoral process (Keyssar, Reference Keyssar2009). Indeed, work on the impact of felon disenfranchisement laws (Gerber et al., Reference Gerber, Huber, Meredith, Biggers and Hendry2017), voter identification laws (Citrin et al., Reference Citrin, Green and Levy2014; Highton, Reference Highton2017; Grimmer et al., Reference Grimmer, Hersh, Meredith, Mummolo and Nall2018), early voting policies (Fullmer, Reference Fullmer2015; Burden et al., Reference Burden, Canon, Mayer and Moynihan2017), registration windows (Hanmer, Reference Hanmer2009; Leighley and Nagler, Reference Leighley and Nagler2013; Burden et al., Reference Burden, Canon, Mayer and Moynihan2014b), and variation in voting machines, operating hours and waiting times (Highton, Reference Highton2006; Herron and Smith, Reference Herron and Smith2015, Reference Herron and Smith2016; Stewart and Ansolabehere, Reference Stewart and Ansolabehere2015; Pettigrew, Reference Pettigrew2017) have all demonstrated the importance of election administration decisions for political participation and electoral outcomes.
The decision of where to locate polling places represents another such routine election administration decision that impacts whether and how voters are able to participate in the electoral process. Insofar as voters are sensitive to changes in the costs of voting—as ample theory suggests (Downs, Reference Downs1957; Wolfinger and Rosenstone, Reference Wolfinger and Rosenstone1980; Powell, Reference Powell1986; Highton, Reference Highton2004)—changing where voters vote is likely to impact voter turnout by: creating confusion among affected voters, introducing search costs to find the new polling place, affecting how long it takes to travel to the polls (Brady and McNulty, Reference Brady and McNulty2011; Amos et al., Reference Amos, Smith and Claire2017), and disrupting voting habits (Brody and Sniderman, Reference Brody and Sniderman1977; Plutzer, Reference Plutzer2002; Gerber et al., Reference Gerber, Green and Shachar2003).
In this paper, we test how voter turnout responds to costs that result from changes in the location of Election Day polling places. We do so by assembling a balanced panel of more than 2 million eligible voters from the North Carolina voter rolls across three presidential elections—2008, 2012, and 2016. For each election, we geolocate every voter and every polling place to identify whether a voter experienced a polling place change and to measure the resulting change in the voter's travel time to their polling place. We further measure whether a voter votes, and how they cast their ballot—for example, on Election Day or in-person early.Footnote 1 Using this data, we leverage within-individual variation to estimate the state-wide average effect of a polling place change on voter turnout. By employing a comprehensive set of fixed effects and fixed effect interactions, we account for many potential confounders to an unbiased estimation of this relationship—these include the individual propensity to vote, common features of elections that may affect turnout, trends in turnout (and turnout by mode) for voters of different races, and county-specific trends in factors like early voting availability. We therefore substantially limit the scope for unobserved heterogeneity to confound our results.
We find that the effect of changes in polling place locations are more complex than existing theory on the depressive turnout consequences of increased voting costs would predict. Amongst our balanced panel of non-movers, polling place changes decrease Election Day voting by about − 0.7 percentage points on average, but this effect is nearly perfectly offset by an increase in in-person early voting. Furthermore, when we allow our effects to vary by important characteristics of voters, like race, we find the same off-setting, although weaker, pattern amongst non-whites. Overall, our results indicate that voters respond to changes in the costs associated with voting on Election Day by substituting into an alternative mode of voting, not by forgoing casting a ballot. Although this substitution appears somewhat puzzling, we theorize that this occurs because voters whose polling places change location receive notification mailers, priming them to think about the election before election day, driving early voting.
Our results are consistent in a number of ways with the pathbreaking work of Brady and McNulty (Reference Brady and McNulty2011) on the consequences of polling place changes. Analyzing the California 2003 gubernatorial recall election, the authors find that voters whose precincts were consolidated—and thus whose assigned polling place changed—were 1.85 percent less likely to vote. The authors also find that polling-place voting declined by 3 percent, but that this was partially offset by a 1.2 percent increase in mail-in voting. In addition to an intrinsic effect of a polling place change, the authors find that the effect varies with the change in distance to the poll. Like Brady and McNulty (Reference Brady and McNulty2011), we find a decline in Election Day voting, substitution between voting modes, as well as a greater decline in turnout amongst those whose polling places were moved further from their homes.
Crucially however, our results also differ from those of Brady and McNulty (Reference Brady and McNulty2011), and subsequent important studies by Amos et al. (Reference Amos, Smith and Claire2017) and Yoder (Reference Yoder2018), in several important ways. First, we do not find evidence of an overall decrease in turnout on the scale found by these authors nor that we can statistically distinguish from zero; rather, we find that Election Day voting declines modestly (− 0.7 percentage points) and early voting nearly perfectly offsets those declines. Furthermore, we find that while those moved further from their polling place substitute more between modes, that substitution is once again entirely offsetting.
Moreover, in the spirit of “normal” scientific advancement, the nature and scope of our data and research design substantially narrows the potential consequences of unobserved heterogeneity and improves our confidence that the estimated effects are indicative of true causal effects. Moreover, because we are strictly theory testing rather than proposing a new theory based on our results, our analysis is not susceptible to the sharpshooter fallacy.Footnote 2
Third and finally, the scope of our analysis also allows us to probe the generalizability of existing findings and to help contextualize them more broadly. Where Brady and McNulty (Reference Brady and McNulty2011) examine effects of polling place changes in a single gubernatorial recall election in a single county (Los Angeles), we examine behavioral patterns across an entire state and multiple presidential elections. Insofar as we are concerned about how polling place changes may impact state and national election outcomes by changing turnout—a real possibility in the pivotal and closely contested swing state of North Carolina—the cross-county heterogeneity we find makes it clear that it is important to look beyond a single locality to identify the average statewide effect, an effect that has never previously been estimated.
Our analysis also documents considerable county-level variation in the estimated effects of polling place changes in North Carolina. We show that while there is no systematic evidence that polling place changes impact overall turnout—there are as many counties where the estimated effect is positive as there are counties where the effect is negative. An analysis focused on a single county might therefore erroneously conclude that voters are systematically influenced by polling place changes, while when contextualized in a state-wide analysis, this interpretation appears unlikely to be correct. This highlights the importance of examining more than a single election administrative unit (e.g., a county), especially when endogenous case selection is a possibility. Indeed, the variation that we document should be of interest to the entire election administration and election forensics literatures where studies of voters in a single unit where election administration decisions such as polling places are made (typically the county) are the norm rather than the exception (Gimpel and Schuknecht, Reference Gimpel and Schuknecht2003; Dyck and Gimpel, Reference Dyck and Gimpel2005; Haspel and Knotts, Reference Haspel and Knotts2005; Cantoni, Reference Cantoni2016; Amos et al., Reference Amos, Smith and Claire2017).
Of course, even this study is a study of a single state. But, as we noted before, this is a state whose electoral outcomes are of intrinsic interest to both state-level and national politics. In addition, as we discuss in detail in this paper, our ability to study the universe of counties (each of which makes their own polling place location decisions) under North Carolina's state-wide election administration institutions provides a perspective on cross-county variation (and thus interpretation of county-specific estimates) that is simply unavailable in single-county studies. Furthermore, that fact that our results differ from the negative turnout effects found by Yoder (Reference Yoder2018), who uses a limited sample of North Carolina counties, further highlights the dangers of inferring state-wide effects from a limited sample of counties.Footnote 3
Our paper further contributes with a number of key measurement and research design improvements. Our panel data allow us to eliminate movers from our analysis—that is, those who move far enough that they fully select into polling place changes, and who must therefore search for their new polling place location regardless of whether the polling place that they will vote at is in the same location as a previous election. Our data also allow us to estimate changes in travel time to the polls, rather than simply geometric “as-the-crow-flies” distance, which may obscure important road density and traffic variation that impact turnout. Our balanced panel across three elections allows us to employ a research design with extensive fixed effects and fixed effect interactions to eliminate potential confounders, which improves on much of the literature on this topic.
The lack of an overall impact on turnout is perhaps surprising in light of theoretical claims about how costs impact turnout. However, we elaborate a number rationales for the state-wide substitution effects that we find. First, North Carolina voters receive an official county mailer advising them whenever their polling place changes, and which also provides early voting information. As well as counteracting confusion, these mailers may operate like get-out-the-vote primes (Arceneaux and Nickerson, Reference Arceneaux and Nickerson2009). And indeed the magnitude of the substitution we find is highly consistent with turnout estimates from this literature (Gerber and Green, Reference Gerber and Green2000).
The offsetting substitution we find also accords with findings on how voters respond to a disruption in their voting habit (Meredith and Malhotra, Reference Meredith and Malhotra2011). If voters are risk averse and value voting, they may substitute into a less risky mode of voting where they have the time to search for information and overcome costs and errors rather than risk not casting a ballot at all. While some have suggested that the availability of early voting decreases turnout (Burden et al., Reference Burden, Canon, Mayer and Moynihan2014a), our findings suggest that the availability of early voting may help mitigate the negative effects of polling place changes on turnout by allowing voters more time to find an alternative polling place. Of course, this is a suggestive interpretation as it is impossible to know the overall consequences if early voting were not an option at all. Together these explanations rationalize our results, but merit further investigation in other settings and with other research designs to understand the ways in which costs imposed on voting can be moderated.
1. The potential effects of polling place changes
The large literature on political participation has long argued that any imposition of costs is likely to reduce participation (Downs, Reference Downs1957; Wolfinger and Rosenstone, Reference Wolfinger and Rosenstone1980; Powell, Reference Powell1986; Highton, Reference Highton2004). The behavioral expectations of the impact of polling place changes are therefore exceptionally clear—changes in location should depress turnout by increasing the costs of voting. First, the simple fact of a moved polling place may be costly to voters even if there is no change in the time needed to travel to the poll because of psychological costs—confusion and habit disruption—that voters must overcome to cast a ballot (Brady and McNulty, Reference Brady and McNulty2011; Amos et al., Reference Amos, Smith and Claire2017).
Second, changes to polling place locations almost always alter how long it takes most voters to travel to cast a ballot. While confusion and habit disruption unequivocally increase voting costs, changing travel times do not (Gimpel and Schuknecht, Reference Gimpel and Schuknecht2003; Dyck and Gimpel, Reference Dyck and Gimpel2005; Haspel and Knotts, Reference Haspel and Knotts2005; Brady and McNulty, Reference Brady and McNulty2011; Cantoni, Reference Cantoni2016; Amos et al., Reference Amos, Smith and Claire2017). We might expect that those whose polling places are moved farther away may forgo casting a ballot due to the increased cost of traveling to the polls, while those whose polling places are moved closer may be more likely to turnout since their costs have been reduced. Though this effect may be further moderated by where people work, run errands, etc. in addition to where people live. The relative impact of increased (as compared to decreased) travel times, as well as travel costs relative to per se costs is theoretically unclear.
We may also expect differences in the relative ability of different groups to overcome the costs associated with polling place changes. Although racial differences in participation have declined since the 1980s (Leighley and Nagler, Reference Leighley and Nagler2013; Fraga, Reference Fraga2016), voters with fewer material resources—lower income and minority voters, for example—might be less able to overcome increased costs to voting (Verba et al., Reference Verba, Schlozman and Brady1995). Alternatively, historical experiences with disenfranchisement, or other group norms (Anoll, Reference Anoll2018), may differentially motivate non-white voters to overcome the costs imposed by polling place changes to cast their ballot.
The literature on costs and participation would conclude that increasing the cost of casting a ballot should result in lower turnout. But the election administration policies of North Carolina may also exacerbate or counteract some of the increased costs associated with polling place changes. Most notably, voters have a choice between voting on Election Day or early. Voters who choose to vote early can vote at any early voting location in the county with no excuse. There is variation in the number of early voting locations between counties which we control for in our analyses, but every county has to have at least one early voting location open for 100 total hours prior to Election Day.
If voters are risk averse, or value their vote highly, moving a polling place may cause voters to vote early in response. Prior work has indeed found evidence that voters shift between modes of voting rather than forgo casting a ballot when there are changes in the procedures for a particular mode of voting (Malhotra et al., Reference Malhotra, Michelson, Rogers and Valenzuela2011; Michelson et al., Reference Michelson, Malhotra, Healy, Green, Carnegie and Valenzuela2012). Voters may choose to vote early rather than risk the uncertainties of dealing with a new polling place on Election Day. While some have argued that convenience voting may decrease turnout (Burden et al., Reference Burden, Canon, Mayer and Moynihan2014a) (while others have found the opposite (Gerber et al., Reference Gerber, Huber and Hill2013)), for voters who are forced to find and vote at a new polling place because their polling place was changed, the ability of voters to vote early may provide them with the incentive and opportunity to vote early in response.
Another important feature of the North Carolina electoral landscape is the fact that County Board of Elections send out an informational mailer to all voters affected by a polling place change. The mailer provides voters with the address of their new polling place and links to websites with further information about early voting. An example of a mailer from Wake County is provided in Supplementary Appendix B. These mailers in theory help offset the search costs involved with finding the new polling place, locate the county's early voting location, as well as effectively providing a reminder to vote. In fact, voting primes are well known to affect turnout (Gerber and Green, Reference Gerber and Green2000; Gerber et al., Reference Gerber, Green and Larimer2008), and prior work suggests that reminders by election administrators can moderate the negative consequences of certain election reforms (Bergman and Yates, Reference Bergman and Yates2011).Footnote 4 Insofar as these mailers reduce the cost of gathering information on early voting by identifying its existence and providing web information, existing research suggests that they may also help induce voters to change their method of voting to the convenience method (Monroe and Sylvester, Reference Monroe and Sylvester2011; Hanmer et al., Reference Hanmer, Herrnson and Smith2015).
2. Data on voters, votes, and polling places
To identify the effects of polling place changes on voters in North Carolina, we collect individual-level data on every voter from the official state voter rolls between 2008 and 2016. We supplement this data with information on precinct boundaries and the location of nearly every polling place in the state for each election. Our choice of North Carolina is in part a function of the unique availability of comprehensive voter and polling place information, but it is also motivated by the ability to study the effect of polling place changes at the state level over several closely contested and highly-salient elections with national implications.
Our individual-level dataset contains demographics, polling place assignments, and voting histories for 2,350,731 unique voters collected from snapshots of the North Carolina Voter Roll provided by North Carolina State Board of Election (NCSBE) between 2008 and 2016. (See Supplementary Appendix A for additional details on the data collection.) The voter file contains information on voter registration status, party registration, race, gender, and age which are then paired with records from the North Carolina State Board of Elections on how each voter voted (e.g., Election Day, mail-in, in-person early), if at all, in the three presidential elections.
We focus our analysis on what we refer to as our “balanced panel” of 4,434,125 voter-year observations of voters eligible to vote in both 2008 and 2012. Two years of eligibility are required as a first time voter cannot, by definition, experience a change in polling place location.Footnote 5 Because we have a balanced panel, we are able to track the behavior of the same voters over time to ensure that the effects we identify are a consequence of polling place changes rather than compositional changes in voters being analyzed.
To identify the location of voters’ residences in our panel, we geocode voter addresses using the geocod.io geocoding serviceFootnote 6, and we link voters to their precincts and Election Day polling places for the three presidential elections that we examine. Polling place locations were also geocoded using the geocod.io geocoding service and merged with shapefiles of election precinct boundaries (see Supplementary Appendix L for details). We also use this spatial information to exclude people from our analysis who have moved. Focusing on the 2,350,731 unique individuals (69.9 percent of all geocoded, eligible voters with polling places) ensures that the effects of polling place changes we identify are a consequences of polling places being moved, rather than the movements of voters.
Our exclusion of movers includes those who moved short distances such that their new polling place assignment was the same as that of their old residence. Because the change in the distance to their polling place is due to their move rather than administratively-induced changes, we exclude them from analyses to avoid compositional changes across analyses. However, we examine the differential effect of polling place changes per se for this population relative to non-movers separately in Supplementary Appendix O.Footnote 7 Supplementary Appendix A compares our panel to the set of all eligible voters according to the 2008–2016 voter rolls.
Overall, 17 percent of voters experienced a polling place change between 2008 and 2012, and 16 percent experienced a change between 2012 and 2016. Polling place changes can arise for one of two reasons: the location of a given precinct's polling place may be moved, or a change in a precinct's boundary can move a voter from one precinct to another. Although most of the changes are due to re-precincting rather than adding or subtracting the number of polling places, by gathering data on both county-drawn precinct boundaries and polling place locations, we identify the consequences of changes that result from both processes.
In our analysis, we focus only on changes made between presidential elections (rather than between the current general election and the preceding general election). We do so for two reasons. First, we feel focusing only on presidential elections improves comparability in our panel. But second, and more importantly, in North Carolina nearly all (general) Election Day polling place changes take place in the immediate run-up to a presidential election. As such, there are almost no cases where a voter's Election Day polling place was changed between a presidential election and the subsequent mid-term, and so our variable for “has voter's polling place changed since the last presidential election” is nearly equivalent to “has voter's polling place changed since the last general election.”
To illustrate the type of changes we examine, Figure 1 presents maps of the location of Election Day polling places in 2008 and 2012 (Map (a)) relative to those in 2012 and 2016 (Map (b)) for Precinct 22 in central Charlotte. Between 2008 and 2012, the polling place in Precinct 22 was moved to a Census block with a higher-than-average percentage of black residents (Census block groups are shaded in the background according to their racial composition in the 2010 Census, with darker shades indicating a higher percentage of black residents). But in 2016, the location of the polling place was moved back to a part of the precinct with a higher percentage of white voters. In addition to identifying the overall effect of such changes on turnout, we also use the richness of our data to examine whether voter characteristics such as race condition the effect. To probe the robustness of the results to factors that may vary at the county level—and to highlight inferential issues that can arise from focusing on a specific locality—we also examine the effects of precinct changes for each county to determine if some counties have larger effects than others. In so doing, we correct for the problems caused by multiple testing (Benjamini et al., Reference Benjamini, Krieger and Yekutieli2006).

Figure 1. Polling places in Precinct #22, Charlotte, Mecklenburg county (a) 2008 and 2012 (Democrats), (b) 2012 and 2016 (Republicans).
Notes: The above maps illustrate movement in polling place locations using the example of central Charlotte in Mecklenburg county. Map (a) presents the locations of polling places in 2008 (Xs) and 2012 (squares). Map (b) presents the locations of polling places in 2012 (squares) and 2016 (crosses). The background is shaded according to the racial composition of census block groups in the 2010 census with darker shades of gray indicating a higher percentage of black residents. Gray boundaries indicate 2016 precinct boundaries with precinct #22's boundary outlined in bold black.
In addition to identifying whether a voter's polling place has changed between presidential elections, we are also able to measure how far voters have to travel from their residence to reach their polling place. We use Google Directions API to estimate how long it takes every voter to reach their polling place by car in minutes from the population-weighted centroid of their Census block at 10 am on Election Day, Tuesday, 6 November 2018.Footnote 8 Using estimated travel times is important because straight-line distance measures may mask substantial variation in actual travel times depending on road density and traffic congestion.Footnote 9
Figure 2 plots the distribution of polling place changes in terms of the proximity between the old and new polling places (Plot (a)) and the change in predicted drive times between old and new polling place (Plot (b)). Most polling places experienced relatively small changes in their location—unsurprising, given the size of precincts and the availability of suitable alternative sites—and travel times did not systematically increase or decrease. In general, conditional on experiencing a polling place, very few voters had their travel times changed by more than 5 minutes—indeed 5 and a half minutes represents two standard deviations of the distribution. Other work has measured distance rather than travel time in the context of polling place changes (Haspel and Knotts, Reference Haspel and Knotts2005; Brady and McNulty, Reference Brady and McNulty2011), nevertheless, the average treatment in existing work (between a half of a mile to a mile) is of a similar magnitude to what we document in terms of travel time. Thus, for the vast majority of voters we study, the treatment dosage is comparable to existing work.Footnote 10

Figure 2. Distribution of distance of polling place changes and changes in drive time: (a) change in distance between past and current polling place location, (b) change in drive time to polling place.
Notes: Among those experiencing a polling place change in either 2012 or 2016, Plot (a) presents the distribution of voter-election changes in polling place locations (weighted by the number of voters experiencing the change). Plot (b) presents the distribution of these changes in terms of driving time to the new polling place. Supplementary Appendix G presents the years separately.
While we do not think that polling places are moved randomly, work by Clinton et al. (Reference Clinton, Eubank, Fresh and Shepherd2020) shows that the partisanship and race of a voter is uncorrelated with the probability that the voter experiences a change in polling place location. This suggests that officials are not obviously moving polling places in a way explicitly designed to affect turnout by targeting certain types of voters.
3. The effect of polling place changes on turnout
We begin by considering the average effect of polling place location changes on turnout. We include controls for travel costs to differentiate between the impact of a change per se—which theory predicts should depress turnout either through search costs, confusion or habit disruption—and the impact of changes in the costs of voting caused by changes in travel times to the polls. We examine the effects for overall turnout, as well as the effect on Election Day and early turnout, specifically, since changes to the cost of Election Day voting may affect whether voters choose to vote early, in addition to whether they turnout at all.
Figure 3 descriptively plots how polling place changes correspond with voter turnout for the 2012 and 2016 presidential elections. Plot (a) shows that voters who experience a change in their polling place location are less likely to vote on Election Day—a decline that occurs regardless of whether the changes occur in 2012 or 2016. However, Plot (b) shows that early voting increased among affected voters such that the overall relationship with turnout (Plot (c)) is effectively null. On average, the aggregate difference between Election Day and early voting appears to be negligible. This is surprising given our strong theoretical priors on the negative costs associated with moving polling places.

Figure 3. Descriptive relationship between polling place changes and turnout type by year. (a) Election Day voting, (b) early voting, (c) all voting.
Notes: The bar plots summarize average voter turnout by year depending on whether an individual experienced a polling place change. Plot (a) presents the relationship for Election Day voting, (b) presents the relationship for early voting, and (c) presents total turnout.
To visualize how these relationships depend on travel time, Figure 4 plots the change in estimated drive time in minutes to the current year's polling place relative to the previous polling place for each Election Day voting (Plot (a)) and early voting (Plot (b)). The hollow circles denote the binned average turnout by voting mode for every 2 minute interval of drive time change. The descriptive plots show only a small relationship between travel costs and voting, except at the extreme tails of travel time changes. This is perhaps due to the small size of most North Carolina precincts. The tails in Figure 4 indicate a lower likelihood of Election Day voting (and a higher likelihood of early voting) for those moved further from their polling place, while the reverse is true for those moved closer. This suggests that the decision to vote early in response may be conditioned by how close or far a polling place is moved.

Figure 4. Descriptive relationship between the change in driving time to polling place and type of voting: (a) Election Day voting, (b) early voting.
Notes: For voters experiencing a polling place change in either 2012 or 2016, the plots show how the change in drive time to the new polling place (closer < 0) relates to the percentage choosing to vote on Election Day (a) or early (b). Hollow circles are binned averages of the percentage for 2 minute intervals of drive time change sized relative to the bin's population. The dashed line is a local polynomial fit (bandwidth = 3). We exclude data not in the 99th percentile because of extreme outliers. Note that the y-axes are different.
These descriptive plots suggest minimal overall turnout effects as a consequence of polling place changes, in addition to only minimal turnout effects as a consequence of where polling places are moved relative to voters. To better identify the impact of polling place changes on turnout beyond these descriptive results requires controlling for factors associated with an individual's likelihood of voting and estimating the counterfactual of how those same voters would have behaved in the absence of a polling place change. Existing work seeks to identify the effect of polling place changes by matching voters based on observables (Brady and McNulty, Reference Brady and McNulty2011) or statistically controlling for observables (Amos et al., Reference Amos, Smith and Claire2017) to compare the behavior of voters who are and are not impacted by a polling place change. Comparing the turnout behavior of individuals who share observable demographic features is certainly reasonable, but it may produce misleading estimates if the groups differ in terms of unmeasured or unmeasurable characteristics.
We weaken the identification assumptions required by between-individual comparisons and estimate the counterfactual by leveraging our balanced panel to provide a within-individual comparison that is better able to account for all of the ways that individuals may differ in their propensity to vote, and to vote by a given mode. Thus, we track how polling place changes affect the behavior of the same voters over time, controlling for fixed individual-level differences that may affect the likelihood and method of voting. These fixed individual-level differences also control for stable-over-time differences in voting that may be caused by, or associated with, differences in neighborhood, precinct, or county. Therefore, our within-individual identification of the effect of polling place changes results from comparing how the turnout of an individual experiencing a polling place change varies relative to the turnout behavior of the same individual when they do not experience a polling place change.
Because we are also concerned that there may be time-varying factors that affect both the movement of polling places and the turnout behavior of voters, we leverage our large sample size to estimate a set of fixed effects interactions to account (as best as possible) for such confounders. Insofar as we think individuals of different races may have different trends in turnout and choice of mode of voting, we control for differential generalized trends in turnout by race. We are also able to control for differential trends by the fixed characteristics of counties that might impact both when and where polling places are moved and how voters cast their ballots (e.g., changes in the availability of county-level early voting). Together, these strategies help to alleviate concerns about time-varying omitted variable bias; in other words, bolstering the (inherently un-testable) parallel trends assumption. Results for our 2012 cross-section, in which we are able to estimate the relationship between future polling place changes and contemporaneous turnout (after accounting for past polling place changes and other covariates), further support a causal interpretation for the majority of our results—that is, that past turnout behavior does not predict future polling place changes in a way that would bias our results.Footnote 11 Finally, we might be concerned that polling place location changes are being conducted in a targeted and partisan manner (as work such as Amos et al. (Reference Amos, Smith and Claire2017) argue occurs). However, as previously noted, research by Clinton et al. (Reference Clinton, Eubank, Fresh and Shepherd2020) finds no evidence that polling place changes in North Carolina are correlated with voters’ party registration or race—suggesting that the data generating process for polling place changes is not strategically designed to influence turnout.
More formally, for voter i, in county c, during presidential election year t, we estimate the average effect of polling place changes on turnout using the following OLS specification:Footnote 12

where Pr(Vote i,t) is an indicator for whether a vote is cast, ΔPollingPlace i,t is an indicator equal to 1 if voters experienced a change in the location of their polling place from the previous presidential election year, ΔMuchFurther i,t is an indicator equal to 1 if a voter's polling place was moved more than 5 minutes drive time further from them, and ΔMuchCloser i,t is an indicator equal to 1 if a voter's polling place was moved more than 5 minutes closer to them (the residual category contains voters whose polling place is moved less than 5 minutes closer or further; that is, voters with a small change in drive time, either positive or negative). Conditional on a polling place change, a 5 minute change in travel time is approximately equal to two standard deviations of the travel time variation. Thus, this measurement strategy allows us to effectively compare “standard changes” to extreme changes in a straightforwardly interpretable way.Footnote 13 Note that because we are comparing presidential elections, every voter in every precinct has the same top-of-the-ticket race in each election. Racei is a vector of race indicators which we interact with year indicators to account for differential turnout trends over time amongst different races, Countyc is a vector of county indicators, which we interact with year indicators (Yeart) to account for differential turnout trends by county that may result from population changes or early voting changes, αi are individual fixed effects that capture level differences in the probability of voting for each individual in our sample, and γt are year fixed effects that account for common shocks to individuals by year. Although we have data on past voting behavior, but we do not included lagged dependent variables as doing so introduces Nickell bias (Nickell, Reference Nickell1981) in panels with individual fixed effects when the N dimension of the panel is substantially larger than the T dimension. Finally, εi,t is the idiosyncratic error term. We (robustly) cluster our standard errors by shared precinct assignment histories to account for serial correlation and the hetereoskedasticity of errors in a linear probability model. Because precincts change over time, we cluster by a common history of precinct assignments.
The coefficient β estimates the general marginal impact of a polling place change, while δ and λ are the additional impacts of a significant decrease (δ) or increase (λ) in travel time. Of primary interest is the relative impact of a change of any kind (β)—costs that represent the net impact of search costs, confusion, habit disruption and any priming effects—versus travel costs (δ,λ). Because the average marginal effect of a polling place change regardless of travel time is also an important quantity of interest, we also estimate Equation 1 without the travel time indicators (i.e., excluding MuchFurther and MuchCloser). This effect constitutes the population-weighted average impact of a polling place change.
Existing work suggests that voters may respond to increased costs to one method of voting by switching their mode of voting (Michelson et al., Reference Michelson, Malhotra, Healy, Green, Carnegie and Valenzuela2012). Therefore, we not only estimate the effect of whether a voter voted, but also how they cast their ballot. To do so, we estimate Equation 1 separately for the following outcomes: whether the voter voted on Election Day (Pr(VoteElecDay)), whether the voter voted early (Pr(VoteEarly)), and whether they voted at all regardless of method (Pr(VoteAny)).
Our results are presented in Table 1. We find that polling place changes decrease Election Day turnout for our balanced sample of non-movers. Indeed the average effect is to reduce Election Day turnout by − 0.7 percentage points (column 1). In addition, this is due in part to the polling place change per se, and in part due to changes in travel costs—being moved further from one's polling place depresses Election Day turnout by approximately − 3.1 percentage points more than a voter who experiences a drive time change of less than 5 minutes—but the effects are not symmetric. Polling places that are moved significantly closer increase Election Day turnout, but by a much smaller amount ($\hat {\lambda }$ ).Footnote 14 The finding that polling place changes decrease Election Day voting—especially for polling place changes that are moved more than 5 minutes away—is consistent with prior findings, albeit for our longer panel, and larger sample of voters across an entire state.
Table 1. The average effect of polling place changes and drive time on voter turnout

Standard errors clustered by precinct assignment history.
* p < 0.1, ** p < 0.05, *** p < 0.01
Notes: The table presents coefficients from estimating Equation 1 with and without the travel time indicators. The unit of analysis is the voter-election. See Table C1 in Supplementary Appendix C for the coefficient estimates. The SD of the DV is the average of the within-i standard deviations of the outcome variable. Pr(VoteAny) includes non-in-person modes of voting, like mail-in voting, and thus the mean of the VoteElecDay and VoteEarly do not sum to the mean of VoteAny. The residual category for MuchCloser and MuchFurther are voters whose polling place is moved less than 5 minutes drive either closer or further. “Full panel” refers to panel regressions estimated on our balanced panel of voters.
Table 1 also reveals a more novel and striking finding—the negative effects of a polling place chance on Election Day voting are nearly entirely offset by substitution into early voting. On average, polling place changes increase early voting by 0.6 percentage points (column 3). Moreover, voters who are moved much further from their polling place are 2.7 percentage points more likely to vote early relative to those who remain relatively close by, but voters are no more or less likely to vote early if their polling place is moved much closer. Columns 5 and 6 confirm that these effects are nearly completely offsetting—the decrease in Election Day voting and the increase in early voting combine to produce less than a half-percentage point point overall change in turnout.
Overall, the results suggest that polling place changes do not decrease overall turnout—even those changes that greatly increase travel costs—but they do lead voters to change how they vote. At least in the high-stakes presidential election contests we examine, voters respond to an increase in the costs of voting on Election Day by casting their vote early. Moreover, although all voters are more likely to vote early in response to a polling place change, the substitution effects are nearly three times larger for voters whose polling places are moved more than 5 minutes further away from their residence. Because most polling place changes result in travel time changes of less than 5 minutes, however, it is the disruptive impact of a change per se that is most responsible for changes in voter behavior (as evidenced by the similar magnitudes of the estimates of $\hat {\beta }$ in Table 1).
One explanation for these results is substitution between modes of voting—voters who would have voted on Election Day, instead decided to vote early when their polling place was changed. However, it is alternately possible that polling place changes induce a population of non-voters to vote early—potentially because the mailers inform them of a polling place change and prime them to turnout—and a distinct (but coincidentally equal sized) population of Election Day voters failed to vote on election day. As discussed in detail in Supplementary Appendix F, additional analyses suggest that our results are primarily driven by substitution—the increase in early voting occurs among those who otherwise would have voted on Election Day absent the polling place change. As the counterfactual intention of voters is unobservable, however, these results can only be suggestive.
Finally, we probe these relationships in more detail to determine whether the substitution effects we identify vary depending on characteristics that are plausibly related to voters’ ability to overcome the costs created by polling place changes. We focus on four characteristics: (1) the availability of early voting, and thus the ease of substituting to early voting; (2) the race of affected voters, which might be related to the resources that voters have to overcome costs associated with polling place changes and/or the desire of voters that have been historically disenfranchised to overcome increased costs of voting; (3) the income of voters; and (4) the age of voters given that habits are more likely to form for older voters.
We do not find that the county-level substitution effects we estimate correlate meaningfully with early voting availability in either 2012 or 2016. We find that non-white voters are less likely to substitute between Election Day voting and early voting when their polling place changes. But, overall we do not find statistically significant evidence that there is an overall turnout effect for non-white voters that differs from white voters. Nor do we find important heterogeneity by income, reflecting the idea that resources are not a critical driver of our results. Finally, we find minimal evidence that different age groups are differently affected by changes. Our results are described in extensive detail in Supplementary Appendices H-K.
4. Effects of polling place changes by county
In this section, we investigate the extent to which the average state-wide effects we estimate in the previous section hide county-level heterogeneity. To be clear, because we leverage within-voter variation, the average statewide effects we identify are crucially not a function of county-level differences in the propensity to vote, or vote by a particular mode. Even so, characterizing the county-level variation in the effects of polling place changes is important for situating our statewide estimates vis-a-vis the results of prior studies based on changes in a single locality. Insofar as there is considerable between-county variation in the effects of polling place changes occurring within the same state and election, it is difficult to generalize such “local” estimates. The difficulty of generalizing impacts not only our ability, as a discipline, to identify the mechanisms of impact, but also the ability to predict how the effects of polling place changes might affect election outcomes by affecting turnout.
To estimate the county-level effects of polling place changes on turnout, we use Equation 1 to separately estimate the effects of a polling place change for the subset of our voter-level panel residing in each county.Footnote 15 To summarize the results, Figure 5 plots the county-specific coefficient estimates ($\hat {\beta }$ ) that identify the effect of a polling place change on Election Day voting. Bars around each estimate show the naive 95 percent confidence interval, while estimates in red marked with solid diamonds are also statistically significant after a multi-test correction to keep the False Discovery Rate below 5 percent using a Benjamini et al. (Reference Benjamini, Krieger and Yekutieli2006) two-step multi-test correction. (Supplementary Appendix E reports the estimated effects for early voting (Figure E2).) Our null hypothesis remains $H_{0}\colon \hat {\beta } = 0$
 because our interest in is whether the analysis of any given individual county could provide evidence that polling place changes decrease (or even increase) turnout or result in statistically significant substitution between voting modes, not whether counties differ from the average effect we calculated before (to which any given county contributed variation).
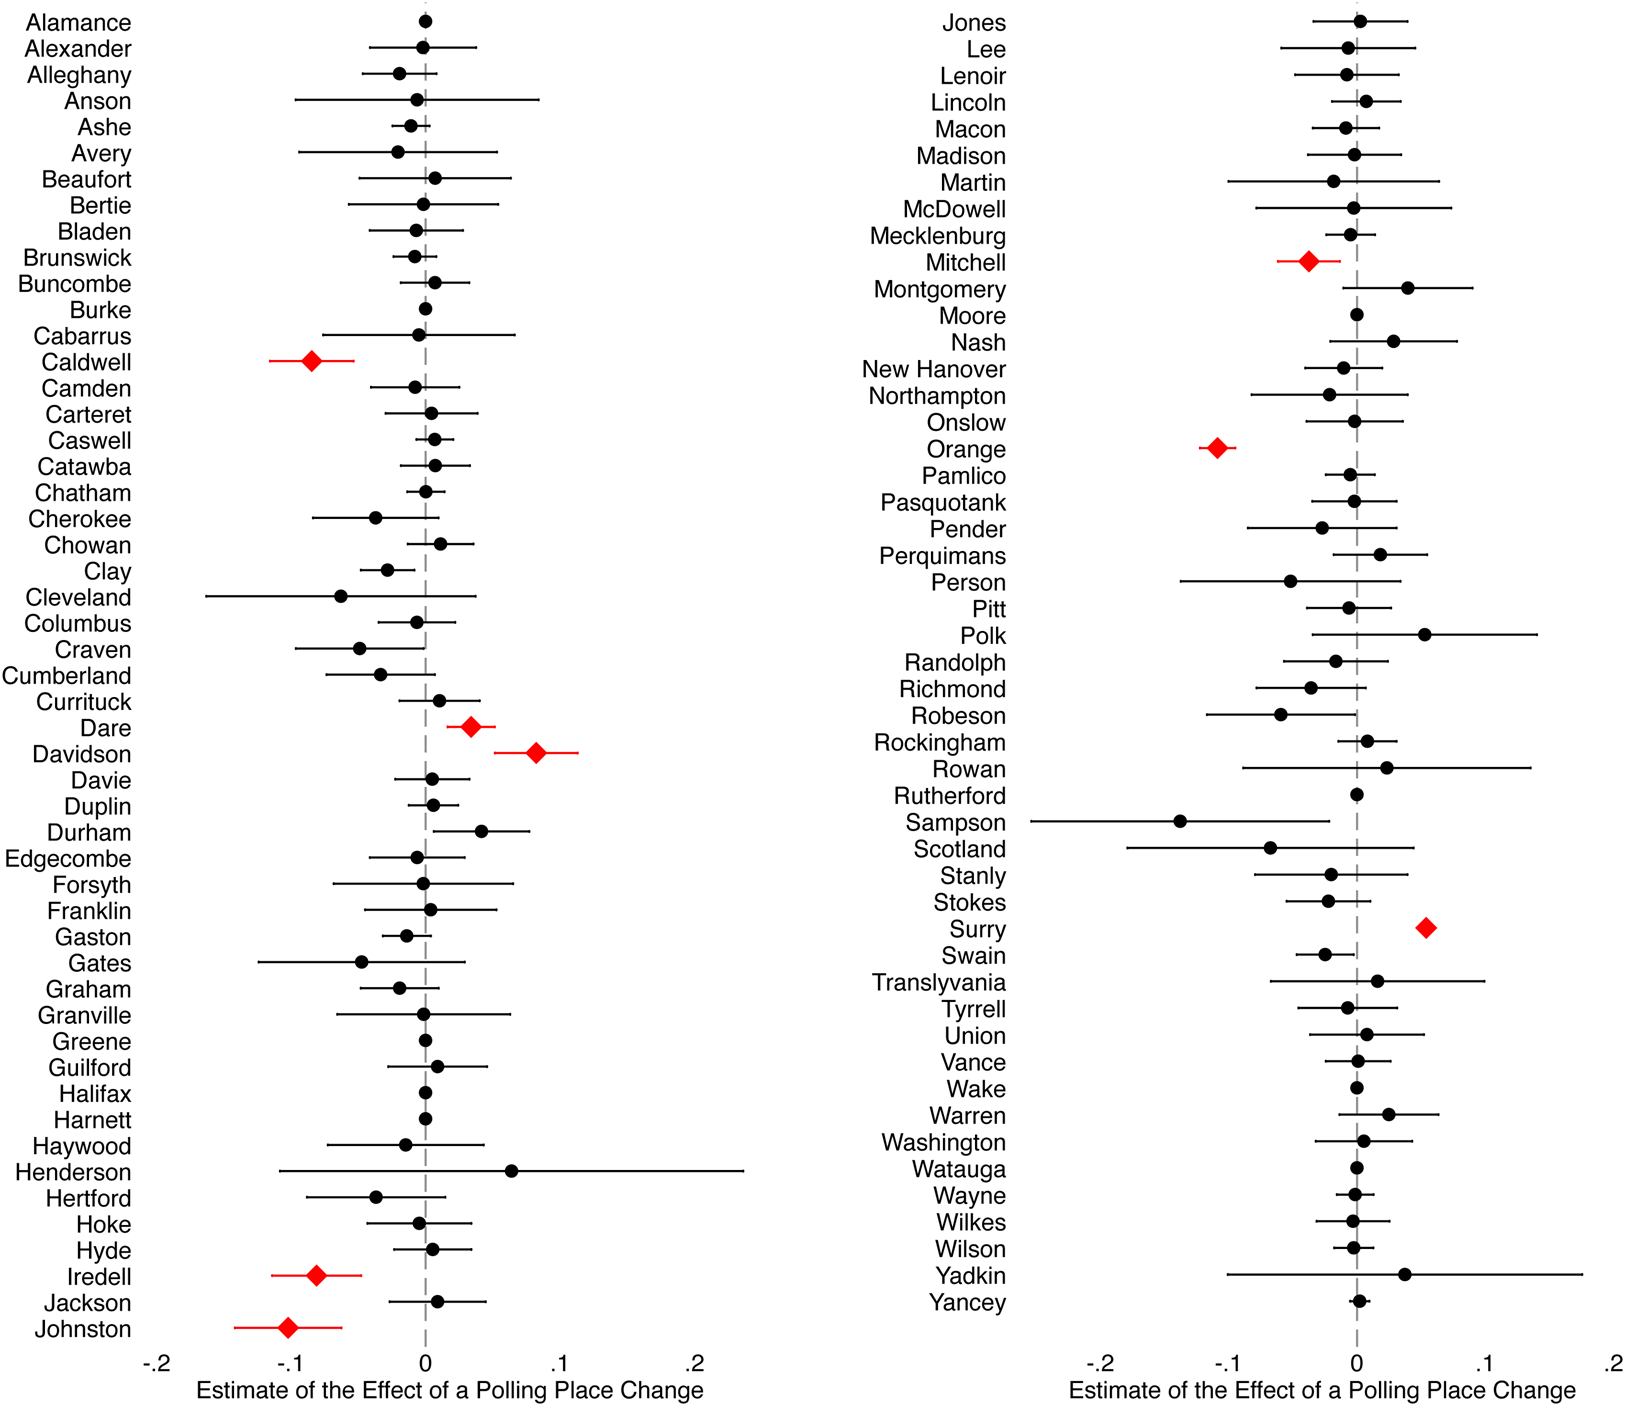
Figure 5. County-specific estimates of the effect of a polling place change on Election Day voting.
Notes: The above plot presents estimates of Equation 1 separately for each county with 95 percent confidence intervals. The outcome is Pr(VoteElecDay). Solid diamonds are statistically significant after applying the Benjamini et al. (Reference Benjamini, Krieger and Yekutieli2006) multiple test correction with a false discovery rate limit of 0.05. Some county estimates cannot be estimated because no precincts in those counties experienced a polling place change.
Figure 5 reveals substantial heterogeneity in the estimated effect of a polling place change between counties when using the conventional levels of statistical significance that would be employed when studying the effects in an individual county. In fact, we recover estimates of the effect of a polling place change on Election Day voting that vary in direction, magnitude and statistical significance. For example, polling place changes in Sampson county were estimated to decrease the probability of a voter casting an Election Day vote by nearly 15 percent, but the changes made in Polk county were estimated to increase the probability of voting on Election Day by nearly 5 percent. Insofar as data limitations have forced existing work to estimate the impact of polling place changes using limited geographies, the variation we document highlights the difficulty of generalizing to the state-wide level from a specific, or set of specific, localities.
Figure 6 plots the county-level coefficient estimate ($\hat {\beta }$ ) of the effect of a polling place change on overall turnout regardless of method (i.e., the net effect of Election Day and early voting). (For space, we include the early voting figures in Supplementary Appendix E). The figure shows that after employing multi-test corrections to account for the fact that we are essentially performing multiple hypothesis tests, we find only four counties where effects on turnout are statistically different from zero (two with positive effects and two with negative effects). In contrast, the results in ten additional counties would suggest that there are statistically significant effects on turnout if we relied on conventional (naive) p-values when analyzing individual counties—including Richmond, one of most populous counties in North Carolina. As a consequence, where the findings of a selected single county generalized, one could potentially conclude that polling place changes have a radical impact on turnout whereas a more systematic analysis does not.

Figure 6. County-specific estimates of the effect of a polling place change on overall voter turnout.
Notes: The above plot presents estimates of Equation 1 for each county individually along with 95 percent confidence intervals. The outcome is Pr(VoteAny). Solid diamonds are statistically significant after applying the Benjamini et al. (Reference Benjamini, Krieger and Yekutieli2006) multiple test correction with a false discovery rate limit of 0.05. Some county estimates cannot be estimated because no precincts in those counties experienced a polling place change.
5. Discussion
The ability to cast a ballot is fundamental to the legitimacy and functioning of democratic governments. But governments can impact the ability of voters to participate in elections in ways that go beyond formal restrictions on the franchise. In this paper, we examine how voters respond to changes in the location of their Election Day polling place across the entire swing-state of North Carolina. To do so, we collect data on every registered voter and we geolocate them relative to the location of nearly every Election Day polling place over three presidential election cycles (2008–2016).
Leveraging the within-voter variation provided by our panel of 2 million registered voters,Footnote 16 we show that polling place changes decrease the probability of voters turning out on Election Day, but that those effects are nearly entirely offset by an increase in early voting. Voters are indeed affected by the costs of polling place changes, but surprisingly these costs do not, on average, deter voters from casting a ballot. In fact, our results show that, on average, voters respond to a polling place change by substituting between modes of voting. A variety of fixed effects and fixed effect interactions afforded by our panel and large sample of voters assure us that our results are not the consequence of—among other specific confounders—the individual propensity to vote by a particular mode, county-level trends in election administration policies, nor differential state trends in the mode of voting amongst particular races.
Our results are perhaps surprising given our strong theoretical priors about how voters react to costly changes in their ability to cast a ballot. But substitution between modes of voting, albeit only partial, is found by other important work on polling place changes (Brady and McNulty, Reference Brady and McNulty2011). Other work has also found that voters substitute between modes of voting even when they face a reduction in costs (e.g., stamps for absentee ballots) if they are sufficiently motivated to turnout and concerned that their vote may not count (Meredith and Malhotra, Reference Meredith and Malhotra2011). We reason that the high-stakes competitive presidential elections that we study may be precisely those where voters are the most motivated to overcome costs (Kousser and Mullin, Reference Kousser and Mullin2007), as compared to lower salience elections considered in the literature. These types of elections are also those that might induce counter-mobilization efforts to counteract the costs of polling place changes (Fraga and Hersh, Reference Fraga and Hersh2010). Therefore, we might expect our results to most plausibly generalize to similar high-stakes cases, while turnout may fall off in contexts where elections are less salient, lower stakes, and voters are less aware of their voting options. This may help explain the difference between our results and those of Brady and McNulty (Reference Brady and McNulty2011).
Another key but not unique feature of the North Carolina electoral landscape is that voters affected by a polling place change are notified of the change. This notification provides them with information about the location of their new polling place and websites where voters can access additional information about early voting. It therefore seems plausible that the informational mailer could offset search and confusion costs both with regard to the Election Day poll, as well as the availability of early voting. If voters are already motivated to participate because of the stakes of the election contests that we examine, this additional information may be entirely sufficient to counteract costs. Furthermore, if voters are motivated to vote and they worry about the risks associated with voting at a new polling place, voters may choose to vote early rather than wait until Election Day.
The notification may also remind affected voters to vote. A vast literature on get-out-the-vote activities has shown the even simple reminders to vote can be powerful for increasing turnout (Gerber and Green, Reference Gerber and Green2000). The magnitude of the substitution we find aligns extremely well with existing estimates of the impact of informational mailers. Gerber and Green (Reference Gerber and Green2000) estimate a one half of one percentage point increase in turnout as a consequence of receiving a mailer, whereas we estimate a 0.6 increase in early voting—effectively our substitution effect.
To be clear, our results do not indicate that polling place changes are not costly for voters. When we consider the number of voters affected, at least 16 percent of the 2 million voters we examine were subject to increased search costs, confusion, habit disruption and changes in their drive time. Polling place changes are unequivocally confusing even when offset by substantial information about the location of the new polling place. And many voters will face increased travel costs to visit their new poll. What our results do suggest, however, is that the availability of other modes of voting and official notifications may be enough to induce voters to overcome the costs they face in the context of highly-salient and highly-competitive elections.
Moreover, our results also do not eliminate the possibility that there were some important and consequential effects at the county level. Our county-level estimates reveal considerable variation in the estimated effects using standard tests of statistical significance. Correcting for the problem of multiple comparisons, we observe only a handful of counties where we can reject the null hypothesis of no relationship. Nevertheless, while we are confident that there are no net effects on average, conclusions about the impacts in particular counties are less certain and could be studied further.
Although scholars have previously argued that early voting may decrease overall turnout (Meredith and Malhotra, Reference Meredith and Malhotra2011; Burden et al., Reference Burden, Canon, Mayer and Moynihan2014b), our findings suggest that variation in early voting does not explain county-level variation in North Carolina. However, the simple existence of a mode of voting besides Election Day may nonetheless play a crucial role in reducing the impact of polling place changes that remains to be tested. We would expect the lack of any early voting options to reduce turnout among voters affected by a change in polling place location. In turn, we would expect that the presence of early voting would provide voters impacted by a polling place change with the time (and incentive) to vote prior to Election Day.
Given this, our paper raises several important questions for further research. First and foremost, research that leverages variation in voter notifications of polling place changes would be invaluable in more precisely identifying the cause of the substitution that we hypothesize may be due to information and priming. Second, while our research clearly documents that non-white voters are substantially less responsive to polling place changes than white voters, additional research is needed to say why this may be the case. But while work remains to investigate the precise mechanisms by which this substitution occurs—and therefore the conditions under which polling place changes do or do not decrease turnout—the causal effects we identify provides a uniquely comprehensive and essential start for these important future efforts.
Supplementary material
The supplementary material for this article can be found at https://doi.org/10.1017/psrm.2020.43.


