


1. Introduction
Political culture has been described as one of the few “mega-concepts” in the social sciences.Footnote 1 Huntington (Reference Huntington1996) famously advocated for the perspective that the world should be viewed as being divided into cultural “blocs” where regional and religious identity translate into a common civilizational cultures. Quantitative studies of political culture have explored “national” cultures (e.g., Almond and Verba, Reference Almond and Verba1965; Inglehart, Reference Inglehart1997; Schwartz, Reference Schwartz1999), the diversity of cultural perspectives within countries (Silver and Dowley, Reference Silver and Dowley2000), and the relationship between cultural values and ethnicity (Desmet et al., Reference Desmet, Ortuno-Ortin and Wacziarg1987). Yet political scientists continue to struggle with how to define and operationalize political culture even if there is a widespread understanding that the beliefs and practices that characterize groups are an ever-present aspect of social and political interactions.
Wildavsky (Reference Wildavsky1987, 3) defines political culture as “shared values legitimating social relations.” This definition emphasizes value consensus and the existence of core belief clusters. Scholars working in this tradition typically employ the results of large-scale public opinion polls to examine cross-national variation in stated belief patterns. We adopt a working definition of political culture that focuses on aggregation of stated beliefs—as measured in public opinion surveys—as one manifestation of culture. There is no doubt that this approach leads to costly reductionism. What is lost in stripping away some of the conceptual complexity associated with “political culture” is gained in ease of operationalization and clarity of interpretation.
Our empirical strategy allows for the measurement of value consensus both within and across countries. We show—using data for 57 countries from a recent wave of the World Values Survey—there is a strong case in favor of the existence of a single national culture for only a minority subset of countries. The majority of countries in the sample exhibit meaningful heterogeneity in political culture. We also find that there are seven basic cultural types that emerge globally and these types map only loosely onto existing conceptualizations of regional and religiously-based cultural variation.
2. Model
Researchers' desire to map political culture across large swathes of time and space have favored analysis of worldwide public opinion polls which have queried citizens across regions about their beliefs, values, and preferences. While it is not possible to interpret and contextualize symbolic expressions in their full ethnographic context with this approach, the possibility of exploring a broad, comparative perspective on one dimension of political culture—shared social values—is valuable and does not preclude alterative conceptualizations of political culture.
We consider stated beliefs as one manifestation of political culture and model belief clusters using a Bayesian hierarchical model. At the bottom of the hierarchy are individuals, each of whom resides in a country. We suppose that each respondent belongs to a single political subculture. We define a political subculture as a profile of similar expressed values across the questions included in our model. We assume these subcultures are shared across countries and each country can be represented by a mixture of the various global subcultures. A number of different processes might lead to the existence of multiple subcultures within a state—the existence of distinct, ethnolinguistic, or religious groups; geographic separation between parts of the country; or patterns of diaspora, immigration, and trade contributing to the existence of subcultures.
At the top of the hierarchy are a set of countries—each of which is modeled as a mixture of the political subcultures. Substantively, this allows us to capture the heterogeneity in expressed views within a country. Sharing subcultures across countries allows us to provide a middle ground in a controversy on the methodology of measuring culture in survey responses. Inglehart (Reference Inglehart1997) measures a single political culture in each country. Seligson (Reference Seligson2002) responds, arguing that such an approach discards individual-level responses unnecessarily, ignoring within-country variation. Our statistical model accommodates both perspectives. Like Inglehart (Reference Inglehart1997), we produce estimates at the country level. Like Seligson (Reference Seligson2002), we retain interesting heterogeneity within each country. We provide the technical details of the model in Section 3.Footnote 2
Our model uses a wide array of questions to measure the mixture of expressed political culture in each country. We explicitly exclude questions related to political ideology from the question battery and focus on the set of categories described by Elkins and Simeon (Reference Elkins and Simeon1979, 132) as fruitful areas for distinguishing across political cultures including, but not limited to, assumptions about the orderliness of the universe and the nature of causality (i.e., are human agents impactful or are events random), how people define their communities, and the assumptions they hold about others. Our question battery also includes items on the most important values to inculcate in children, the extent to which respondents have high or low levels of trust in others, questions about the role of women in society, and items about national priorities.
3. Data generating process
We begin with a set of N countries (i = 1, …, N = 57) surveyed in a recent wave of the World Values Survey. Within each country, i there are N i individuals, (j = 1, …, N i). For each respondent j, in each country i, we assume there are R i questions asked (r = 1, …, R i). For each question we assume there are Q r potential responses (q = 1, …, Q r)-including a category for a “don't know” response. For each question r, for each respondent j, for each country j, we observe response y ijr—the option the respondent selected for the particular question. So, for example, if y ijr = q, then the respondent chose the qth option available. For all respondents, we observe a vector of responses ${\bi Y}_{ij} = (y_{ij1}, y_{ij2}, \ldots, y_{ijR_i}$ .
.
We assume that there are K subcultures k = 1, …, K, and the proportion of individuals in country i from subculture k is given by πik. Collecting across all k groups, we have,

We suppose that each respondent belongs to only one subculture, which is indicated by τij, an indicator vector. Because each respondent belongs to a single subculture, it follows that τij is a draw from a multinomial distribution,

Notice that πi stochastically controls the distribution of types within each country.
Given an individual's subculture, we draw her response to each question. Suppose that the j th individual in the ith country belongs to the kth subculture (or that τijk = 1). We will suppose that each response is a draw from a subculture-specific multinomial distribution. That is, each subculture is characterized by a particular distribution over responses to each question. So, for question r, we assume that the response, y ijr, is a draw from a multinomial distribution, with rate parameter ${\bi \theta }_{kr} = (\theta _{kr1}, \theta _{kr2}, \ldots, \theta _{krQ_{r}})$ ,
,

We assume that the responses are independent, given an individual's subculture and the subculture-specific distribution over the responses to each question θkr. So the density of the response distribution is given by,

To complete the model, we suppose that each country's distribution of subcultures is drawn from a common Dirichlet distribution,

where α = (α1, α2, …, αK) is a vector of shape parameters for the Dirichlet distribution.Footnote 3
We estimate our model using a variational approximation—a fast, deterministic method for estimating full posteriors in Bayesian models. A problem in the application of mixture models is determining the number of clusters to include. Too many components and we overfit the data, while too few leaves interesting variation unmodeled. We employ tenfold cross-validation (Hastie et al., Reference Hastie, Tibshirani and Friedman2001) using an average “held-out” predicted probability to evaluate the models.
Applying this cross-validation standard to our data suggests seven types provide the best balance of fit. Our focus on predicted probability implies that our cross-validation statistic will be similar to model-based evaluation criteria, such as the Bayesian and Akaike Information Criteria (Fraley and Raftery, Reference Fraley and Raftery2007) or to nonparametric approaches to Bayesian inference (Reference Wallach, Dicker, Jensen and HellerWallach et al., Reference Wallach, Dicker, Jensen and Heller2010).
4. Results
Our results suggest that certain universal values are shared by the majority of respondents across countries and cultures. Respondents almost universally agree that family is important and seek a greater emphasis on family in their lives. Although cultures differ in their tolerance for certain “undesirable” types, very few people in the global sample find it acceptable to be neighbors with drug addicts or heavy drinkers. Finally, respondents agree that they need to set their own goals in life and that it is more important to be oneself than to follow others.
Beyond these three areas of value consensus, it is possible to break down cultural groups into seven broad types (Figure 1). Our descriptions of the types focus on those responses patterns, or cultural characteristics, that serve to differentiate one type from another.Footnote 4
(1) This is the modal citizen type in Germany and Russia and one of two comparably-sized modes in Japan. Past experience with costly foreign wars—and associated reluctance to fight for country—differentiate this group. Category 1 types do not care much about leisure time relative to other groups and are not particularly concerned with having a good time; they do not tend to think that politics matters much; they value hardwork in children more than other types; they want jobs for citizens; and they tend to be somewhat less bullish regarding technological advance compared to other types. Although this group exhibits some of the characteristics of what might be described as “postmaterialism,” respondents in category 1 place more emphasis on hardwork and less emphasis on leisure than postmaterialism generally entails.
(2) A large percentage of respondents in the Latin America countries of Chile, Brazil, Peru, Mexico, Argentina, Colombia, and Uruguay fall into category 2. There are also significant numbers of category 2 respondents in the United States, Canada, Britain, South Africa, and Cyprus. Category 2 respondents tend to care deeply about religion yet exhibit a tolerance toward others (e.g., they are nonplussed by an unmarried couple living next door and more tolerant than others toward neighbors with HIV/AIDS). Category 2 respondents care a great deal about work, believe that hardwork is very important, and are highly interested in both employment and expanding exposure to new technologies. Category 2 respondents also exhibit a very high level of respect for authority.
(3) Category 3 is the modal category for three of the four Arab countries in the sample. Category 3 also makes up a significant percentage of respondents in Morocco, Ghana, and Georgia. Category 3 respondents are distinctive from other categories on a number of dimensions. They tend to care a great deal about religion and believe that faith is important, even for children; they also tend to believe in the importance of charity. Category 3 respondents believe that children should be obedient and believe that it is important to behave properly; they also indicate a high level of respect for authority. Category 3 respondents care tremendously about personal safety and safe surroundings. They also tend to be more discriminatory than the other categories regarding who would make an acceptable neighbor. Category 3 respondents are very concerned about jobs and employment, believing that work and success are both very important; they consider it humiliating to receive money without doing a job, believe that work is a duty to society and that people who do not work will become lazy. Category 3 respondents are distinctive for their misogynistic responses relative to other categories, believing that jobs should be reserved for men, being a housewife is fulfilling, men make better political leaders and so on. Category 3 respondents are uncritically positive toward science, technology, and competition.
(4) There are at least three possible interpretations for respondents who fall into category 4—typically the smallest of the types in any given country (though a significant number of respondents in India). These individuals tend to respond “don't know” at much higher rates than respondents in other categories. They appear reluctant to offer their thoughts either because (a) they lack political knowledge and prefer not to offer an uninformed response, (b) they are introspective and/or are not comfortable with the face-to-face survey setting or (c) they do not care to answer the questions they are being asked and are “opting out” of the process. Indeed, category 4 respondents are most likely to be judged by the interviewer to be not paying attention. This suggests that there may be classes of individuals for whom surveys fail to capture preferences. We include category 4 as a small—but separate—cultural type since we cannot distinguish between possibilities a and c—which suggest the limits of surveys for collecting information about preferences—and possibility b—which may tell us something about cultural type.
(5) Category 5 respondents represent overwhelming majorities in countries like Hong Kong and Thailand and are well represented in a number of other East Asian societies (although conspicuously, less so in China). This is also the modal category in Serbia and Ethiopia. Category 5 respondents are also found in significant numbers in the United States. Category 5 respondents care less about religious faith in children. While many respondents around the world agreed strongly that it was important to “be oneself” this was less so the case for category 5 respondents. Category 5 respondents are less likely to say that helping others is important to them; on average, they care less about the environment.
(6) Category 6 respondents are the modal respondent type in Indonesia, Iran and Turkey but also common in Georgia, Rwanda, Ghana, and Vietnam. Respondents in this category are the most willing to fight in wars and are less misogynistic than respondents in category 3, though they are similar on a number of other dimensions in that they believe that work and technology are important, care about maintaining order, and are not pleased with neighbors who are gay, from other religions, people with AIDS, and unmarried couples. Category 6 respondent also believe strongly that children should be hardworking.
(7) Respondents in category 7 are the only type who overwhelmingly value independent children and believe that a child's imagination is important. Tolerance is highly important to category 7 respondents. Friends are also considered to be very important. Authority is not emphasized but protecting the environment is emphasized. Category 7 respondents tend to care more about the importance of the work they are doing and less about money and job security when compared to respondents in the rest of the world. Category 7 respondents care less than their global counterparts about material things, suggesting with group may be picking up on Inglehart's description of respondents with “postmaterialist” values. Representative countries for this category include the Scandinavian countries, New Zealand as well as sizable populations within the United States, France, Britain, and Germany.

Figure 1. Mixture of types across countries. Countries ordered by declining cultural heterogeneity.
In some countries, there is a great deal of homogeneity over type (Figure 2). Citizens of Hong Kong are almost universally category 5 respondents; Swedes fall predominantly into category 7; Iraqis are almost universally category 3. Latin American countries tend to be homogeneously with large percentages of their citizens identifying to category 2. At the other end of the spectrum, countries of Eastern and Southeastern Europe, Africa, and some the world's largest states—Russia, China, and India—all exhibit high levels of cultural fractionalization.
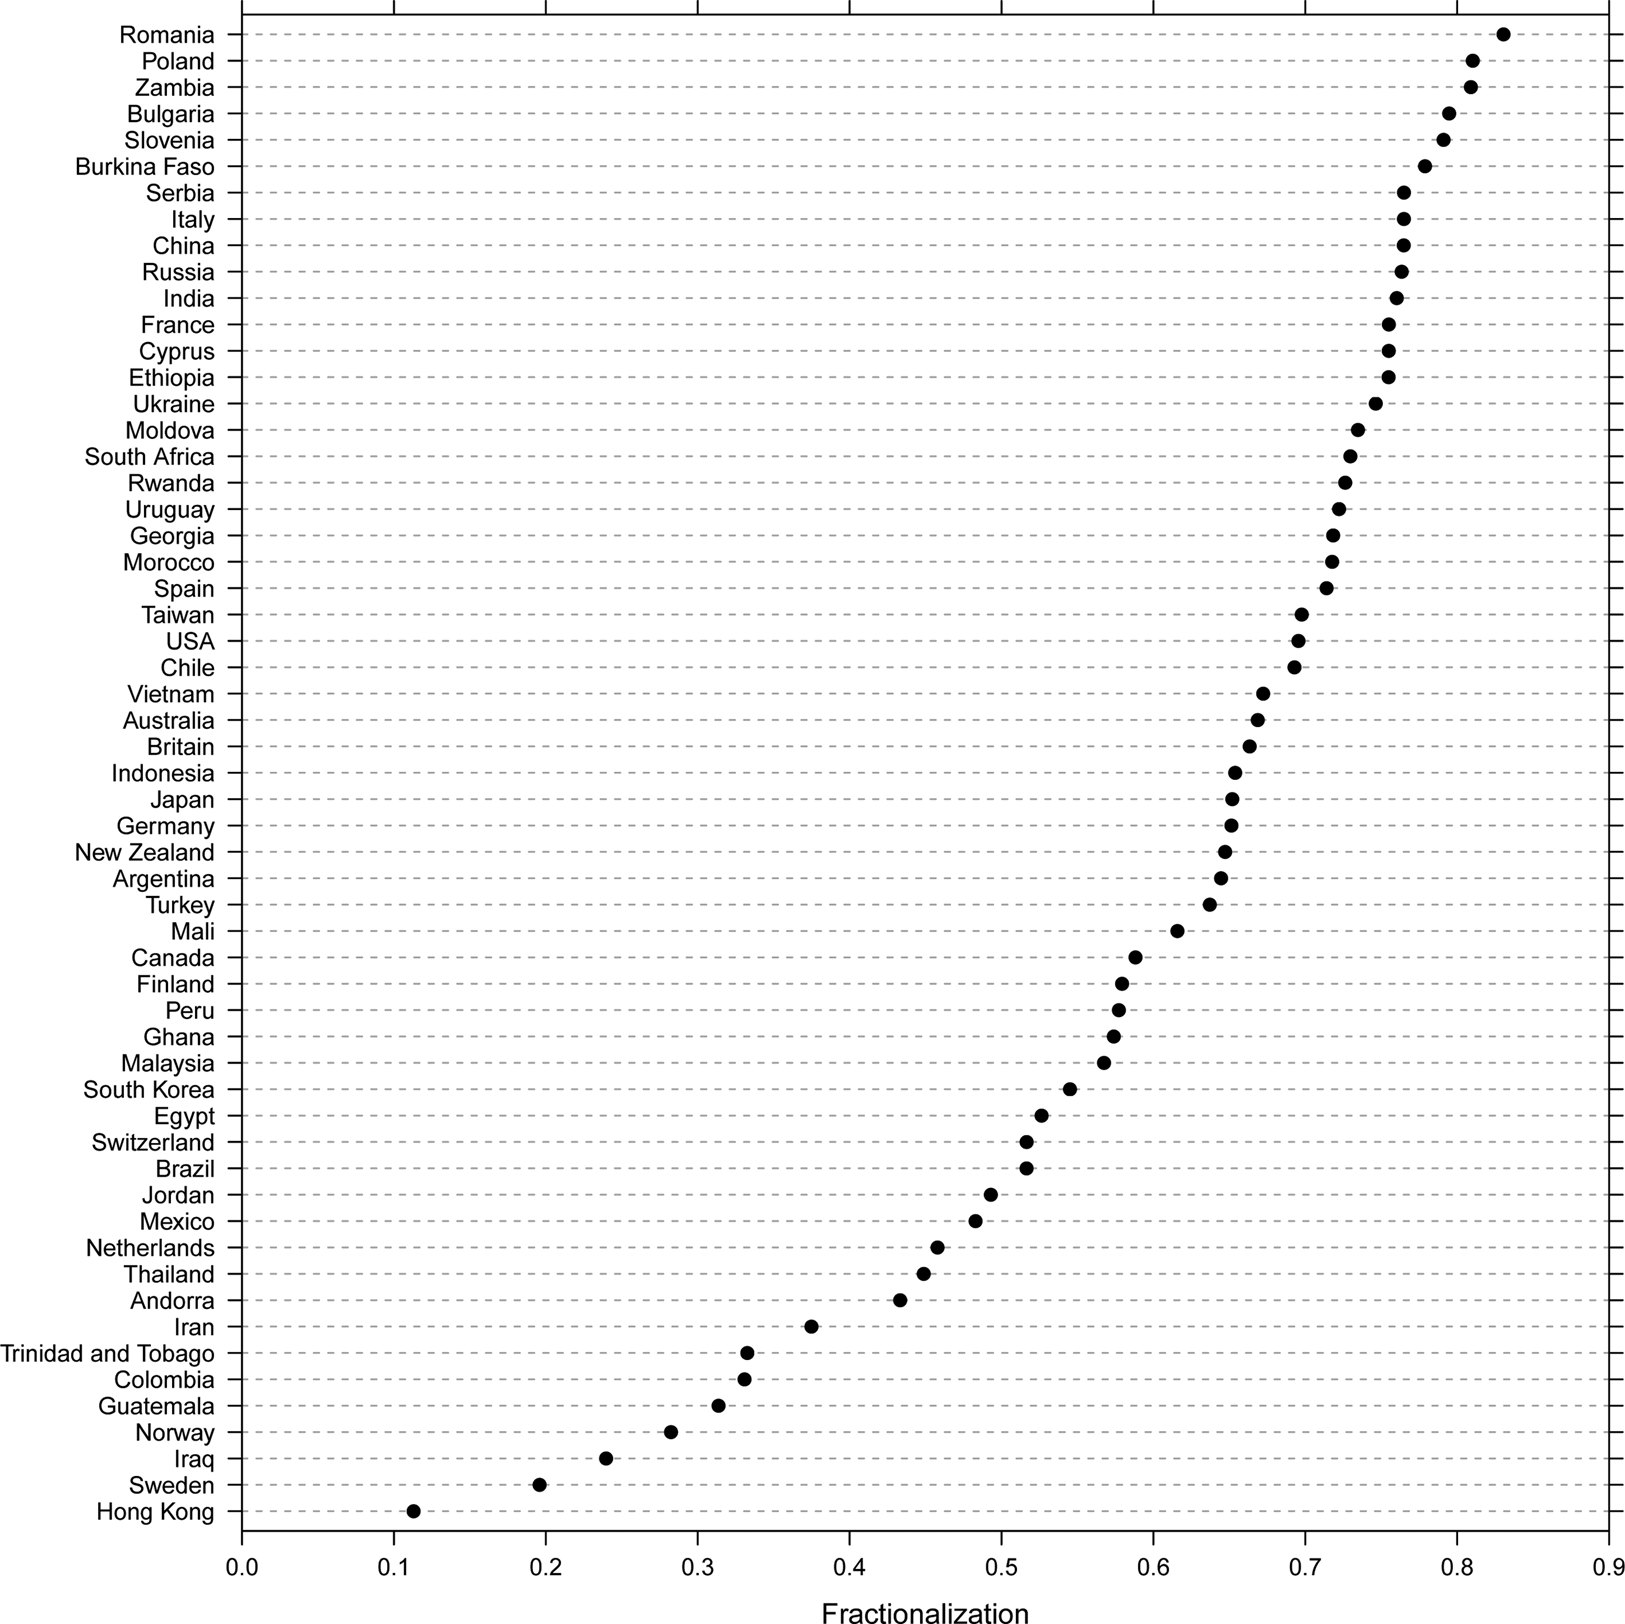
Figure 2. Cultural fractionalization across countries. Fractionalization is one minus the probability that any two randomly selected individuals are from the same subculture. That is fractionalization is for any two individuals i and $\tilde {i}$ from the same country, $1-{\rm Pr}(\tau _{ij} = \tau \;_{\tilde {i}j})$
 . Higher values represent more fractionalized countries.
It is also worth considering to what extent these groups are similar to each other. In other words, if two types are close (i.e., more similar in terms of values and beliefs), how does this translate into measures of fractionalization? A first step in addressing this issue involves assessing the relative “distance” between cultural types.
Figure 3 is a matrix expressing the cultural difference across categories. Darker squares indicate greater difference between two categories. Category 4 is quite dissimilar to all other categories. It is also important to note that category 3—the most common cluster for Arab respondents—differs considerably from category 7—the postmaterialists commonly found in Western Europe—but is relatively similar to category 6—the most common category for Muslim-majority countries like Indonesia, Iran, and Turkey. Categories 2 and 6 appear to share important similarities. Category 7 is mostly like 2 and 5. Categories 3 and 5 are also quite dissimilar.

Figure 3. Cultural distance across types. Darker colors suggest more divergent cultural values
5. Applications
The measure of cultural heterogeneity that we have developed might be useful in a variety of empirical applications. In this section, we consider two possible applications in the field of comparative politics.
5.1. Examining the development-conflict nexus
In his presidential address to the meetings of the European Economic Association in 2007, Guido Tabellini argued that norms of conduct, or culture, might provide the “missing link” in our understanding of how history impacts institutions and, subsequently, economic development (Tabellini, Reference Tabellini2008). Ethnic diversity is considered to be among the most important variables used to explain outcomes including a country's economic growth rate, the level of public goods provision, prospects for democratic transition, and the likelihood of civil war.
Although we are wary about attributing any causal effect to culture as a predictor for these outcomes, a country's level of cultural diversity may influence a variety of dependent variables of interest. Of particular interest may be the empirical link between economic underdevelopment and civil conflict. Our measure of cultural heterogeneity may be a root cause of both economic outcomes and political violence, a conjecture which could be tested using the data we have developed. It is also possible to consider the extent to which past civil strife has homogenized a country or region's cultural values—a consensus which may have emerged under the shadow of violence.
5.2. Exploring the determinants of cultural heterogeneity
Our measure of cultural heterogeneity might be used to consider various theories for observed levels of cultural diversity within the countries of the world today. For example, existing research on the colonial experience in the Americas speaks to the question of why Latin American countries tend to exhibit high levels of cultural homogeneity, both within countries and across South America.
One can imagine a set of initial cultural conditions created as a result of geographical factors were then subject to the common, exogenous shock of Spanish colonialism. Mahoney (Reference Mahoney2010, 33) writes, “the Spanish American cases share certain crucial similarities” particularly “similar colonial experiences.” This included institutional arrangements associated with the Catholic church and the encomienda system of labor exploitation (Mahoney, Reference Mahoney2010, 33). Latin America was also a major destination for African slaves in a migratory wave that was completed by the 19th century. Following the period of Spanish (and Portuguese) colonial influence, Latin America's relative geographic isolation encouraged more migration within the continent than between the continent and other areas. The relatively intense, temporally-bounded nature of Iberian influence in South America combined with the continent's geographic isolation help explain the region's cultural homogeneity.
South American value consensus can be contrasted with the high degree of cultural heterogeneity displayed in Eastern and Southeastern Europe. Countries like Romania, Bulgaria, and Serbia are among the most culturally heterogeneous in our sample despite the fact that they share a middle-income socioeconomic designation with much of Latin America. While South America was subject to a single, large-scale external shock related to Iberian colonialism between the 16th and 19th centuries, Eastern and Southeastern Europe has been historically situated at the geographic edge of cultural and religious boundaries that were subject to tremendous historical fluctuations. Roman Catholic traditions pressed into the area from the west while Eastern Orthodox influences emanated from former Byzantine areas. From the south and east, Islamic and Ottoman influences entered the region. Associated with this divergence in religious influences came the emergence of distinct ethnic populations and language groups. From a geographical perspective, cultural values emanating from both eastern and western Eurasia appear to have found a meeting place in Eastern and Southeastern Europe. The diversity of cultural values expressed by these populations reflect a distinctive geographical and historical context.
6. Conclusion
In this paper, we have laid out a conceptual framework which advocates for the use of public opinion data to serve as the basis for an empirical exercise to determine (a) the existence of definable global values clusters and (b) a measure of within-country cultural heterogeneity. Our empirical strategy is largely exploratory, enabling us to discover a set of cultures and then view how countries differentially mix those cultures. We have characterized those groups and offered some preliminary validation of our approach. Finally, we have discussed potential empirical applications for our measure of cultural heterogeneity.
Supplementary Material
The supplementary material for this article can be found at https://doi.org/10.1017/psrm.2019.43
Acknowledgments
Many thanks to Richard Anderson, Vicky Fouka, and Sandra Ley for helpful comments.


