


This paper proposes a hierarchical latent class modeling approach to analyze political participation in Latin America. Our study builds on Alvarez et al. (Reference Alvarez, Levin and Núñez2017), who develop a theoretical framework and a two-dimensional latent class model to study participation in Argentina using survey data. Here we adopt a broadly comparative perspective, expanding their analysis to 17 Latin American countries. In order to do so, we extend Alvarez et al. (Reference Alvarez, Levin and Núñez2017)'s empirical method, letting the parameters of the latent class model vary between countries while preserving the cross-national comparability of our results. We also adopt a more efficient estimation strategy to assess the influence of micro- and macro-level variables on political participation.
Alvarez et al. (Reference Alvarez, Levin and Núñez2017) distinguish between a conventional and an unconventional dimension of political participation, and examine how different activities—such as attending meetings of a political party, contacting government officials, requesting help from local authorities, protesting, and striking—relate to each dimension. Rather than imposing arbitrary restrictions on the mapping between political activities and participatory dimensions (i.e., assuming a priori that certain activities are either conventional or unconventional), they use a mixture model with two categorical latent variables to estimate the strength of the association between each activity and dimension. Their empirical strategy also allows them to compute individuals’ overall propensities to engage in conventional and unconventional modes of participation and, based on these propensities, to classify citizens into four participatory types, summarized in Table 1.
Table 1. Dimensions and types of political participation

Note: This table summarizes the relationship between individuals’ propensity to engage in conventional (rows) and unconventional (columns) forms of participation, and their participatory types (cells). Based on Alvarez et al. (Reference Alvarez, Levin and Núñez2017).
A citizen with a high (low) score on both dimensions is labeled an “activist” (“outsider”). Someone with a high propensity to join in conventional forms of participation but less prone to partake in activities predominantly linked to the unconventional dimension is classified as “conventional.” Finally, an individual who scores highly on the unconventional dimension but exhibits little proclivity to get involved in more conventional activities is tagged as an “agitator.”
The multi-level specification we propose here allows applying this framework beyond a single country, estimating individuals’ underlying predispositions to engage in conventional and unconventional modes of participation for all the nations in our study and calculating the prevalence of the four participatory types throughout Latin America. Importantly, the hierarchical structure of our model accommodates potential measurement non-invariance, namely, the possibility that identical questions about political participation may have different meanings or interpretations in different settings. This has become a prominent area of study for survey methodologists in recent years (e.g., Saiegh, Reference Saiegh2015).
We fit our hierarchical latent class model using an approach that differs from that employed by Alvarez et al. (Reference Alvarez, Levin and Núñez2017). In their article, estimation proceeds in two sequential steps. The first stage implements a latent class model without covariates to compute survey respondents’ scores on the conventional and unconventional dimensions and obtain their posterior probabilities of type assignment. To account for the fact that the types are estimated (rather than observed), a large number of types are drawn for each respondent from these posterior distributions. The second step then regresses each set of sampled types on explanatory variables. Estimates for the coefficients of these predictors are obtained by combining the output of the various second-stage models.
By contrast, we use a single-step procedure that concomitantly estimates individuals’ dimension-specific propensities, their probabilities of type assignment, and the impact of micro- and macro-level factors on such probabilities. Doing so enables us to directly reflect the uncertainty in survey respondents’ allocation to types and integrate it into inferences about the coefficients of the explanatory variables. This “unified” method does a better job accounting for the measurement error of classifications, yielding more accurate standard error estimates and improving the separation between classes (Kamata et al., Reference Kamata, Kara, Patarapichayatham and Lan2018).
Besides extending the method in Alvarez et al. (Reference Alvarez, Levin and Núñez2017), our model also improves on previous research using cluster analysis to develop political typologies of Latin American survey respondents (e.g., Carlin, Reference Carlin2011). Unlike our approach, cluster analysis is not based on a statistical model. Hence, it does not yield information about the probabilities of type assignment and ignores classification uncertainty, which can result in high rates of mis-classification (Kamata et al., Reference Kamata, Kara, Patarapichayatham and Lan2018). Additionally, cluster analysis provides no straightforward way of assessing the impact of covariates on type allocation. While researchers do sometimes incorporate the cluster indicators in subsequent explanatory regression models, they typically neglect classification measurement error. This leads to biased estimates for the relationship between the classifications and the covariates of interest (Haagenars, Reference Haagenars1993). Furthermore, standard cluster analysis cannot be readily applied to cross-national data without imposing strong assumptions about the items used to derive individuals’ classification—that is, that these items are identically understood and interpreted by survey participants in all countries (De Jong et al., Reference De Jong, Steenkamp and Fox2007). Our method overcomes these limitations.
1. A hierarchical latent class model of political participation
Similar to Alvarez et al. (Reference Alvarez, Levin and Núñez2017), we simultaneously examine individuals’ decisions to take part in multiple political activities in order to: (i) assess the strength of the association between each activity and participatory dimension and (ii) estimate individuals’ underlying predispositions to engage in conventional and unconventional modes of participation. However, whereas in Alvarez et al. (Reference Alvarez, Levin and Núñez2017) the parameters linking each activity and dimension are held constant for all survey respondents, we let these relationships vary across countries through a hierarchical specification. In doing so, we build on De Jong et al. (Reference De Jong, Steenkamp and Fox2007), who proposed a multi-level item response model that allows for meaningful cross-national comparisons without the need for restrictive measurement invariance assumptions. We adapt this approach and integrate it into our two-dimensional hierarchical latent class specification.
In our model, the probability that individual $i = 1,\; ... ,\; N_{k},\;$ in country $k = 1,\; ... ,\; K,\;$
 participates in activity $j = 1,\; ... ,\; J,\;$
 is given by:


where Y i,j,k is a binary variable based on i's response to survey item j; T c,i,k and T u,i,k are categorical latent variables taking values 1 (low) or 2 (high), denoting i's score on the conventional and unconventional dimensions of political participation, respectively; αc,j,k and αu,j,k are non-negative coefficients—akin to “factor loadings”—measuring the strength of the association between each participatory dimension and activity j in country k; αj,k is an intercept; and F( · ) is some cumulative density function—for example, logistic or normal.
The α parameters in Equation 2 are specified as country-specific random effects:


Equations 3–5 let the average probability of partaking in activity j as well as the relationship between j and the latent variables T c and T u differ across polities. The country-specific intercept and slopes are linked through common activity-specific means $\mu _{\alpha _{j}},\; \mu _{\alpha _{c, j}},\; \mu _{\alpha _{u, j}}$ and variances $\sigma ^{2}_{\alpha _{j}}$
 , $\sigma ^{2}_{\alpha _{c, j}}$
 , $\sigma ^{2}_{\alpha _{u, j}}$
 to ensure that T c and T u are measured on the same scale throughout the region (De Jong et al., Reference De Jong, Steenkamp and Fox2007).Footnote 1
To complete the model specification, i's propensity to engage in conventional and unconventional modes of participation is expressed as a function of individual and macro-level covariates, denoted respectively by X i,k and Z k:


where ηk = (ηc,k, ηu,k) ′ ~ Normal(0, Ση) are bivariate random effects accounting for unobserved heterogeneity and intra-country correlation in the probability of scoring highly on T c and T u. Estimates for β, γ, η and Ση are obtained alongside those for α, μ and σ2, in a single step.
We resort to Markov chain Monte Carlo (MCMC) simulations to fit the model (Lynch, Reference Lynch2007). The Bayesian inferential framework is particularly appealing in our setting, since the number of countries under study is too small to satisfy the asymptotic criteria required by maximum likelihood estimation of multi-level models. In contrast, previous research (e.g., Gelman, Reference Gelman2006) has demonstrated that Bayesian methods yield accurate estimates of the regression parameters and variance components of hierarchical models even with a small number of clusters, provided the number of observations per cluster is reasonably large—as is the case in our application.
Another fundamental advantage of the Bayesian approach is that we can obtain values for T c,i,k and T u,i,k at each iteration of the MCMC algorithm, drawing samples from their full conditional distributions {p c,i,k,low , p c,i,k,high} and {p u,i,k,low , p u,i,k,high}, with:

and p d,i,k,low = 1 − p d,i,k,high for d = c, u.
Based on these sampled values, i is classified as an “activist” if {T c,i,k, T u,i,k} = {high, high}; as “conventional” when {T c,i,k, T u,i,k} = {high, low}; as an “agitator” if {T c,i,k, T u,i,k} = {low, high}; and as an “outsider” if {T c,i,k, T u,i,k} = {low, low}. Since i's type may vary across iterations, classification uncertainty is accounted for during the MCMC simulations and incorporated in inferences about β, γ, η, and Ση without the need for post-estimation routines, as in Alvarez et al. (Reference Alvarez, Levin and Núñez2017).
The results reported below were obtained using a standard normal cumulative distribution function in Equation 2, which allows deriving closed-form conditional distributions for αj,k, αc,j,k, and αu,j,k and updating their values through Gibbs sampling (Lynch, Reference Lynch2007). These conditional posteriors do not have closed forms if a logistic link is specified, but random-walk Metropolis steps can be employed to draw samples from α. While the estimates are substantively similar, execution time increases by more than 40 percent in this case. The Online Appendix provides additional estimation details.
Before discussing our findings, it is worth noting that the number of categories of T c and T u is dictated by our analytical framework, taken from Alvarez et al. (Reference Alvarez, Levin and Núñez2017). This is a usual practice in latent class analyses when there are theoretical expectations regarding the nature of the groups underlying the data (Oberski, Reference Oberski2016). Nonetheless, we also estimated a factor-analytic version of our model that does not impose restrictions on the number of participatory types. As we show in the Online Appendix, the results provide empirical support for our theoretically-derived types.
2. Application
2.1 Data
We fit our model to data from the 2012 AmericasBarometer survey of the Latin America Public Opinion Project. The 2012 questionnaire covers a wider range of political activities for a greater number of countries than other waves, making it ideal for illustrating the application of our model. Our sample comprises 26,227 respondents from 17 countries.Footnote 2
Our dependent variables measure respondents’ engagement in the following activities: voting; attending municipal meetings; contacting municipal, local, or national authorities; attending meetings of a committee of improvements; helping solve problems in the community; attending meetings of a political party; signing petitions; sharing or reading political information through social media; participating in peaceful protests; and blocking roads. For identification purposes (footnote 1), the relationships between T c and joining roadblocks and between T u and attending municipal meetings are restricted to zero.
Drawing on previous studies (Desposato and Norrander, Reference Desposato and Norrander2008; Carreras and Castañeda Angarita, Reference Carreras and Castañeda-Angarita2014; Alvarez et al., Reference Alvarez, Levin and Núñez2017), our micro-level explanatory variables are: Age; Female; Education; Relative Income, a measure of respondents’ economic well-being relative to their countries’ average income; Perceived Corruption, recording individuals’ beliefs about the pervasiveness of corruption among public officials; Crime Victimization, an indicator for survey participants who reported having been victims of a crime in the previous year; and Ideological Distance to Incumbent, the spatial distance between respondents’ self-placement on the left-right scale and the ideological position of the incumbent party.
The country-level covariates represent institutional and economic factors that shape citizens’ incentives and opportunities for participation (van der Meer et al., Reference van der Meer, van Deth and Scheepers2009; Katz and Levin, Reference Katz and Levin2018). These include: the degree of respect for the Rule of Law; the presence and enforcement of Compulsory Voting laws; the effective number of parties (ENPP); GDP per capita; and Social Spending as a percentage of GDP. The Online Appendix provides supplementary information about variable definitions, coding and sources.
2.2 Results
Table 2 reports posterior summaries for the parameters capturing the association between each political activity and participatory dimension, averaged across countries.
Table 2. Posterior summaries for αc,j,k and αu,j,k averaged across countries

Note: This table reports posterior means and $95\percnt$ credible intervals (in parentheses) for αc,j,k and αu,j,k averaged across k.
The estimates are generally consistent with expectations. Activities considered as conventional by the literature, such as attending municipal meetings, have the largest values of αc, while αu is largest for activities deemed unconventional, such as protesting (van der Meer et al., Reference van der Meer, van Deth and Scheepers2009). Each of these activities is predominantly related to a single dimension.
Other activities, like attending meetings of a committee of improvements or helping solve community problems, exhibit relatively large values of both αc and αu, implying that they reflect conventional and unconventional latent predispositions toward political action. More generally, the values of αc and αu are statistically indistinguishable for the vast majority of the activities, meaning that they defy straightforward binary classifications. Their “dual nature” would be missed by ad-hoc typologies assuming a priori that certain forms of participation are either conventional or unconventional. By contrast, our method allows—but does not force—each item to be related to both dimensions, yielding a data-driven classification of political activities.
Figure A1 in the Online Appendix reports estimates of αc,j,k and αu,j,k for each country. The general patterns are consistent with those in Table 2: despite cultural, political, and socio-economic differences between Latin American democracies, the relationship between political activities and participatory dimensions is similar throughout the continent. However, the figure also reveals some cross-national differences in the magnitude of the estimates and in the strength of the association between activities and dimensions. These differences highlight the importance of modeling αc,j,k and αu,j,k as country-specific random effects.Footnote 3
In this direction, Table 3 shows that our baseline model (column 1) outperforms more restrictive specifications assuming equality of activity-specific slopes (column 2) or slopes and intercepts (column 3) across countries. Relaxing these invariance constraints improves fit according to a variety of commonly used model selection criteria.Footnote 4
Table 3. Comparing our model vis-á-vis alternative specifications

Note: Column 1 is our preferred specification. Column 2 assumes that αc,j,k and αu,j,k are invariant across countries. Column 3 additionally assumes that αj,k are the same $\forall$ k. Column 4 allows αj,k, αc,j,k, and αu,j,k to vary across countries but assumes that T c,i,k = T u,i,k = 2 $\forall$
 i. For AIC/BIC/CAIC/DIC/WAIC, differences larger than 10 provide overwhelming evidence in favor of the model with the lower value (Ntzoufras, Reference Ntzoufras2011)—which in all cases is the model in column 1. The χ2 tests compare the fit of the most parsimonious specifications—columns 2 to 4—against column (1); again, the p-values indicate that our preferred model fits the data significantly better.
Column 4, in turn, reports goodness-of-fit statistics for a model allowing the α parameters to vary across countries but assuming that the latent propensities to engage in conventional and unconventional participation are the same for all respondents. This specification thus assumes that all respondents belong to the same participatory type. A comparison between columns 1 and 4 reveals that our baseline specification is favored by every model selection criterion. Hence, accounting for heterogeneity in political engagement in terms of a small yet substantively meaningful number of types greatly improves model fit.
Figure 1 provides information about the relative prevalence of the four participatory types in our sample. As noted before, our method does not treat respondents’ types as fixed, but instead estimates the probability that each individual is assigned a high conventional and high unconventional type. The top panel of the figure plots P(T c,i,k = high) and P(T u,i,k = high) $\forall$ i. On average, the probabilities that a survey respondent scores highly on the conventional and unconventional dimensions are 0.23 and 0.18, respectively. Hence, in line with prior findings (Klesner, Reference Klesner2007), our results indicate that Latin Americans’ propensity to engage in politics, even through relatively less disruptive or more routinized means, is rather low. Based on these dimension-specific propensities, the mean posterior probabilities of classifying respondents into each of the types are: 0.63 for “outsiders,” 0.18 for “conventionals,” 0.13 for “agitators,” and 0.06 for “activists.”

Figure 1. Probabilities of type assignment.
Note: The top panel depicts the relationship between the probability of being assigned a high conventional and high unconventional type. Circles represent survey respondents. The lower bottom panel reports posterior means and 95 percent credible intervals for the probabilities of type assignment.
The posterior probabilities of type assignment are very precisely estimated, as seen in the bottom panel of the figure, which displays their 95percent credible intervals. The bottom panel also indicates that the types are generally well separated (see also Figure A3 in the Online Appendix). This implies that the different types capture distinct patterns of political participation present in our sample, and that respondents can be accurately and unambiguously assigned to a particular type (Depaoli, Reference Depaoli2013). As we noted in the introductory section, the ability to improve class separation is one of the advantages of our “unified” estimation procedure.
Moreover, the probabilities of type assignment are statistically indistinguishable across countries, as seen in Figure 2.Footnote 5 This is a remarkable finding, as our model did not impose any restrictions on the distribution of types across Latin America.
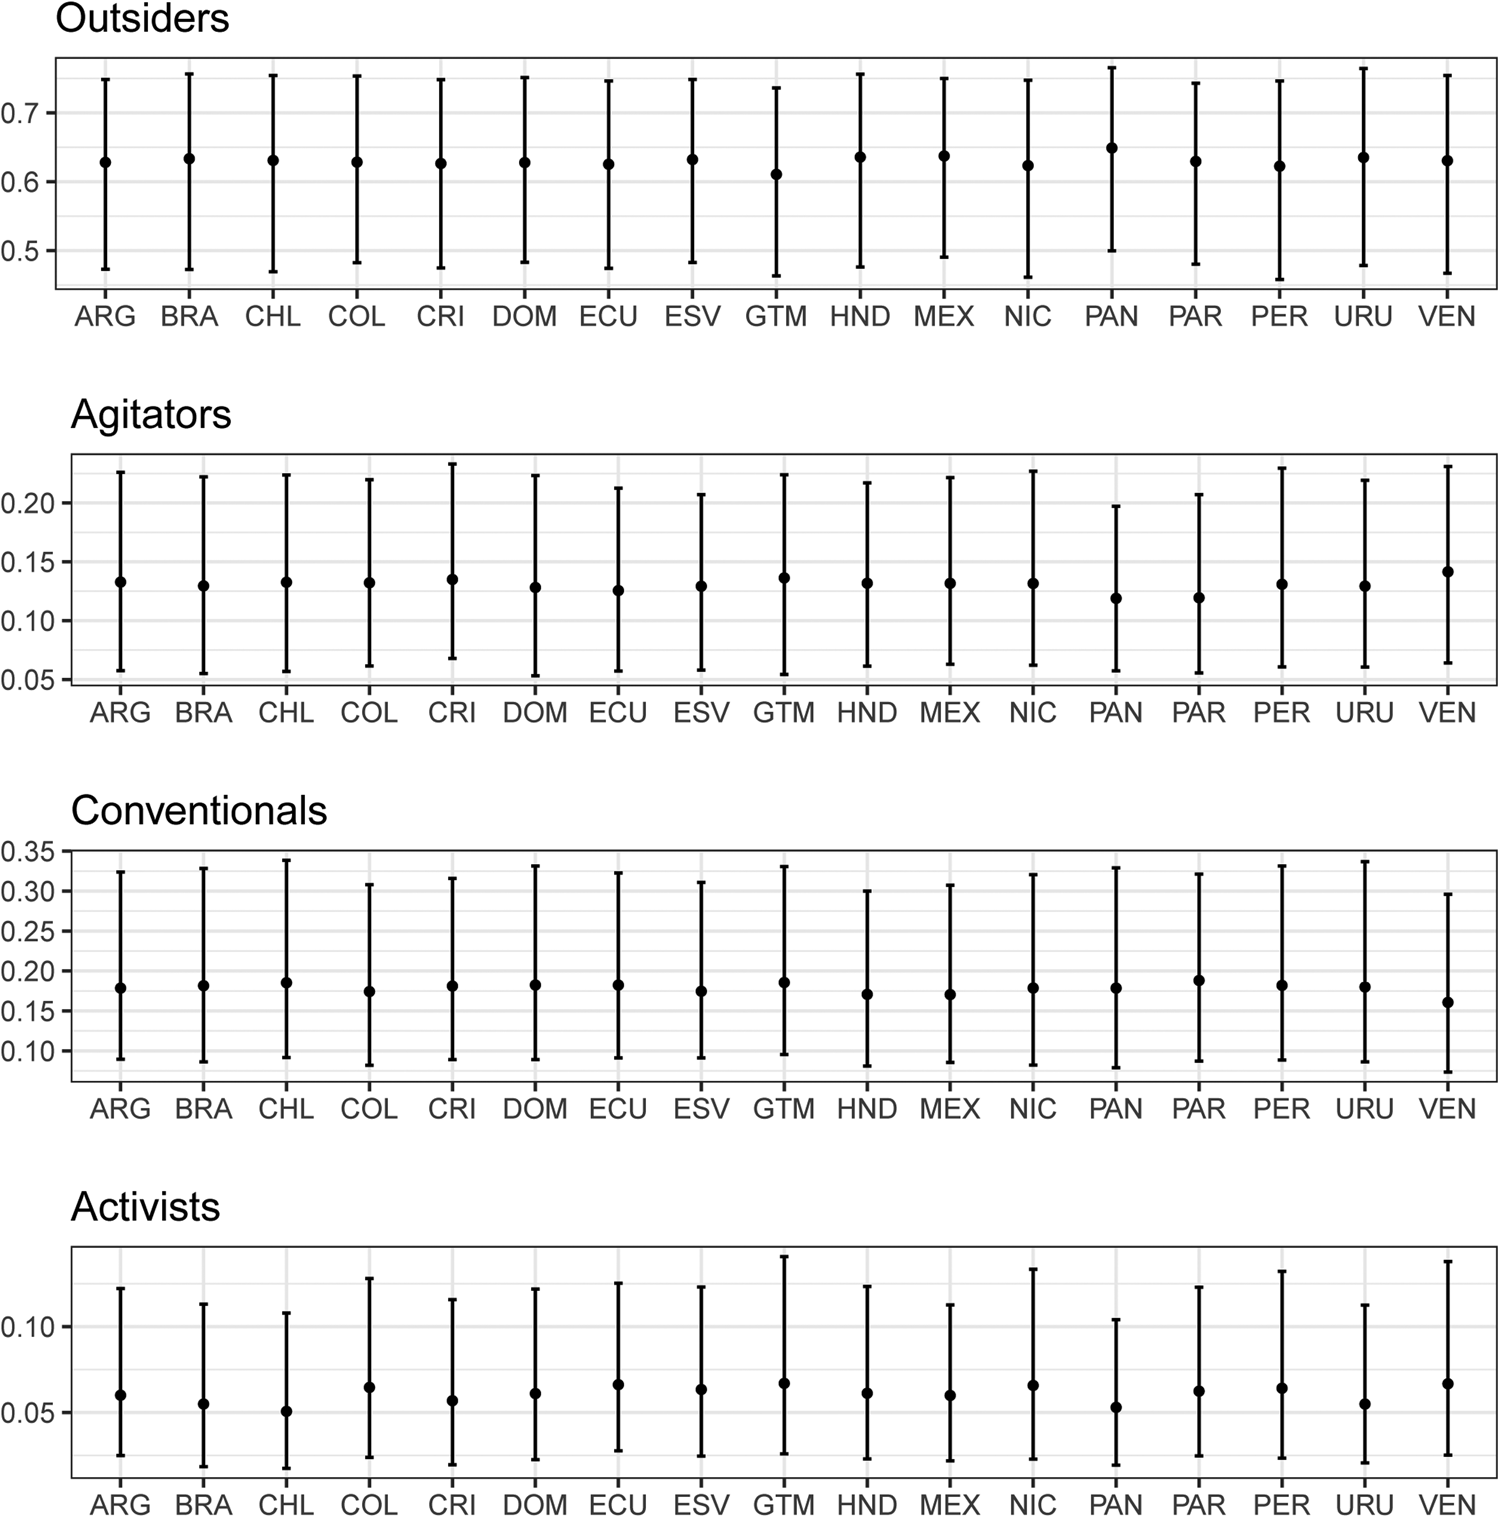
Figure 2. Probabilities of type assignment, by country.
Note: Circles represent posterior means. Vertical lines show 95 percent credible intervals.
There are, on the other hand, noticeable within-country differences in the probabilities of type assignment. Survey participants are significantly and decidedly (between 1.5 and 2 times) more likely to be outsiders than to be allocated to the other three categories in each and every one of the democracies under study. At the other extreme, respondents throughout the region are least likely to belong to the activist type.
Figure 3 examines the impact of individual and contextual factors on these probabilities. Among the individual-level covariates, Crime Victimization is strongly and significantly correlated with type allocation. In consonance with prior research (e.g., Bateson, Reference Bateson2012), we find that being victim of a crime is associated with an increase in political engagement: survey participants who reported recent crime victimization are 8.22 percentage points less likely to be outsiders than comparable non-victims.

Figure 3. Expected change in the probabilities of type assignment associated with a (unit) change in the covariates.
Note: Circles represent posterior means. Horizontal lines show 95 percent credible intervals.
The estimates for socio-demographic characteristics are also consistent with the literature (Carreras and Castañeda Angarita, Reference Carreras and Castañeda-Angarita2014; Alvarez et al., Reference Alvarez, Levin and Núñez2017): older and more educated respondents are less likely to be classified as outsiders and more prone to participate in politics than younger and less educated individuals.
On the other hand, none of the country-level covariates has a direct impact on individuals’ allocation to participatory types (see also Figure A5 in the Online Appendix). Nonetheless, contextual factors might indirectly shape allocation to types through the incentives and information they provide to citizens. For instance, prior studies (Katz and Levin, Reference Katz and Levin2018 and Dassonneville and McAllister, Reference Dassonneville and McAllister2020, among others) have underscored the influence that ENPP and Compulsory Voting exert on individuals’ attitudes, behavioral incentives and political sophistication, which may affect their decision to engage in conventional and/or unconventional forms of participation. In this sense, Table A6 in the Online Appendix shows that adding country-level covariates improves the explanatory power of our model even if none of these variables is statistically significant in isolation.
For comparison, Figure A7 in the Online Appendix reports covariate “marginal effects” estimated from a model that ignores classification uncertainty, as is the standard practice in cluster analysis. In line with the arguments of Haagenars (Reference Haagenars1993) and Kamata et al. (Reference Kamata, Kara, Patarapichayatham and Lan2018), the figure highlights that neglecting classification measurement error leads to different estimates—and, in some cases, different conclusions—regarding the influence of individual and contextual variables on political participation in Latin America.
3. Conclusions
This research note contributes to the comparative study of political participation by simultaneously examining individuals’ propensity to engage in conventional and unconventional activities across 17 Latin American nations. We draw on Alvarez et al. (Reference Alvarez, Levin and Núñez2017), extending their latent class model to the cross-national setting and implementing an estimation approach that is better able to account for classification uncertainty and integrate it into inferences about the model parameters.
Our data reveal that, in spite of individual and contextual differences, Latin Americans combine the different activities in a similar fashion. At the same time, we show that accommodating cross-national differences in the relationship between activities and participatory dimensions through a multi-level specification greatly improves the model's fit to the data. Our results also indicate that the average propensity to engage in politics is quite low across the continent: survey respondents are more likely to shun politics than to partake in either conventional or unconventional activities. Despite this predominance of outsiders, allowing for additional citizen types enhances the model's explanatory power. Our model's ability to account for within- and between-country variations in participation is especially important in view of recent political developments in Latin America. Whereas countries such as Chile, Ecuador, and Peru have witnessed massive protests in the last year, political discontent in other nations (e.g., Argentina and Uruguay) has been channeled through conventional electoral means. The release of public opinion surveys covering these events will provide us with the opportunity to examine how the distribution of participatory types has evolved in the region.
Although our research focused on participation, our multilevel latent class model can be adapted to analyze other political behaviors and attitudes from a comparative standpoint. Latent class analysis has found a growing number of uses in political science, but most applications have been single-country studies. In the few instances in which these models have been fitted to multi-country data, concerns about measurement invariance have been typically ignored (e.g., Blaydes and Linzer, Reference Blaydes and Linzer2008; Pirani, Reference Pirani2013). Our hierarchical specification allows applying latent class models to cross-national surveys without the need to rely on stringent parameter restrictions or to impose unrealistic assumptions about the meaning of the items across different populations.
Supplementary material
The supplementary material for this article can be found at https://doi.org/10.1017/psrm.2020.35.


