


1 Introduction
The 2016 election was the first in which a woman ran for president as the nominee of one of the two major parties while also featuring a Republican nominee who frequently made sexist remarks during his run for office. Trump’s sexism was an especially salient feature of the closing stages of the general election campaign. Trump frequently directed sexist rhetoric at Democratic nominee Hillary Clinton, accusing her of “playing the woman card” and referring to her as a “nasty woman.” A litany of studies conducted since the election find that sexist attitudes were a strong predictor of voting for Trump over Clinton in 2016 (Schaffner, MacWilliams, and Nteta Reference Schaffner, MacWilliams and Nteta2018; Setzler and Yanus Reference Setzler and Yanus2018; Valentino, Wayne, and Oceno Reference Valentino, Wayne and Oceno2018; Cassese and Barnes Reference Cassese and Barnes2019; Stewart, Clarke, and Borges Reference Stewart, Clarke and Borges2019). And political scientists have continued to probe the influence of sexism on American political behavior since the 2016 election (Costa et al. Reference Costa, Briggs, Chahal, Fried, Garg, Kriz, Lei, Milne and Slayton2020; Schaffner Reference Schaffner2020b).
While empirical research in American political behavior has paid substantially more attention to the role of sexist attitudes since the 2016 election, there is significant variation in how these attitudes are measured. In this paper, I evaluate the measurement properties of items comprising the Ambivalent Sexism Inventory (which includes the hostile sexism and benevolent sexism scales) and the modern sexism scale. I evaluate these items on three main criteria—(1) convergent validity, (2) predictive validity, and (3) proximity to politics. I find that a subset of items from the hostile sexism battery have especially desirable qualities with regard to convergent and predictive validity and are also viewed by people as being relatively distant from politics. As such, these items provide a particularly useful way of measuring sexism with statements that are mostly detached from politics, thereby reducing concerns about endogeneity. I conclude by showing that a reduced scale constructed from as few as two of these items maintains similar levels of predictive validity as the full scales, leading to my recommendation that scholars (and the flagship political science surveys) use these items to efficiently and validly measure an individual’s prejudice towards women.
2 Political Science Research on Sexism
The 2016 election clearly influenced the focus of American politics scholarship. This can be seen from a keyword search for the stem “sexis*” among political science journal articles in the Web of Science database. Figure 1 shows the number of political science articles that used this term in the title, abstract, or keywords since 1994. From 1994 through 2016, the number of articles focused on sexism in any given year did not exceed 6. In 2018, 16 political science articles were published on the subject of sexism and 2019 witnessed another 17 such publications. Of the 33 sexism-focused articles published in 2018 and 2019, more than half specifically focused on the role of sexist attitudes in the 2016 U.S. presidential election.

Figure 1 Political science journal articles with stem “sexis*” in the title, abstract, or keywords, 1994–2019.
Source: Web of Science. Search conducted by author on July 31, 2020.
The dearth of attention to sexism prior to 2016 can also be found in the discipline’s flagship surveys. Neither the American National Election Study (ANES) nor the Cooperative Congressional Election Study (CCES) have consistently asked items meant to tap sexist attitudes. The CCES only added items designed to measure sexist attitudes to its common content battery in 2018. That year’s questionnaire included two items from the hostile sexism battery (described in more detail below), asking respondents whether they agreed that (1) “When women lose to men in a fair competition, they typically complain about being discriminated against” and (2) “Feminists are making entirely reasonable demands of men.” In prior election cycles, the CCES did not include items on the common content meant to measure sexist attitudes.
The ANES has, over time, only inconsistently asked questions related to sexism. Beginning in 1972, the ANES asked a question about women’s equal role in society; respondents were asked to identify their own placement on a 7-point scale ranging from “women and men should have equal roles” to “a woman’s place is in the home.” However, this question was asked of only half the sample in 2008 and then, perhaps owing to its focus on “old fashioned” sexism (Swim et al. Reference Swim, Aikin, Hall and Hunter1995), was dropped from the questionnaire entirely in 2012 and 2016. A few additional items were added to the questionnaire in 1992, but these items were not repeated in the several election years after that. Finally, in 2012, the ANES added some items from the modern sexism and hostile sexism scales and then repeated a small number of these items on the 2016 survey (while introducing several new items).
Overall, scholars of American politics are now focusing significantly more attention on the role of sexist attitudes on public opinion and voting behavior. Yet, as I describe in the next section, the discipline appears to have not settled on how to best measure such attitudes.
3 How Political Scientists Measure Sexism
A review of articles published in political science journals examining the effect of sexism on the 2016 presidential vote reveals that scholars used a variety of different scales to measure sexist attitudes. Broadly speaking, however, there were some commonalities. In particular, the Ambivalent Sexism Inventory (ASI) was one commonly used approach. The ASI was designed and introduced by social psychologists Peter Glick and Susan Fiske in 1996 (Glick and Fiske Reference Glick and Fiske1996) and has been widely used by social psychologists since then. However, the inventory is mostly new to political science research.
The Ambivalent Sexism Inventory is a 22-item battery of questions designed to tap two dimensions of sexism—hostile sexism and benevolent sexism. Glick and Fiske (Reference Glick and Fiske1997) provide the following description of these two dimensions:
“Hostile sexism seeks to justify male power, traditional gender roles, and men’s exploitation of women as sexual objects through derogatory characterizations of women. Benevolent sexism, in contrast, relies on kinder and gentler justifications of male dominance and prescribed gender roles; it recognizes men’s dependence on women (i.e., women’s dyadic power) and embraces a romanticized view of sexual relationships with women.” (p. 121)
In general, hostile sexism items capture the extent to which people exhibit prejudice and resentment toward women, while benevolent sexism taps into the extent to which people see women as frail creatures who need to be cherished and protected by men. Studies generally find that these two scales of sexism range from being entirely uncorrelated to exhibiting a moderate positive correlation (Glick and Fiske Reference Glick and Fiske2011).
Some studies on the 2016 election used the full ASI to study how people evaluated the presidential candidates (Cassese and Holman Reference Cassese and Holman2019; Glick Reference Glick2019) while other studies simply used items from the hostile sexism battery to show the role of prejudice and resentment toward women in predicting vote choices (Schaffner, MacWilliams, and Nteta Reference Schaffner, MacWilliams and Nteta2018; Valentino, Wayne, and Oceno Reference Valentino, Wayne and Oceno2018; Cassese and Barnes Reference Cassese and Barnes2019). The broad conclusion from these studies is that hostile sexism was a particularly strong predictor of how people evaluated the candidates and how they voted in the 2016 presidential election.
After the ASI, the next most commonly used scale was modern sexism. The modern sexism scale was first designed by Swim et al. (Reference Swim, Aikin, Hall and Hunter1995) in order to capture the extent to which individuals deny the existence of sex-based discrimination, are antagonistic toward demands for equality, and are resentful toward special favors for women. Since several modern sexism items appeared on the ANES in 2012 and 2016, that scale was typically used by scholars who were using the ANES as their primary source of data (Setzler and Yanus Reference Setzler and Yanus2018; Valentino, Wayne, and Oceno Reference Valentino, Wayne and Oceno2018; Cassese and Barnes Reference Cassese and Barnes2019; Knuckey Reference Knuckey2019). Notably, some studies used both hostile sexism and modern sexism items in parallel, sometimes even noting “the comparability of these two scales” (Valentino, Wayne, and Oceno Reference Valentino, Wayne and Oceno2018). As I show in the analysis that follows, the modern sexism items do in fact load together with the hostile sexism items and do not appear to measure a distinct dimension of sexism on their own. However, the strength of the loadings vary, with items meant to tap antagonism and resentment loading more strongly than those capturing the denial of sex-based discrimination.
Other studies used items that were distinct from the ASI or modern sexism (Bracic, Israel-Trummel, and Shortle Reference Bracic, Israel-Trummel and Shortle2019; Stewart, Clarke, and Borges Reference Stewart, Clarke and Borges2019), but items from the hostile, benevolent, and modern sexism scales appear to be most commonly used by political scientists. In the analysis that follows, I focus especially on the measurement properties of the items comprising these three scales.
4 Data and Methods
The primary source of data for this study is a survey of 1,103 respondents drawn from Lucid, a firm that supplies respondents for online surveys.Footnote 1 Individuals were told that they would be answering questions about their “views towards men, women, and public affairs.” The questionnaire included the full 22-item ASI, and an additional set of “modern sexism” items taken from the Voter Study Group’s VOTER survey (which are similar to items fielded on the ANES in 2012 and 2016). Following those questions, respondents answered unrelated demographic questions and then completed tasks designed to measure the predictive validity of these scales. While those tasks are explained in more detail below, they included a conjoint experiment designed to measure gender-based prejudice, an evaluation of prominent politicians, and a set of questions about policy proposals.
Lucid is a desirable source of respondents for this study because the firm provides a demographically and politically balanced set of respondents. Coppock and McClellan (Reference Coppock and McClellan2019) demonstrate the validity of responses provided by subjects from Lucid. While I make no attempt to weight this sample to be representative of American adults, the fact that the sample provided is reasonably balanced (see the Supplementary Material) with regard to gender, partisanship, age, education, and race is important given that I aim to draw conclusions about what items would operate best for representative surveys.
4.1 Evaluation Criteria
A frequently referenced concept in measurement is construct validity. While the term is often applied in different ways, broadly speaking, construct validity involves “assessing whether a given indicator is empirically associated with other indicators in a way that conforms to theoretical expectations about their interrelationship” (Adcock and Collier Reference Adcock and Collier2001). However, the term construct validity has been used inconsistently in the literature and is often applied very broadly. Jackman (Reference Jackman, Box-Steffensmeier, Brady and Collier2008) notes, “the term ‘construct validity’ has lost much of the specificity it once had, and today is an umbrella term of sorts.” Adcock and Collier (Reference Adcock and Collier2001) make a similar point, explaining that “in the psychometric literature, the term ‘construct validity’ has become essentially a synonym for what we call measurement validity” (p. 537). Thus, for the purposes of this paper, I eschew usage of the term “construct validity” in favor of more specific subconcepts.
My analysis evaluates the sexism items on three main criteria: (1) convergent validity, (2) predictive validity, and (3) what I term proximity to politics. With regard to the first criteria, I use exploratory factor analysis to examine the extent to which the items load together on one or more dimensions of sexism and how highly each item loads on a particular factor. More reliable items are those that load more strongly on the dimension of sexism that they are meant to capture. As I show below, the analysis reveals two main dimensions to the sexism items, and it also identifies which items are more strongly associated with the latent traits.
Predictive validity captures the extent to which the measures predict what they (theoretically) should. Often this involves examining correlations with observational data. For example, a measure of sexism should be negatively correlated with support for female politicians or policies designed to specifically help women. However, I move beyond correlational analysis and instead make use of a conjoint experiment designed to measure gender discrimination.Footnote 2 The full conjoint experiment is described in more detail below, but the experiment sets up both a political and nonpolitical situation where we might observe people discriminate against women. To meet the standard of having high predictive validity, items meant to measure sexism should successfully identify individuals who are more likely to discriminate against women in the conjoint task.
Finally, I also focus on the concept of proximity to politics. This is not a criterion that has typically been used to formally evaluate items meant to measure concepts like sexism. Nevertheless, it is something that scholars often consider less formally. One example comes from the debate over the best approach to measuring authoritarianism. Two prominent scales are the Right Wing Authoritarianism (RWA) scale and the child rearing scale. The RWA scale includes items such as “what our country really needs is a strong, determined leader who will crush evil, and take us back to our true path” and “what our country really needs instead of more ‘civil rights’ is a good stiff dose of law and order.” Feldman and Stenner (Reference Feldman and Stenner1997) note that such items are problematic because they specifically capture political manifestations of the underlying authoritarian predisposition. That is, by using statements that are so intertwined with politics, it becomes harder to make a case that the items are not simply endogenous to what political scientists are using those items to predict. By contrast, the child rearing items focus on statements that are more distant from politics. These are items such as whether it is more important for a child to have “independence or respect for elders.” Political scientists now generally agree that the child rearing scale is preferable at least partly because of its distance from political rhetoric (Feldman and Stenner Reference Feldman and Stenner1997; Hetherington and Weiler Reference Hetherington and Weiler2009; MacWilliams Reference MacWilliams2016).
While scholars often discuss the degree to which scales are constructed from items that may be endogenous to the outcomes they are meant to predict, I am aware of no formal way of measuring how proximate or distant a particular item is from politics. Thus, in this paper, I introduce a new approach to capturing proximity to politics, one in which individuals are asked whether each statement sounds like something they would expect to hear during a political debate. Those statements that are less frequently identified as the more political statement in these tasks are less proximate to politics and therefore less likely to raise concerns regarding endogeneity.
5 Convergent Validity
Subjects were asked all 22 items from the ASI as well as the four modern sexism items.Footnote 3 The response options for each item were on a scale ranging from agree strongly to disagree strongly.Footnote 4 Table 1 presents the results from an exploratory maximum-likelihood factor analysis. The entries in the table are factor loadings after oblique rotation. A few points are worth making from this table. To begin, most of the hostile sexism items load strongly on the first factor, with each positively scored item loading at 0.66 or above. This indicates that these items are largely tapping the same dimension of sexism. The exception to this pattern occurs for the reverse-coded items. Each of the reverse-coded items load much less strongly with the scale. This is fairly typical for reverse-coded items, which tend to be difficult for respondents to interpret leading recent studies to conclude that reverse-coded items may create more measurement problems than they solve. (Van Sonderen, Sanderman, and Coyne Reference Van Sonderen, Sanderman and Coyne2013; Zhang, Noor, and Savalei Reference Zhang, Noor and Savalei2016).Footnote 5 Altogether, the hostile sexism items as a set have a Cronbach’s alpha of 0.86.
Table 1. Factor loadings for ambivalent and modern sexism items.
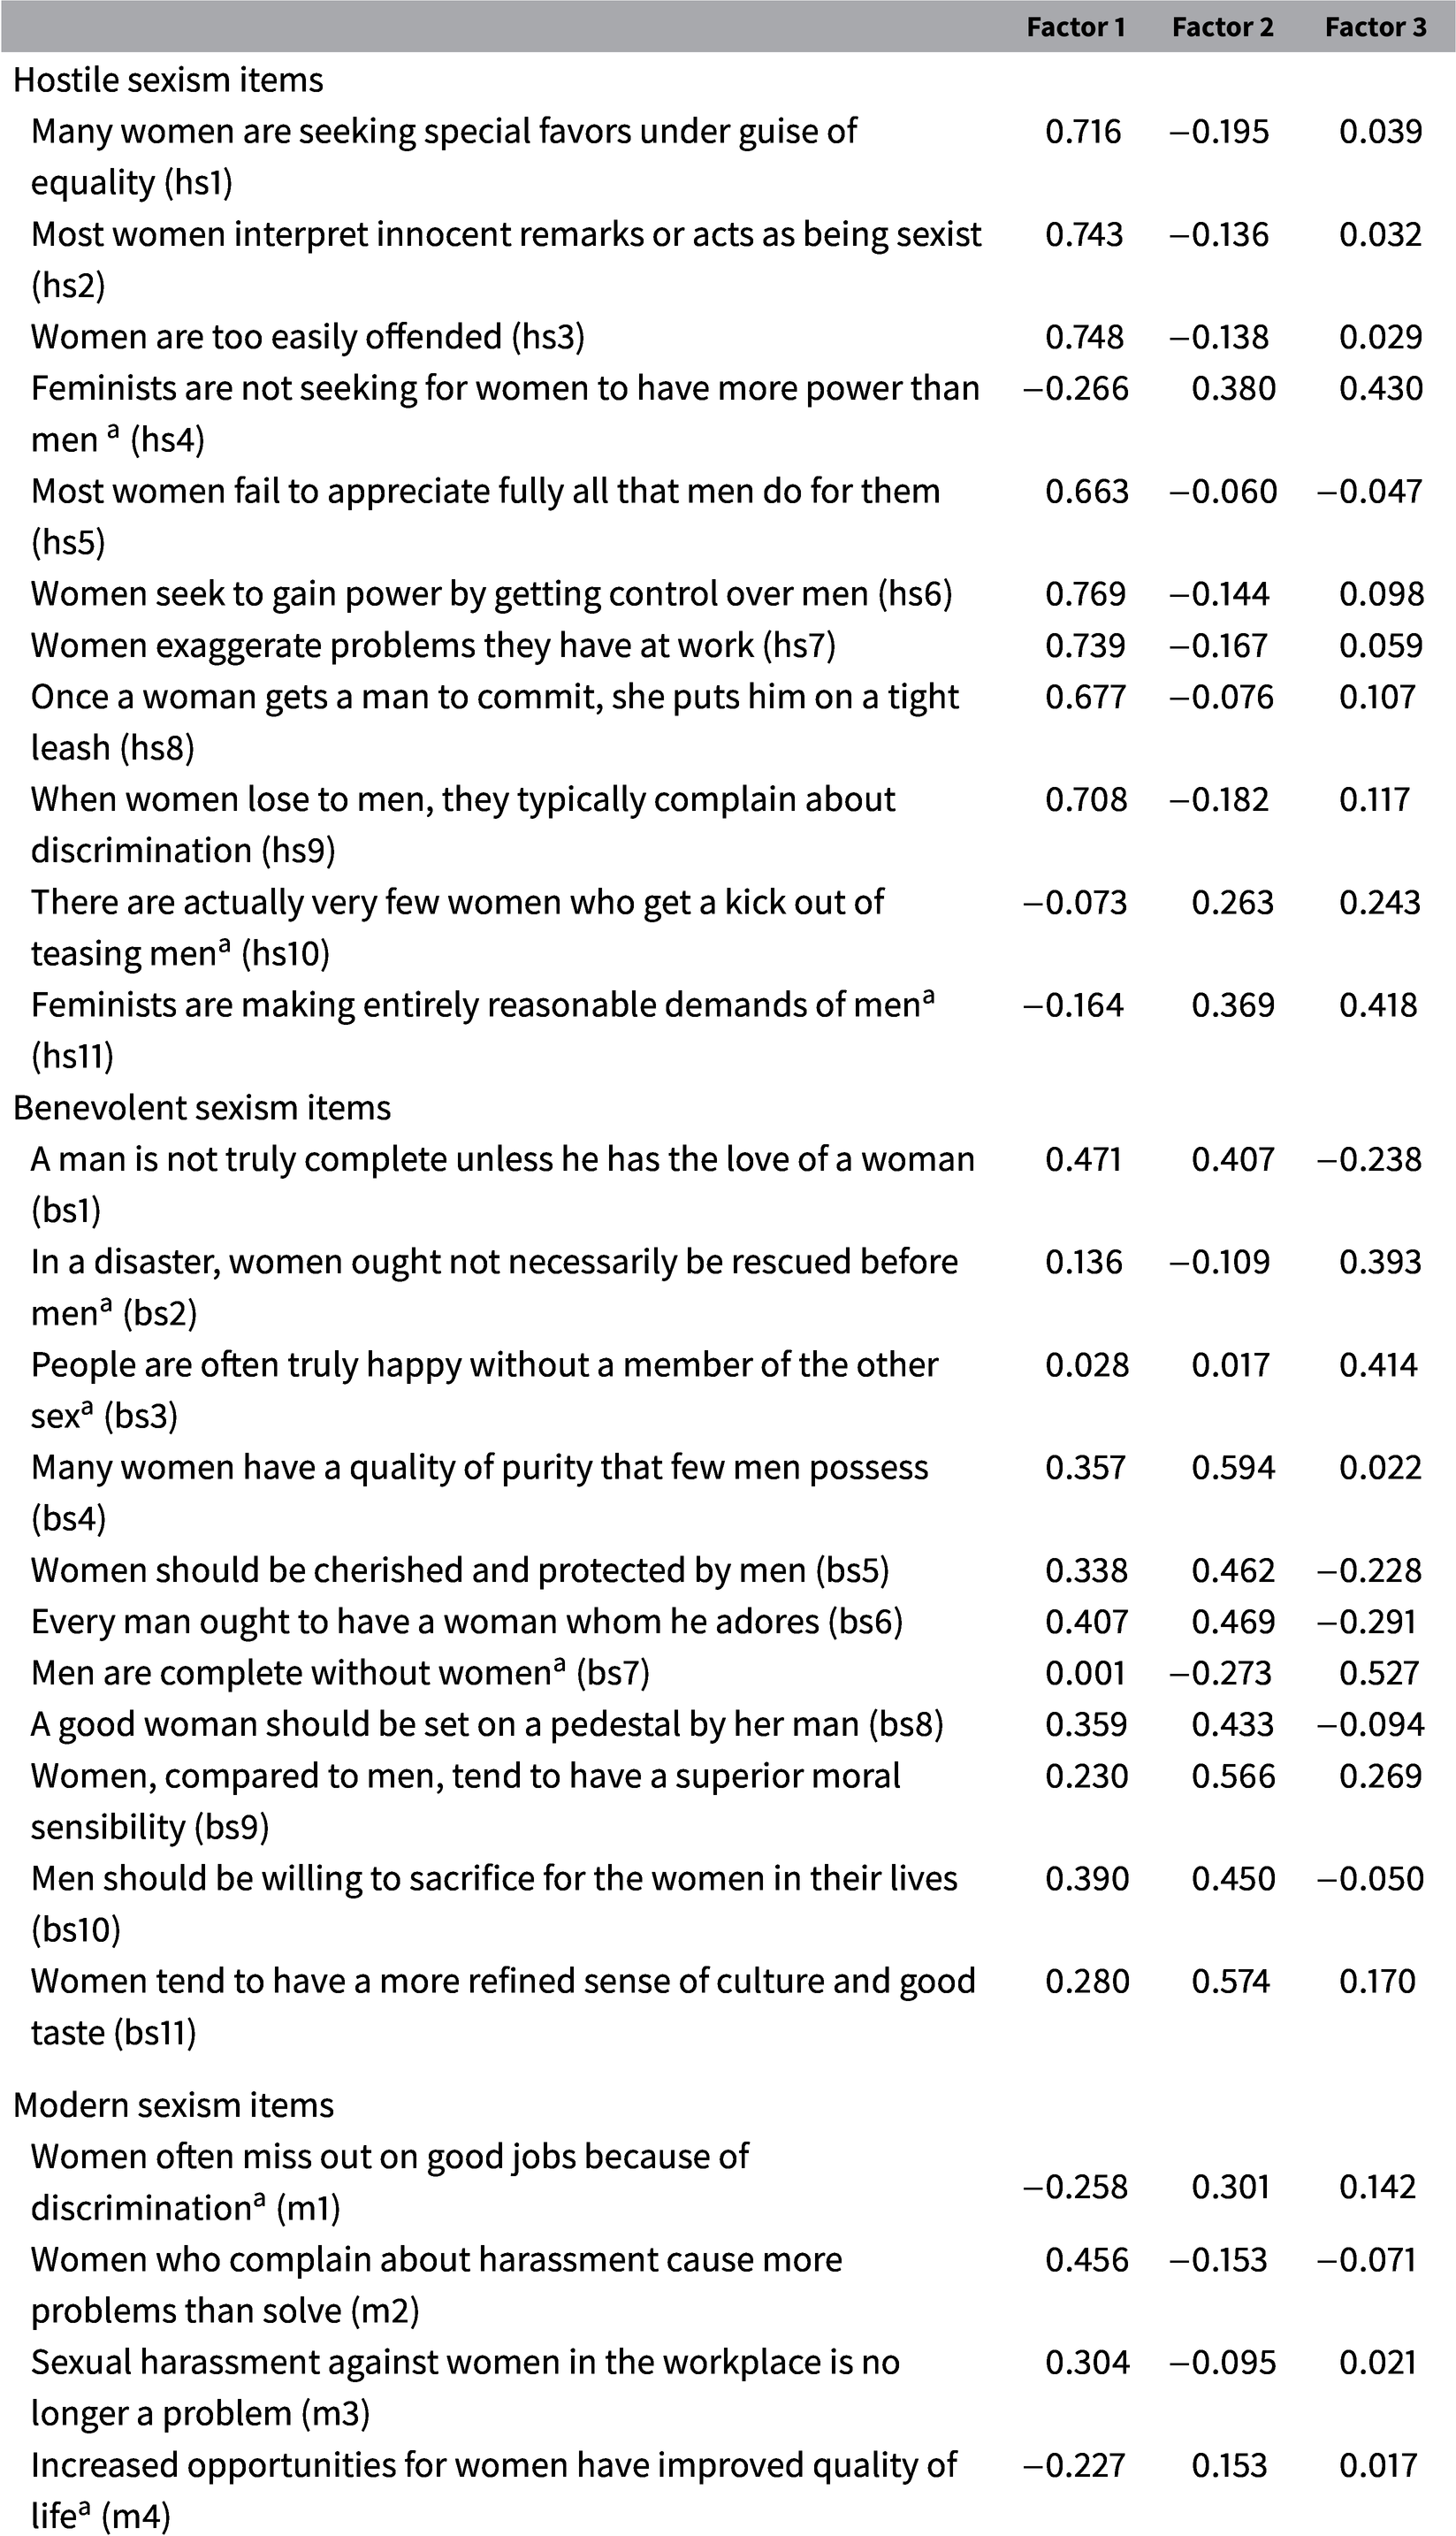
Maximum-likelihood factor analysis with oblique rotation. N = 1,072. For complete wording of items see the appendix.
 ${{}}^{\mathrm {a}}$
Reverse coded item.
${{}}^{\mathrm {a}}$
Reverse coded item.
The benevolent sexism items load more strongly on the second dimension than they do on the first; however, the loadings for these items are less strong overall than is the case for the hostile sexism items. The loadings for the positively directed items are between 0.41 and 0.59. Two of the reverse-coded items (bs2 and bs3) have very small loadings on both of the first two factors. As a set, the benevolent sexism items have a Cronbach’s alpha of 0.76.
The modern sexism scale is, on its face, similar to the hostile sexism scale. In the version of this scale that is included on the VOTER survey, respondents are asked for their level of agreement or disagreement with the four items shown at the bottom of Table 1.Footnote 6 Some of the items deal with a general prejudice and resentment towards women (e.g., m2). Several other items on the list (e.g., m1, m3, and m4) focus more on a respondent’s perceptions regarding how big of a problem sexual harassment and discrimination are in contemporary society.
Overall, the modern sexism items do not load on a unique factor. Instead, these items load more strongly with the hostile sexism items. However, the loadings for the modern sexism items are not particularly strong, with three of the four items loading at or below 0.30 on the hostile sexism factor. The item that loads most strongly with the hostile sexism items (m2) is the one that is more about prejudice and resentment rather than perceptions of sex-based discrimination. The Cronbach’s alpha for the four modern sexism items is just 0.48.
To summarize, when it comes to convergent validity, there is a clear hierarchy among the items comprising these three scales. The hostile sexism items produce the highest loadings on the first factor, while the benevolent sexism items produce reasonably high loadings on the second factor. The modern sexism items do not load together on a separate factor and show the highest loadings on the first factor; however, even when scaled alone, these items do not produce loadings as high as those from the hostile or benevolent sexism items.Footnote 7
6 Predictive Validity
Since sexism is generally defined as prejudice or discrimination against women, then a scale meant to capture sexist attitudes should predict whether an individual will engage in sex-based discrimination. In this section, I test the predictive validity of the hostile/modern and benevolent sexism scales and items using two parallel versions of a conjoint experiment—one that is focused on asking people what type of boss they would prefer and another that asks people for their preference among a pair of politicians.
Subjects were randomly assigned to complete three trials of one of the two conjoint experiments. For the nonpolitical conjoint, people received the following prompt:
Now we are interested in understanding what people look for in a boss. On the following pages we will show you some randomly selected profiles of hypothetical individuals. Please read these profiles and then indicate which person you would prefer to have as a boss.
Subjects were shown four traits for each of two bosses in each trial. The traits and possible values are shown in Table 2. The gender of the boss is not specifically stated, but rather implied through the putative gender of the first name shown for each boss.
Table 2. Description of conjoint experiment.

Subjects who were assigned to the political conjoint experiment received a slightly different prompt, this time asking them to choose who they would prefer to have as a representative in Congress. The prompt for this conjoint was as follows:
Now we are interested in understanding what people look for in a politician. On the following pages we will show you some randomly selected profiles of hypothetical individuals. Please read these profiles and then indicate which person you would prefer to have represent you in Congress.
The traits shown in this conjoint were identical to those shown in the table above with two exceptions. First, rather than “Experience in industry” subjects were shown “Experience in politics.” Second, subjects were shown a party label for each person. However, the party label was fixed and was the same for all politicians that the subjects evaluated. So, for example, some subjects were randomly assigned to evaluate candidates who were all identified as Democrats and the other subjects saw candidates who were all identified as Republicans. Thus, partisanship was not a feature that distinguished the candidates for any subjects.
In a meta-analysis of candidate choice conjoint experiments, Schwarz, Hunt, and Coppock (Reference Schwarz, Hunt and Coppock2018) find that female candidates are generally preferred over males by about 2 percentage points. However, to determine the predictive validity of the sexism scales, I focus on the extent to which the treatment effect of boss/candidate gender is conditional on a subject’s value on the sexism scales. That is, are individuals who score higher in hostile/modern or benevolent sexism more likely to prefer a male boss/candidate than those who score lower on those scales?
6.1 Conjoint Results
Table 3 shows the results from three ordinary least squares (OLS) models estimating the AMCE for the female name treatment conditional on both hostile/modern and benevolent sexism. The hostile/modern and benevolent sexism scales were extracted from the factor analysis presented in Table 1. The first factor is labeled hostile sexism while the second is benevolent sexism. Both are standardized scales with a mean of zero and a standard deviation of 1.
Table 3. Models estimating treatment effect of boss/politician gender conditional on hostile and benevolent sexism.
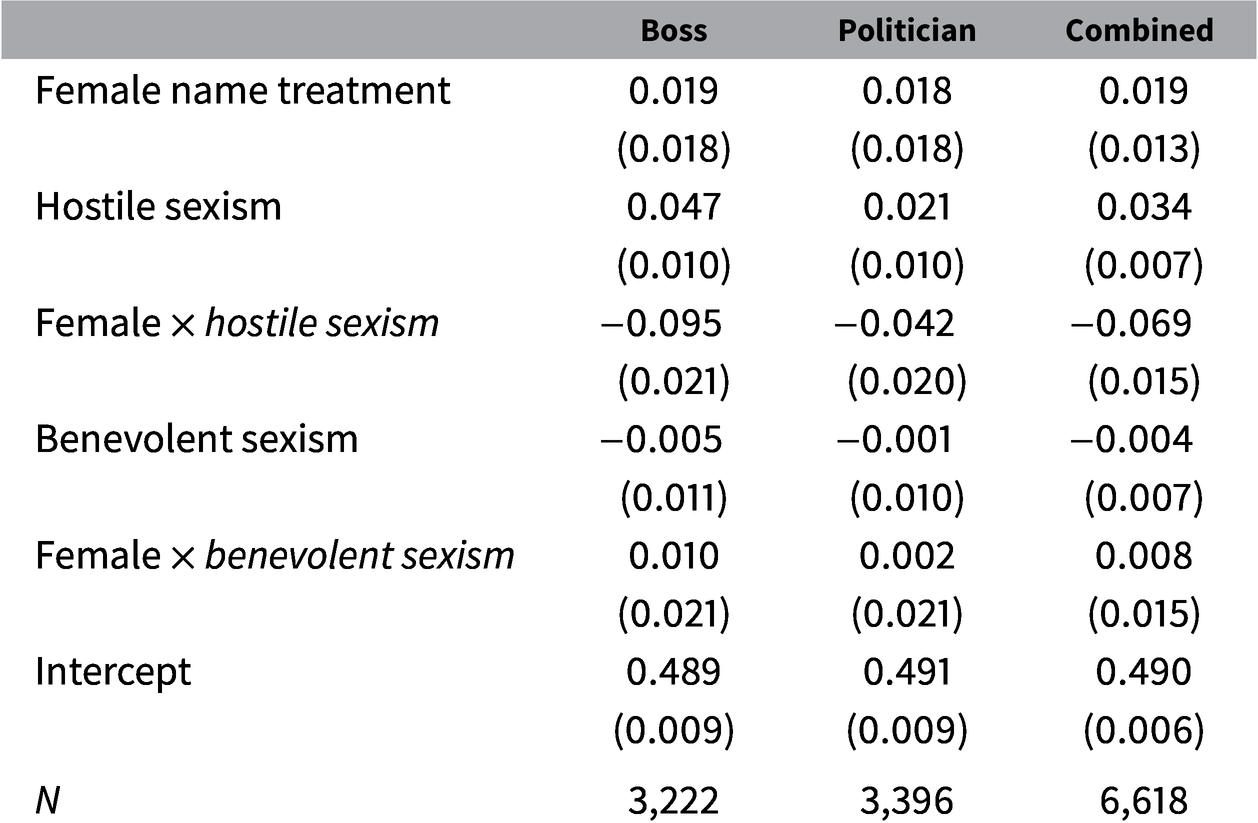
Clustered standard errors in parentheses.
The first column in Table 3 shows the estimates from the model asking people to pick a preferred boss. The coefficients for hostile sexism and the interaction term for hostile sexism and the female treatment are both statistically significant. By contrast, neither the coefficient for benevolent sexism nor the coefficient the interaction of benevolent sexism and the female treatment are statistically significant (and both coefficients are close to zero). This indicates that while the effect of the female treatment was conditioned by a subject’s value on the hostile sexism scale, the same was not true for the subject’s value of benevolent sexism. To provide a sense of the the strength of this effect, the model predicts that a respondent who is 1 standard deviation below the mean on hostile sexism prefers the female profile by 11 points over the male profile. By contrast, a respondent who is 1 standard deviation above the mean on the hostile sexism scale is predicted to prefer the male profile over the female profile by an 8-point margin.
The second column comes from the experiment where subjects chose between two representatives in Congress. The coefficient for the interaction between hostile sexism and the treatment is still in the expected direction and statistically significant, although only about half as large as in the boss conjoint.Footnote 8 The fact that the conditioning effects are weaker in the political conjoint is likely due to the fact that the sex of a politician often sends signals about other politically salient factors (e.g., ideology) that may serve to mute the role of prejudice in that setting.Footnote 9 Nevertheless, the model predicts that a respondent who scores one standard deviation below the mean on the hostile sexism scale prefers the female politician’s profile over the male profile by a margin of six points whereas a respondent who is one standard deviation above the mean is about three points more likely to select the male rather than the female profile.
The final column of Table 3 combines the different conjoint experiments into a single pooled model. In this model, the coefficient for the interaction term between hostile sexism and the female treatment is
 $-$
0.069, indicating that for every one standard deviation more sexist an individual is on the hostile sexism scale, they are 6.9 points less likely to choose the female profile. Once again, the coefficient for the interaction between benevolent sexism and the female treatment (0.005) is close to zero and even slightly in the opposite direction as would be hypothesized.Footnote
10
$-$
0.069, indicating that for every one standard deviation more sexist an individual is on the hostile sexism scale, they are 6.9 points less likely to choose the female profile. Once again, the coefficient for the interaction between benevolent sexism and the female treatment (0.005) is close to zero and even slightly in the opposite direction as would be hypothesized.Footnote
10
One important point to note about the effect of the hostile sexism scale in this task is that people who score below the mean on the scale tend to be more likely to prefer the female profile, whereas those above the mean are less likely to do so. What this means is that the hostile sexism scale may not simply pick up the presence versus the absence of sexism, but rather appears to capture a range of predispositions from what one might term actively antisexist (or embracing of feminism) at the low end of the scale, to nonsexist among those at the middle of the scale, and sexist among those who score high on the scale. That the scale picks up on this full range of attitudes likely makes it all the more powerful for social scientists, although it also means that researchers should take this bi-polarity into account when substantively interpreting the effects of the scale.
In addition to conditioning the female treatment effects on the scales extracted from the factor analysis, I also tested each individual sexism item separately. To do this, I estimated a separate model for each item and extracted the coefficient for the interaction term between that item and the female treatment indicator (I pooled the experiments for this exercise). Figure 2 plots the absolute value of these coefficients along with their 95% confidence intervals. Just as the benevolent sexism scale did not significantly condition the treatment effects in Table 3, not one of the 11 benevolent sexism items produces a statistically significant conditioning effect. This is further confirmation that benevolent sexism items do not predict gender discrimination. By contrast, 10 of the 11 hostile sexism items are statistically significant in conditioning the effect for the sex treatment. The only item that does not condition the treatment effect is the reverse-coded statement: “There are actually very few women who get a kick out of teasing men.”

Figure 2 Effect of each sexism item on conditioning the gender treatment effect from the conjoint.
Note: Vertical lines represent 95% confidence intervals.
Finally, the modern sexism items produce mixed results. Two items do significantly condition the sex treatment—“Women who complain about harassment cause more problems than solve” and “Sexual harassment against women in the workplace is no longer a problem.” However, the other two items are not statistically significant.
Overall, the conjoint experiment provides evidence for the predictive validity of 10 of the 11 hostile sexism items as well as two of the four modern sexism measures.
6.2 Predicting Other Political Outcomes
Broadly speaking, the conjoint experiment helps to demonstrate that hostile sexism is related to prejudicial behavior. In the Supplementary Material, I report on tests of whether these sexism scales also predict evaluations of politicians and policy proposals. To do this, I estimated OLS regression models and included the latent scales for hostile/modern sexism and benevolent sexism as the key independent variables. The models also included controls for partisanship, ideology, age, education, race, and gender. Overall, hostile sexism is a strong predictor of evaluations of prominent politicians even after controlling for demographics, partisanship, and ideology—it is negatively related to evaluations of female Democrats Elizabeth Warren and Kamala Harris, and strongly positively related to evaluations of Donald Trump and (to a weaker extent) Mitt Romney. Hostile sexism also strongly predicts opposition toward a policy designed to ensure fair pay for women.
By contrast, benevolent sexism stood out as a statistically significant predictor of support for removing Title IX requirements related to athletic opportunities as well as on fining companies for gender discrimination. In both cases, these effects were relatively modest (about half the size of the effect of hostile sexism on the pay discrimination policy). Substantively, people with higher levels of benevolent sexism were more supportive of a policy that protects women from pay discrimination, but were also more supportive of a policy change that would mean that women could receive reduced athletic opportunities.
Given the fact that the benevolent sexism factor is typically weaker or nonsignificant when compared to hostile sexism, I focus on the latter during the remainder of this paper. This is not meant to dismiss benevolent sexism as irrelevant, but it does appear to play a weaker and more nuanced role than the hostile dimension. Thus, at this point, the predictive validity task points to the hostile sexism items (and to a lesser extent, the modern sexism items) as being the most relevant for understanding prejudice toward women. Accordingly, for the following evaluation related to proximity to politics, I only consider the items from the hostile and modern sexism scales.
7 Political Proximity
While the threats to making causal inferences from descriptive data are well-known, they can sometimes be compounded by the way in which concepts are measured. It is easy to see how this may be a concern for some of the hostile and modern sexism items (items listed in Table 1). For example, a statement such as “increased opportunities for women have significantly improved the quality of life in the United States” seems much more political in nature than “women exaggerate problems they have at work.” Indeed, a model that predicted support for sex-based affirmative action policies with the former statement would be so endogenous as to be essentially tautological. But using the latter statement in such a model would seem much more defensible given the conceptual distinction between what the statement is asking and the policy of affirmative action.
To quantify an item’s proximity to politics, I included a task on a separate survey that also recruited respondents from Lucid. The survey was fielded on May 26, 2020 and included interviews with 833 American adult respondents. As with the other survey, the sample was designed to meet a set of demographic quotas to ensure a balance on demographic and political characteristics.
The task was designed to have respondents indicate which hostile or modern sexism statements sounded more political to them. To do this, I randomly selected a pair of statements from the 11 hostile and 4 modern sexism items. Respondents were asked “Which of the following quotes would you be more likely to hear from a typical politician during a political debate?” Respondents were asked this question twice and two different randomly selected statements were shown each time. Thus, each item was rated in comparison to another item between 180 and 205 times.
The goal of this task is to identify which items are more likely to be viewed by Americans as more political in nature; that is, which statements people could more easily see being part of contemporary political discourse. If a statement is seen as more political by people, then it is more likely that the statement will (1) overlap with outcomes it might be used to predict, such as support for gender-related policies and (2) be conflated with related political concepts such as ideology or partisanship. Statements viewed as less political should raise fewer concerns on those points. Of course, this task cannot fully rule out concerns about endogeneity, but it should help to rule out the most direct route through which endogeneity might manifest.
Figure 3 shows the proportion of the time each item was selected as being something the person would most expect to hear during a political debate. This plot shows considerable variance in the degree to which people viewed each statement as being more political. Two of the four modern sexism items rate as the most politically proximate items. Hostile sexism items that invoke “hiring policies” or “feminism” were also seen as being political more often than not. By contrast, hostile sexism items related to how women generally behave in everyday life were viewed as less likely to be political.

Figure 3 Evaluating items on loadings and causal distance.
Figure 4 plots each item based on its first factor loading from Table 1 and the proportion of the time it was seen as the more political statement. Since items with high levels of convergent validity and political distance are most desirable, we look to the upper left-hand quadrant to see which items fulfill both of those criteria. Here, we find a cluster of five hostile sexism items with relatively similar factor loadings and rated as less political (hs3, hs5, hs6, hs7, and hs8). Recall from Figure 2 that each of these items was also a significant predictor of discriminatory behavior in the conjoint experiment. Note that three hostile sexism items (hs1, hs2, and hs9) that also load quite highly on the first factor rate as being more politically proximate and thus may be less ideal items for the purposes of predicting political opinions and actions.

Figure 4 Plotting items based on factor loadings and causal distance.
8 Testing a Reduced Hostile Sexism Scale
The tasks above have helped to establish three findings regarding measures of sexism:
-
1. Hostile/modern sexism items measure the dimension of sexism that is relevant for predicting sex-based discrimination. Benevolent sexism items do not have predictive validity when it comes to that same task.
-
2. Hostile sexism items—particularly those that are positively oriented—have high levels of convergent validity. Modern sexism items load on the same dimension as hostile sexism items, but much less strongly.
-
3. There are a clear set of five hostile sexism items that not only have high convergent and predictive validity, but also are viewed as more distant from politics. Other hostile or modern sexism items either do not load as highly on the latent scale or are viewed as being more political in nature.
Given that these tests have identified five items that appear to score well on all three tests, I now turn to examining whether these items (or a subset of these items) can perform well on their own. The need for a smaller selection of items is easy to understand: it took the median respondent over 3 min to complete the full 22-item ambivalent sexism inventory on the survey I fielded. Even if one only wishes to field the full 11-item hostile sexism battery, it would still take up over 100 s of valuable survey time to administer the full battery.
I start with the five items that score highest in terms of convergent validity, predictive validity, and distance from politics. Of course, scholars may choose to use all five items, but given the time crunch on academic surveys, it is worth considering how limited the scale can be without sacrificing much in terms of measuring the concept precisely.
To start this exercise, I turn to an item response theory (IRT) graded response model. I scale the five selected hostile sexism items and then plot the item information functions. The item information function is a measure of how much information an item provides about the underlying latent trait. Figure 5 plots these item information functions. The higher a curve extends on the y-axis the more information that item provides about the latent trait (in this case, sexism). The x-axis shows different values of the latent variable, providing information about where along the hostile sexism scale each item provides the most information.

Figure 5 Item information functions for five hostile sexism items.
Overall, the graph shows that hs6, the statement “Women seek to gain power by getting control over men” clearly provides the most information about hostile sexism. This item is especially good at providing information about sexist attitudes that fall between
 $-$
1.5 and 1.75 on the standardized scale. After hs6, there is a fairly clear hierarchy of items, with hs7 providing the next most information, followed by hs8, hs3, and then hs5.
$-$
1.5 and 1.75 on the standardized scale. After hs6, there is a fairly clear hierarchy of items, with hs7 providing the next most information, followed by hs8, hs3, and then hs5.
Using the item information functions in Figure 5, I select a subset of items to create subscales of 4, 3, and 2 hostile sexism items. The items selected for each scale are shown in Table 4 along with the correlation between each reduced scale and the five-item scale.
Table 4. Items used for reduced scales.

Even when just a small number of items are used, the reduced scales correlate quite highly with a scale comprised of the full set of five hostile sexism items. Specifically, when an IRT graded response model is used to scale the items for each of the subscales, the four-item scale is correlated at 0.990 with the five-item scale. The three-item scale correlates with the five-item scale at 0.960 and the two-item scale correlates at 0.866.
Figure 6 shows the distributions of the different sub-scales described in Table 4. Naturally, reducing the number of items used to construct the scale produces less granularity in the measure; this reduced granularity is especially clear in the three- and two-item plots. Perhaps of more importance is the truncation that happens at either end of the scale when fewer items are used. Again, this is most clear with the three- and two-item scales; about 7% of respondents are all given the lowest value on the three-item scale while nearly 11% receive the lowest value on the two-item scale. There is also some less pronounced truncation at the top-end of the scale as well, with 3% receiving the highest value on the three-item scale and nearly 5% on the two-item battery. Thus, one limitation of using a scale that includes just two or three items is the inability to full discriminate among the least and most sexist individuals. However, it is also worth noting that most of this truncation comes as the lowest levels of sexism, where scholars may be less interested in discriminating among respondents.

Figure 6 Distributions of latent scales for selected hostile sexism.
A final important question is whether reducing the number of items in the hostile sexism scale would impact the predictive validity of that scale. Specifically, would political scientists be less able to uncover the influence of hostile sexism on prejudicial behavior or attitudes if they used a reduced scale? The most straightforward way to address this question is to return to the analysis of the conjoint experiment presented earlier. As noted before, if hostile sexism is a measure of prejudice against women, then it should condition the extent to which people would prefer a female boss or political representative to a male. Table 5 shows the effects of the female name treatment from the conjoint experiments and the interaction of that treatment and hostile sexism. For this analysis, I combine respondents assigned to both the boss and political conjoints into a single model. The focus here is on the interaction terms—when they are significant and negative it indicates that people with higher levels of hostile sexism were less likely to choose the female profile.
Table 5. Comparing the effect of reduced sexism scales on predicting sex-based discrimination in the conjoint task.

Cluster-robust standard errors in parentheses.
Table 5 estimates separate models using the five-item scale and each of the reduced scales. In each case, the coefficient on the interaction term is statistically significant and negative. The coefficient for the five-item scale is
 $-$
0.062, not much smaller than the coefficient in Table 3 (
$-$
0.062, not much smaller than the coefficient in Table 3 (
 $-$
0.069) for the scale that used all of the hostile/modern sexism items. For the most part, the further reduced scales in Table 5 produce coefficients that are approximately as strong as for the five-item scale. The only potential exception is the two-item scale, which produces a coefficient for the interaction term that is about 15% smaller than the model with the five-item scale. But even here, the difference between these coefficients is not statistically significant.
$-$
0.069) for the scale that used all of the hostile/modern sexism items. For the most part, the further reduced scales in Table 5 produce coefficients that are approximately as strong as for the five-item scale. The only potential exception is the two-item scale, which produces a coefficient for the interaction term that is about 15% smaller than the model with the five-item scale. But even here, the difference between these coefficients is not statistically significant.
9 Conclusion
In the wake of the 2016 election, political science has focused increasing attention to studying the role of sexist attitudes on voting behavior and public opinion. This paper makes two main contributions to the question of how scholars can best measure these attitudes. First, I have evaluated items used to measure sexism in recent political science scholarship in relation to convergent validity, predictive validity, and proximity to politics. Using this approach, I ultimately identified five hostile sexism items that have particularly desirable measurement qualities. These items load strongly on a dimension of sexism that strongly predicts discriminatory behavior, but they were also viewed by respondents as being more distant from politics.
By comparison, four modern sexism items (like those fielded on the ANES and VOTER surveys), tend to load together with hostile sexism items. This is especially the case for the modern sexism items that deal less with perceptions of sex discrimination. However, the modern sexism items load less strongly than the hostile sexism items and those that do load more highly tend to be viewed as more typical political statements. To be clear, this is not meant as a critique of existing studies that use modern sexism items. Modern sexist items are clearly capturing sexism in a similar way as the hostile sexism scale. However, my analysis leads me to recommend that future iterations of surveys seeking to measure prejudice and resentment towards women should privilege the hostile sexism items I identified, as they do appear to measure the same concept while exhibiting more desirable measurement properties.
This leads to the second contribution of the paper, which is to provide guidance and justification for the use of a reduced hostile sexism battery. I have shown that scholars can easily use as few as two items from the hostile sexism battery to achieve similar results as if they had asked the full set of items. Most of the reduced items I identified are especially desirable because there is less concern that they may be too endogenous to what political scientists are seeking to explain. For example, items such as “women seek to gain power by getting control over men,” “women are too easily offended,” and “most women fail to appreciate fully all that men do for them” ask about impressions of women in everyday life rather than focusing on more politically salient terms like “harassment,” “discrimination,” and “equality.” Notably, I show in the Supplementary Material that these items do exhibit very high levels of test/retest reliability when asked on panel surveys.
The major political science surveys did little to measure sexist attitudes prior to 2016 yet the study of sexism has exploded since that historic election. Thus, this is the ideal time to consider how we can measure sexism in a way that maximizes validity, reliability, efficiency and comparability for future research on this important topic. The short battery of hostile sexism items recommended in this paper would be an important addition to all of the discipline’s flagship surveys and would help to unify the growing work on this important subject.
Acknowledgments
I am grateful to Erin Cassese, Adam Ramey, Mia Costa, and Greg Lyon for providing useful feedback on earlier drafts of this manuscript.
Funding
This work was supported by Tufts University and Data for Progress.
Data Availability Statement
The replication materials for this paper can be found at Schaffner (Reference Schaffner2020a).
Research with Human Subjects
The surveys used in this article were ruled exempt by Tufts IRB.
Supplementary Material
For supplementary material accompanying this paper, please visit https://doi.org/10.1017/pan.2021.6.


