


1 Introduction
Recently, Roberts, Stewart, and Nielsen (Reference Roberts, Stewart and Nielsen2019) introduced an approach for matching text documents in order to address confounding in observational studies of substantive and policy-relevant quantities of interest. Matching is a statistical tool primarily used to facilitate causal inferences about the effects of a particular treatment, action, or intervention from nonrandomized data in the presence of confounding covariates (Rubin Reference Rubin1973b; Rosenbaum Reference Rosenbaum2002; Rubin Reference Rubin2006; Stuart Reference Stuart2010). The principles behind matching can also be used to create sharp, targeted comparisons of units in order to, for example, create more principled rankings of hospitals (Silber et al. Reference Silber, Rosenbaum, Ross, Ludwig, Wang, Niknam, Mukherjee, Saynisch, Even-Shoshan and Kelz2014). The core idea of matching is to find sets of units from distinct populations that are in all ways similar, other than some specific aspects of interest; one can then compare these remaining aspects across the populations of interest to ascertain differences foundational to these populations. In short, matching provides a strategy for making precise comparisons and performing principled investigations in observational studies.
Though widely used in practice, matching is typically used in settings where both the covariates and outcomes are well-defined, low-dimensional quantities. Text is not such a setting. With text, standard contrasts of outcomes between groups may be distorted estimates of the contrasts of interest due to confounding by high-dimensional and possibly latent features of the text such as topical content or overall sentiment. How to best capture and adjust for these features is the core concern of this work. In particular, we consider the problem of matching documents within a corpus made up of distinct groups (e.g., a treatment and control group), where the interest is in finding a collection of matched documents that are fundamentally “the same” along key dimensions of interest (in our first application, for example, we find newspaper articles that are about the same events and stories). These matched documents can then be used to make unbiased comparisons between groups on external features, such as rates of citation or online views, or on features of the text itself, such as sentiment. In the case where group membership can be thought of as the receipt of a particular intervention (e.g., documents that were censored vs. not, such as in Roberts, Stewart, and Nielsen (Reference Roberts, Stewart and Nielsen2019)), this allows us to draw causal inferences about effects of interest.
This paper makes three contributions to guide researchers interested in this domain. Our first contribution is a deconstruction and discussion of the elements that constitute text matching. This formulation identifies a series of choices a researcher can make when performing text matching and presents an approach for conceptualizing how matching can be used in studies where the covariates, the outcome of interest, or both are defined by summary measures of the text. Our second contribution is to investigate these choices using a systematic multifactor human evaluation experiment to examine how different representations and distance metrics correspond to human judgment about document similarity. Our experiment explores the efficiency of each combination of choices for matching documents in order to identify the representations and distance metrics that dominate in our context in terms of producing the largest number of matches for a given dataset without sacrificing the match quality. We also present a general framework for designing and conducting systematic evaluations of text-matching methods that can be used to perform similar investigations in different contexts. Our third contribution is twofold.
First, we present a novel application of template matching (Silber et al. Reference Silber, Rosenbaum, Ross, Ludwig, Wang, Niknam, Mukherjee, Saynisch, Even-Shoshan and Kelz2014) to compare news media organizations’ biases, beyond choices of which stories to cover, in order to engage with a running debate on partisan bias in the news media. Through template matching on text, we identify similar samples of news articles from each news source that, taken together, allow for a more principled (though not necessarily causal) investigation of how different news sources may differ systematically in terms of partisan favorability. In our second application, we illustrate the utility of text matching in a more traditional causal inference setting, namely, in an observational study evaluating the causal effects of a binary treatment. Here we demonstrate how matching on text obtained from doctors’ notes can be used to improve covariate balance between treatment and control groups in an observational study examining the effects of a medical intervention. We further discuss how researchers might leverage text data to strengthen the key assumptions required to make valid causal inferences in this nonrandomized context.
Our work builds on Roberts, Stewart, and Nielsen (Reference Roberts, Stewart and Nielsen2019), the seminal paper in this literature, which introduces text matching and describes a procedure for matching documents on a lower-dimensional representation of text based on a structural topic model (STM) (Roberts, Stewart, and Airoldi Reference Roberts, Stewart and Airoldi2016). They also present several applications that motivate the use of text matching to address confounding and describe several of the methodological challenges for matching that arise in these settings. Specifically, Roberts, Stewart, and Nielsen (Reference Roberts, Stewart and Nielsen2019) discuss the limitations of propensity score matching (PSM) and coarsened exact matching (CEM; Iacus et al. Reference Iacus, King, Porro and Katz2012) for matching with high-dimensional data and introduce Topical Inverse Regression Matching (TIRM), which uses STM to represent each document as a vector of topic loadings and then applies CEM to generate matched samples of documents from distinct groups within the corpus. Building upon this work, we develop a general framework for constructing and evaluating text-matching methods. This allows us to consider a number of alternative matching methods not considered in Roberts, Stewart, and Nielsen (Reference Roberts, Stewart and Nielsen2019), each characterized by one representation of the corpus and one distance metric. Within this framework, we also present a systematic approach for comparing different matching methods through a human evaluation experiment, which identifies methods that produce more matches and/or matches of higher quality than those produced by TIRM. Overall, we clarify that there is a trade-off between match quality and size of the matched sample, although many methods do not optimize either choice.
2 Background
2.1 Notation and Problem Setup
Consider a collection of
 $N$
text documents, indexed by
$N$
text documents, indexed by
 $i=1,\ldots ,N$
, where each document contains a sequence of terms. These documents could be any of a number of forms such as news articles posted online, blog posts, or entire books, and each document in the dataset need not be of the same form. Together, these
$i=1,\ldots ,N$
, where each document contains a sequence of terms. These documents could be any of a number of forms such as news articles posted online, blog posts, or entire books, and each document in the dataset need not be of the same form. Together, these
 $N$
documents comprise a corpus, and the set of
$N$
documents comprise a corpus, and the set of
 $V$
unique terms used across the corpus defines the vocabulary. Each term in the vocabulary is typically a unique, lowercase, alphanumeric token (i.e., a word, number, or punctuation mark), though the exact specification of terms may depend on design decisions by the analyst (e.g., one may choose to include as terms in the vocabulary all bigrams observed in the corpus in addition to all observed unigrams). Because the number and composition of features which may be extracted from text is not well-defined, documents are generally regarded as “unstructured” data in the sense that their dimension is ex ante unknown.Footnote
1
To address this issue, we impose structure on the text through a representation,
$V$
unique terms used across the corpus defines the vocabulary. Each term in the vocabulary is typically a unique, lowercase, alphanumeric token (i.e., a word, number, or punctuation mark), though the exact specification of terms may depend on design decisions by the analyst (e.g., one may choose to include as terms in the vocabulary all bigrams observed in the corpus in addition to all observed unigrams). Because the number and composition of features which may be extracted from text is not well-defined, documents are generally regarded as “unstructured” data in the sense that their dimension is ex ante unknown.Footnote
1
To address this issue, we impose structure on the text through a representation,
 $X$
, which maps each document to a finite, usually high-dimensional, quantitative space.
$X$
, which maps each document to a finite, usually high-dimensional, quantitative space.
To make principled comparisons between groups of documents within the corpus, we borrow from the notation and principles of the Rubin causal model (RCM) (Holland Reference Holland1986). Under the RCM, each document has an indicator for treatment assignment (i.e., group membership),
 $Z_{i}$
, which equals 1 for documents in the treatment group and 0 for documents in the control group. Interest focuses on estimating differences between these groups on an outcome variable, which, under a causal view, would take the value
$Z_{i}$
, which equals 1 for documents in the treatment group and 0 for documents in the control group. Interest focuses on estimating differences between these groups on an outcome variable, which, under a causal view, would take the value
 $Y_{i}(1)$
if document
$Y_{i}(1)$
if document
 $i$
is in the treatment group and
$i$
is in the treatment group and
 $Y_{i}(0)$
if document
$Y_{i}(0)$
if document
 $i$
is in the control group. These outcomes may be separate from the text of the document (e.g., the number of times a document has been viewed online) or may be a feature of the text (e.g., the length of the document or level of positive sentiment within the document).Footnote
2
Credible and precise causal inference revolves around comparing treated and control documents that are as similar as possible. However, in observational studies,
$i$
is in the control group. These outcomes may be separate from the text of the document (e.g., the number of times a document has been viewed online) or may be a feature of the text (e.g., the length of the document or level of positive sentiment within the document).Footnote
2
Credible and precise causal inference revolves around comparing treated and control documents that are as similar as possible. However, in observational studies,
 $Z_{i}$
is typically not randomly assigned, leading to systematic differences between treatment and control groups. Matching is a strategy that attempts to address this issue by identifying samples of treated and control documents that are comparable on covariates in order to approximate the random assignment of
$Z_{i}$
is typically not randomly assigned, leading to systematic differences between treatment and control groups. Matching is a strategy that attempts to address this issue by identifying samples of treated and control documents that are comparable on covariates in order to approximate the random assignment of
 $Z_{i}$
(i.e., to satisfy
$Z_{i}$
(i.e., to satisfy
 $Z_{i}\bot \!\!\!\bot (Y_{i}(0),Y_{i}(1))|X_{i}$
) (Rubin Reference Rubin1973a; Rosenbaum Reference Rosenbaum2002; Rubin Reference Rubin2006). Under this key assumption of “selection on observables,” which states that all covariates that affect both treatment assignment and potential outcomes are observed and captured within
$Z_{i}\bot \!\!\!\bot (Y_{i}(0),Y_{i}(1))|X_{i}$
) (Rubin Reference Rubin1973a; Rosenbaum Reference Rosenbaum2002; Rubin Reference Rubin2006). Under this key assumption of “selection on observables,” which states that all covariates that affect both treatment assignment and potential outcomes are observed and captured within
 $X$
, comparisons of outcomes between matched samples can be used to obtain unbiased estimates of the quantities of interest (Rosenbaum Reference Rosenbaum2002). For example, in our second application examining the effects of a medical intervention, we argue that matching on both a set of numerical covariates and the text content of the patients chart allows us to identify two groups of patients, one treated and one not, that are similar enough on pretreatment variables such that any systematic differences in their outcomes can be plausibly attributed to the impact of the intervention.
$X$
, comparisons of outcomes between matched samples can be used to obtain unbiased estimates of the quantities of interest (Rosenbaum Reference Rosenbaum2002). For example, in our second application examining the effects of a medical intervention, we argue that matching on both a set of numerical covariates and the text content of the patients chart allows us to identify two groups of patients, one treated and one not, that are similar enough on pretreatment variables such that any systematic differences in their outcomes can be plausibly attributed to the impact of the intervention.
These causal inference tools can be used more broadly, however, to produce clearly defined comparisons of groups of units even when a particular intervention is not well-defined. For example, Silber et al. (Reference Silber, Rosenbaum, Ross, Ludwig, Wang, Niknam, Mukherjee, Saynisch, Even-Shoshan and Kelz2014) introduce template matching as a tool for comparing multiple hospitals that potentially serve different mixes of patients (e.g., some hospitals have a higher share of high-risk patients). The core idea is to compare like with like: by comparing hospitals using an effective “score card” of patients, we can see which hospitals are more effective, on average, given a canonical population. In general, we focus on this general conception of matching, recognizing that often in text there is no treatment that could, even in concept, be randomized. For example, a comparison of style between men and women could not easily be construed as a causal impact. Nevertheless, the framing and targeting of a controlled comparison, a framing inherent in a causal inference approach, can still be useful in these contexts. This broader formulation of matching is used in our first application in Section 5, investigating different aspects of bias in newspaper media.
2.2 Promises and Pitfalls of Text Matching
Matching methods generally consist of five steps: (1) identify a collection of potential confounders (covariates) that would compromise any causal claims if they were systematically different across comparison groups; (2) define a measure of distance (or similarity) to determine whether one unit is a good match for another; (3) match units across comparison groups according to the chosen distance metric; (4) evaluate the quality of the resulting matched samples in terms of their balance on observed covariates, possibly repeating the matching procedure until suitable balance is achieved; (5) estimate treatment effects from these matched data (Stuart Reference Stuart2010). Different choices at each step of this process produce an expansive range of possible configurations. For instance, there are distance metrics for scalar covariates (Rubin Reference Rubin1973b), for multivariate covariates summarized through a univariate propensity score (Rosenbaum and Rubin Reference Rosenbaum and Rubin1983, Reference Rosenbaum and Rubin1985), and multivariate metrics such as the Mahalanobis distance metric (Rubin Reference Rubin1978; Gu and Rosenbaum Reference Gu and Rosenbaum1993).
Similarly, there is a large and diverse literature on matching procedures (Rosenbaum Reference Rosenbaum2002; Rubin Reference Rubin2006), and the choice of procedure depends on both substantive and methodological concerns. Some procedures match each unit in the treatment group to its one “closest” control unit and discard all unused controls (e.g., one-to-one matching with replacement), while other procedures allow treated units to be matched to multiple controls (e.g., ratio matching; Smith Reference Smith1997) and/or matching without replacement (e.g., optimal matching; Rosenbaum Reference Rosenbaum1989). Match quality is often evaluated with a number of diagnostics that formalize the notion of covariate balance such as the standardized differences in means of each covariate (Rosenbaum and Rubin Reference Rosenbaum and Rubin1985). Unfortunately, determinations of what constitutes “suitable” balance or match quality are often based on arbitrary criteria (Imai, King, and Stuart Reference Imai, King and Stuart2008; Austin Reference Austin2009), and assessing whether a matching procedure has been successful can be difficult. That being said, if and when a suitable set of matches is obtained, one can then typically analyze the resulting matched data using classic methods appropriate for the type of data in hand. Stuart (Reference Stuart2010) outlines a number of common analytical approaches.
The rich and high-dimensional nature of text data gives rise to a number of unique challenges for matching documents using the standard approach described above. From a causal inference perspective, in many text corpora, there is going to be substantial lack of overlap, that is, entire types of documents in one group that simply do not exist in the other groups. This lack of overlap is exacerbated by the high-dimensional aspect of text: the richer the representation of text, the harder it will be to find documents similar along all available dimensions to a target document (D’Amour et al. Reference D’Amour, Ding, Feller, Lei and Sekhon2017). This makes the many design decisions required to operationalize text for matching such as defining a distance metric and implementing a matching procedure especially challenging. Distance metrics must be defined over sparse, high-dimensional representations of text in a manner that captures the subtleties of language. If these representations are overly flexible, standard matching procedures can fail to identify good (or any) matches in this setting due to the curse of dimensionality.
Lack of overlap can come from substantive lack of overlap (the documents are inherently different) and also aspects of the text representation that are not substantive (this is akin to overfitting the representation model). Ideally, a good representation and distance metric will preserve the former but not the latter. All of the matching procedures discussed in this work can be thought of as carving out as many high-quality matches as they can find, implicitly setting parts of the corpus aside to have good comparisons across groups. This is in effect isolating (Zubizarreta, Small, and Rosenbaum Reference Zubizarreta, Small and Rosenbaum2014) a focused comparison within a larger context. In a causal context, this can shift the implied estimand of interest to only those units in the overlap region. For further discussion of the approaches commonly used to address overlap issues, see, for example, Fogarty et al. (Reference Fogarty, Mikkelsen, Gaieski and Small2016), Dehejia and Wahba (Reference Dehejia and Wahba2002) and Stuart (Reference Stuart2010).
Despite its complexities, the rich nature of text data also provides an opportunity in that it lends itself to more straightforward, intuitive assessments of match quality than are typically possible with quantitative data. Specifically, while it is difficult to interpret the quality of a matched pair of units using numerical diagnostics alone due to being high-dimensional, the quality of a matched pair of text documents is generally intuitive to conceptualize. With text data, human readers can quickly synthesize the vast amount of information contained within the text and quantify match quality in a way that is directly interpretable. Thus, when performing matching with text data, final match quality can be established in a manner that aligns with human judgment about document similarity. This is a version of “thick description,” discussed in Rosenbaum (Reference Rosenbaum2010, pg. 322). This also allows for comparing different matching methods to each other in order to find methods that, potentially by using more sparse representations of text or more structured distance measures, can simultaneously find more matched documents while maintaining a high degree of match quality.
2.3 Different Types of Text-Based Confounding
Text is quite multifaceted, but that does not necessarily mean that the researcher needs to attend to all aspects of the text in order to appropriately control for any confounding. Generally, matching with text is to control some latent feature of the text that is believed to potentially confound the relationship between group membership and outcome of interest. But how complex such a feature is can vary, and, depending on what the researcher wishes to control for, one might approach matching using explicitly calculated features of the text or something less explicit, such as the methods described in this work. We next discuss this spectrum of options.
In the simpler cases, one may wish to control for some feature identifiable as, for example, a set of related words. For instance, in the medical study described in Section 5.2, a patient’s degree of frailty (i.e., healthiness or lack thereof) is a potentially confounding factor that is not measured numerically but is indicated in the text data through several key terms or phrases (e.g., “wheelchair bound”). If all such text-based indicators for the underlying construct of interest can be identified ex ante based on subject matter expertise and/or substantive theory, then it may be possible to directly quantify the latent variable by applying some hand-coded decision rules to the text.Footnote 3 In this circumstance, we may simply calculate these features for our documents and use classic matching methods from there to find groups of documents well balanced in their prevalence of our hand-constructed, numerical covariates.
It is the cases where such a direct coding of the features of interest is not possible that are the focus of this paper. For example, many studies may have important confounding features that are inherently subjective (e.g., a hospitalized patient’s level of optimism or a news story’s partisan content). This introduces two difficulties: first, how to consider whether a match is of low or high quality, and, second, how to ensure that the measure of quality is in fact aligned with the difficulty to capture latent, potentially confounding, features of interest. To illustrate, in Section 5.1, we control for a feature of news articles that is both latent and subjective: the story being covered. Since there are many different stories covered across all news articles, this confounding feature is a high-dimensional categorical variable. As such, while there may be keywords which perfectly identify any one story, such as the flight numbers of plane crashes or the names of important figures, a complete list of all such keywords cannot feasibly be compiled.
It is contexts such as these where we hope matching on more general representations of text, which can be constructed without extensive manual coding efforts, will still allow for principled comparisons between groups of documents. That being said, we also recognize that automated methods for evaluation of text may not be appropriate in certain settings. We therefore encourage researchers to perform validation experiments that rely on human evaluation to verify that the text-matching process is controlling for aspects of text that may violate the critical “selection on observables” assumption.
3 A Framework for Matching With Text Data
When performing matching, different choices at each step of the process will typically interact in ways that affect both the quantity and quality of matches obtained. This can lead to different substantive inferences about the causal effects of interest. Therefore, it is important to consider the combination of choices as a whole in any application of matching. Although some guidelines and conventional wisdom have been developed to help researchers navigate these decisions, no best practices have yet been identified in general, let alone in settings with text data, where, in addition to the usual choices for matching, researchers must also consider how to operationalize the data. We extend the classic matching framework to accommodate text documents by first identifying an appropriate quantitative representation of the corpus that ideally focuses attention on those aspects we are attempting to control for and then applying the usual steps for matching using this representation. The general procedure to match text documents that we propose is the following:
-
(1) Choose a representation of the text and define explicitly the features that will be considered covariates and those, if any, that will be considered outcomes, based on this representation.Footnote 4
-
(2) Define a distance metric to measure the similarity of two documents based on their generated covariate values that ideally focuses attention on the aspects of text considered the most important to account for (i.e., biggest potential confounders).
-
(3) Implement a matching procedure to generate a matched sample of documents.
-
(4) Evaluate the match quality across the matched documents and potentially repeat steps (1)–(3) until consistently high-quality matches are achieved.
-
(5) Estimate the effects of interest using the final set of matched documents.
These steps and choices should be familiar to those with experience in standard matching as many of the choices are directly parallel to a standard matching procedure. Because text is such a rich source of data, however, how our decisions connect to which aspects of our data are most important to match is much more salient compared to classic matching. The choices made in each step therefore require expert judgment as to what aspects of the text give one the best approximation of selection on observables. In the subsections below, we briefly introduce a number of different choices available in steps (1)–(3) of the above procedure and discuss the benefits and limitations of each. In Section 4, we then present an approach for step (4) based on a human evaluation experiment. Finally, we illustrate step (5) through two different applications in Section 5. For a more thorough discussion and description of the various choices within each step of the matching procedure, see Appendix A in the Supplement.
3.1 Text Representations
The representation of a text document transforms an ordered list of words and punctuation into a vector of covariates and is the most novel necessary component of matching with text. To choose a representation, the researcher must first formulate a definition for textual similarity that is appropriate for the study at hand. In some cases, all of the information about potential confounders captured within the text data may be either directly estimable (e.g., frequency of a particular keyword) or may be plausible to estimate using a single numerical summary (e.g., the primary topic of a document estimated using a topic model). In other cases, such a direct approach may not be possible.
The most common general representation of text is as a “bag-of-words,” containing unigrams and often bigrams, collated into a term-document matrix (TDM); the TDM may also be rescaled according to term frequency–inverse document frequency (TF–IDF) weighting (Salton and McGill Reference Salton and McGill1986; Salton Reference Salton1991). Without additional processing, however, these vectors are typically very long; more parsimonious representations involve calculating a document’s factor loadings from unsupervised learning methods like factor analysis or STM (Roberts, Stewart, and Airoldi Reference Roberts, Stewart and Airoldi2016) or calculating a scalar propensity score for each document using the bag-of-words representation (Taddy Reference Taddy2013). Finally, we also consider a Word2Vec representation (Mikolov et al. Reference Mikolov, Sutskever, Chen, Corrado, Dean, Burges, Bottou, Ghahramani and Weinberger2013; Le and Mikolov Reference Le, Mikolov, Xing and Jebara2014), in which a neural network embeds words in a lower-dimensional space and a document’s value is the weighted average of its words.
Overall, when choosing a representation, researchers need to consider what aspects of the text are confounding the outcome. Generally, when the objective is to identify exact or nearly exact matches, we recommend using text representations that retain as much information in the text as possible. In particular, documents that are matched using the entire term vector will typically be similar with regard to both topical content and usage of keywords, while documents matched using topic proportions may only be topically similar. When the aspects of text are more targeted or specific, simply directly computing the relevant covariates constructed by hand-coded rules may be the best option. That being said, one might imagine that generally matching on the content of the text—as represented by the specific words and phrases used—will frequently capture much of what different researchers in different contexts may view as the necessary component for their selection on observables assumption. Clearly, this is an area for future work; as we see more matching with text in the social sciences, we will also see a clear picture as to what structural aspects of text are connected to the substantive aspects of text that researchers find important.
3.2 Distance Metrics
Having converted the corpus into covariate representations, the second challenge is in comparing any two documents under the chosen representation to produce a measure of distance. The two main categories of distance metrics are exact (or coarsened exact) distances and continuous distances. Exact distances consider whether or not the documents are identical in their representation. If so, the documents are a match. Coarsened exact distance bins each variable in the representation and then identifies pairs of documents which share the same bins. If the representation in question is based on a TDM, these methods are likely to find only a small number of high-quality matches, given the large number of covariates that all need to agree either exactly or within a bin. The alternative to exact distance metrics is continuous distance metrics such as Euclidean distance, Mahalanobis distance, and cosine distance. Counter to exact and coarsened exact metrics, which identify matches directly, these metrics produce scalar values capturing the similarity between two documents.
3.3 Matching Procedures
After choosing a representation and a distance metric, the choice of matching procedure often follows naturally, as is the case in standard matching analyses. Exact and coarsened exact distance metrics provide their own matching procedure, while continuous distance metrics require both a distance formula and a caliper for specifying the maximum allowable distance at which two documents may be said to still match. The calipers may be at odds with the desired number of matches, as some treated units may have no control units within the chosen caliper, and may subsequently be “pruned” by many common matching procedures. Alternatively, researchers may allow any one treated unit to match multiple controls or may choose a greedy matching algorithm.
4 Experimental Evaluation of Text-Matching Methods
In the previous section, we presented different forms of representations for text data and described a number of different metrics for defining distance using each type of representation. Any combination of these options could be used to perform matching. However, the quantity and quality of matches obtained depend heavily on the chosen representation and distance metric. For example, using a small caliper might lead to only a small number of nearly exact matches, while a larger caliper might identify more matches at the expense of overall match quality. Alternatively, if CEM on an STM-based representation produces a large number of low-quality matches, applying the same procedure on a TDM-based representation may produce a smaller number of matches with more apparent similarities.
We investigate how this quantity versus quality trade-off manifests across different combinations of methods through an evaluation experiment performed with human subjects. Applying several variants of the matching procedure described in Section 3 to a common corpus, we explore how the quantity of matched pairs produced varies with different specifications of the representation and distance metric. Then, to evaluate how these choices affect the quality of matched pairs, we rely on evaluations of human coders.
In this study, we consider five distance metrics (Euclidean distance, Mahalanobis distance, cosine distance, distance in estimated propensity score, and coarsened exact distance) as well as 26 unique representations,Footnote 5 including nine different TDM-based representations, twelve different STM-based representations, and five Word2Vec embedding-based representations. Crossing these two factors produces 130 combinations, where each combination corresponds to a unique specification of the matching procedure described in Section 3. Among these combinations, five specifications are variants of the TIRM procedure developed in Roberts, Stewart, and Nielsen (Reference Roberts, Stewart and Nielsen2019). Specifications of each of the procedures are provided in Appendix B in the Supplement.
To compare the different choices of representation and distance metric considered here, we apply each combination to a common corpus to produce a set of matched pairs for each. We use a corpus of
 $N=3361$
news articles published from January 20, 2014 to May 9, 2015, representing daily front matter content for Fox News (
$N=3361$
news articles published from January 20, 2014 to May 9, 2015, representing daily front matter content for Fox News (
 $N=1796$
) and CNN (
$N=1796$
) and CNN (
 $N=1565$
).Footnote
6
The news source labels were used as the treatment indicator, with
$N=1565$
).Footnote
6
The news source labels were used as the treatment indicator, with
 $Z=1$
for articles published by Fox News and
$Z=1$
for articles published by Fox News and
 $Z=0$
for articles published by CNN.
$Z=0$
for articles published by CNN.
To match, we first calculate the distances between all possible pairs of treated and control units based on the specified representation and distance metric. Using the textmatch package in R (Mozer Reference Mozer2019b), each treated unit is then matched to a set of control units with whom its distance was within the specified caliper.Footnote 7 Using this procedure, 13 of the original 130 specifications considered did not identify any matched pairs. Each of the remaining 117 procedures identified between 23 and 1635 matched pairs of articles (with an average of 563 matched pairs per procedure). The union of matched pairs across all specifications resulted in 32,133 unique pairs of articles, where each unique pair was identified, on average, by 2 of the 117 different procedures. We view the frequency of each unique pair within the sample of 65,823 pairs identified as a rough proxy for match quality because, ideally when performing matching, the final sample of matched pairs identified will be robust to different choices of the distance metric or representation. Thus, we expect that matched pairs that are identified by multiple procedures will have higher subjective match quality than singleton pairs.
4.1 Measuring Match Quality
In standard applications of matching, if two units that are matched do not appear substantively similar, then any observed differences in outcomes may be due to poor match quality rather than the effect of treatment. The usual best practice is to calculate the overall balance between the treatment and control groups, which is typically measured by the difference-in-means for all covariates of interest. If differences on all matched covariates are small in magnitude, then the samples are considered balanced and thus, typically, well-matched.
As previously discussed, standard balance diagnostics typically fail to capture meaningful differences when applied to covariates that are summary measures of text. Further, due to the curse of dimensionality in these settings, it is likely that the comparison groups will have imbalances on at least some (and probably many) covariates. To measure match quality, we therefore rely on a unique property of text: its ease of interpretability. A researcher evaluating two units that have been matched on demographic covariates, for example, may be unable to verify the quality of a matched pair. However, depending on what aspects of text the researcher is substantively attempting to match on, human coders who are tasked with reading two matched text documents are typically capable of quantifying their subjective similarity when properly instructed. We leverage this property to measure match quality using an online survey of human respondents, where match quality is defined on a scale of 0 (lowest quality) to 10 (highest quality).
To obtain match quality ratings, we conducted a survey experiment using Amazon’s Mechanical Turk (MTurk) and the Digital Laboratory for the Social Sciences (DLABSS) (Enos, Hill, and Strange Reference Enos, Hill and Strange2016). Online crowd-sourcing platforms such as these have been shown to be effective for similarity evaluations in a number of settings (Mason and Suri Reference Mason and Suri2012). For instance, a study by Snow, O’Connor Jurafsky (Reference Snow, O’Connor, Jurafsky, Ng, Lapata and Tou Ng2008) who tasked nonexpert human workers on MTurk with five natural language evaluations reported a high degree of agreement between the crowd-sourced results and gold-standard results provided by experts. In the present study, respondents were first informed about the nature of the task and then given training on how to evaluate the similarity of two documents. After completing training, participants were then presented with a series of eleven paired newspaper articles, including an attention check and an anchoring question, and asked to assign a similarity rating. For each question, participants were instructed to read both articles in the pair and rate the articles’ similarity from zero to ten, where zero indicates that the articles are entirely unrelated and ten indicates that the articles are covering the exact same event. Snapshots of the survey are presented in Appendix C in the Supplement.
We might be concerned that an online convenience sample may not be an ideal population for conducting this analysis and that their perceptions of article similarity might differ from the overall population or from trained experts. To assess the reliability of this survey as an instrument for measuring document similarity, we leverage the fact that we performed two identical pilot surveys prior to the experiment using respondents from two distinct populations and found a high correlation (
 $\unicode[STIX]{x1D70C}=0.85$
) between the average match quality scores obtained from each sample. Additional details about this assessment are provided in Appendix D in the Supplement. We take note that these populations, MTurkers and DLABSS respondents, are both regularly used as coders to build training datasets for certain tasks in machine learning; the hallmark of these tasks is that they are easily and accurately performed by untrained human respondents. We argue that this task of identifying whether two articles discuss related stories falls squarely in this category, and our intercoder reliability test (described in Appendix D in the Supplement) supports this argument.Footnote
8
$\unicode[STIX]{x1D70C}=0.85$
) between the average match quality scores obtained from each sample. Additional details about this assessment are provided in Appendix D in the Supplement. We take note that these populations, MTurkers and DLABSS respondents, are both regularly used as coders to build training datasets for certain tasks in machine learning; the hallmark of these tasks is that they are easily and accurately performed by untrained human respondents. We argue that this task of identifying whether two articles discuss related stories falls squarely in this category, and our intercoder reliability test (described in Appendix D in the Supplement) supports this argument.Footnote
8
In an ideal setting, for each unique matched pair identified using the procedure described above, we would obtain a sample of similarity ratings from multiple human coders. Aggregating these ratings across all pairs in a particular matched dataset would then allow us to estimate the average match quality corresponding to each of the 130 procedures considered, with the quality scores for the 13 procedures that identified no matches set to zero. Though this is possible in principle, to generate a single rating for each unique matched pair requires that a human coder read both documents and evaluate the overall similarity of the two articles. This can be an expensive and time-consuming task. Thus, in this study, it was not possible to obtain a sample of ratings for each of the 32,133 unique pairs.
Instead, we took a stratified, weighted sample of pairs such that the resulting sample would be representative of the population of all 32,133 unique matched pairs as well as the population of 2,778,607 pairs of documents that were not identified by any of the matching procedures. Specifically, the sample was chosen such that each of the 130 matching procedures that identified a nonzero number of matches would be represented by at least four pairs in the experiment. For each stratum, the sampling weights for each pair were calculated proportional to the estimated match quality of that pair, calculated using a predictive model trained on human-coded data from a pilot experiment. We also sampled an additional 50 unique pairs from the pool of 2,778,607 pairs not identified by any matching procedures.
Ratings obtained from these pairs can be used to obtain a reference point for interpreting match quality scores. The resulting sample consisted of 505 unique pairs ranging the full spectrum of predicted match quality scores. Each respondent’s set of nine randomly selected questions were drawn independently such that each pair would be evaluated by multiple respondents. Using this scheme, each of the 505 sampled pairs was evaluated by between six and eleven different participants (average of nine). Question order was randomized, but the anchor was always the first question, and the attention check was always the fifth question.
We surveyed a total of 505 respondents. After removing responses from fifty-two participants who failed the attention check,Footnote 9 all remaining ratings were used to calculate the average match quality for each of the 505 sampled pairs evaluated. These scores were then used to evaluate each of the 130 combinations of methods considered in the evaluation, where the contribution of each sampled pair to the overall measure of quality for a particular combination of methods was weighted according to its sampling weight. This inferential procedure is described more formally in Appendix E of the Supplement.
4.2 Results
4.2.1 Which Automated Measures Are Most Predictive of Human Judgment About Match Quality?
Our primary research question concerns how unique combinations of text representation and distance metric contribute to the quantity and quality of obtained matches in the interest of identifying an optimal combination of these choices in a given setting. We can estimate the quality of the 130 matching methods considered in the evaluation experiment using weighted averages of the scores across the 505 pairs evaluated by human coders. However, it is also of general interest to be able to evaluate new matching procedures without requiring additional human experimentation. We also want to maximize the precision of our quality estimates for the 130 methods considered in this study. To these ends, we examine if we can predict human judgment about match quality based on the distance scores generated by each different combination of one representation and one distance metric. If the relationship between the calculated match distance and validated match quality is strong, then we may be confident that closely matched documents, as rated under that metric, would pass a human-subject validation study.
To evaluate the influence of each distance score on match quality, we take the pairwise distances between documents for each of the 505 matched pairs used in the evaluation experiment under different combinations of the representations and distance metrics described in Section 3. After excluding all CEM-based matching procedures, under which all pairwise distances are equal to zero or infinity by construction, all distances were combined into a dataset containing 104 distance values for each of the 505 matched pairs. Figure 1 gives six examples of how these distances correlate with observed match quality based on human ratings of similarity, along with the fitted regression line obtained from quadratic regressions of average match quality on distance. Here, the strong correlations suggest that automated measures of match quality could be useful for predicting human judgment. The particularly strong relationship between the cosine distance metric calculated over a TDM-based representation provides additional evidence in favor of matching using this particular combination of methods. These findings also suggest that the increased efficiency achieved with TDM cosine matching is not attributable to the cosine distance metric alone since the predictive power achieved using cosine distance on a Word2Vec (W2V) representation or an STM-based representation is considerably lower than that based on a TDM-based representation.

Figure 1. Distance between documents and match quality based on the cosine distance measured over a TDM-based representation (top left) exhibit a stronger relationship than cosine distance measured over both a W2V-based representation (top center) and an STM-based representation (top right), and a much stronger relationship than the Mahalanobis distance measured over a TDM-based representation (bottom left), a W2V-based representation (bottom center), or an STM-based representation (bottom right).
To leverage the aggregate relationship of the various machine measures of similarity on match quality, we developed a model for predicting the quality of a matched pair of documents based on the 104 distance scores, which we then trained on the 505 pairs evaluated in our survey experiment. For estimation, we use the Least Absolute Shrinkage and Selection Operator (LASSO) (Tibshirani Reference Tibshirani1996), implemented with tenfold cross-validation (Kohavi et al.
Reference Kohavi1995). Here, for each of the 505 pairs, the outcome was defined as the average of the ratings received for that pair across the human coders, and the covariates were the 104 distance measures. We also included quadratic terms in the model, resulting in a total of
 $p=208$
terms. Of these, the final model obtained from cross-validation selected 23 terms with nonzero coefficients and achieved 87.2% out-of-sample predictive accuracy. However, our results suggest that the majority of the predictive power of this model primarily comes from two terms: cosine distance over the full, unweighted TDM and cosine distance over an STM with 100 topics; see Appendix D in the Supplement for additional details.
$p=208$
terms. Of these, the final model obtained from cross-validation selected 23 terms with nonzero coefficients and achieved 87.2% out-of-sample predictive accuracy. However, our results suggest that the majority of the predictive power of this model primarily comes from two terms: cosine distance over the full, unweighted TDM and cosine distance over an STM with 100 topics; see Appendix D in the Supplement for additional details.
The high predictive accuracy of our fitted model suggests that automated measures of similarity could be effectively used to evaluate new matched samples or entirely new matching procedures without requiring any additional human evaluation.Footnote 10 We can also use it to enhance the precision of our estimates of match quality for the 130 matching methods considered in the evaluation experiment using model-assisted survey sampling methods (Sarndal, Swensson, and Wretman Reference Sarndal, Swensson and Wretman2003).
4.2.2 Which Methods Make the Best Matching Procedures?
To compare the performance of the final set of 130 matching procedures considered in our study, we, for each method, estimate the average quality of all pairs selected by that method. We increase the precision of these estimates using model-assisted survey sampling. In particular, we first use the predictive model described above to predict the quality of all matched pairs of a method. This average quality estimate is then adjusted by a weighted average of the residual differences between the predicted and the actual measured quality for those pairs directly evaluated in the human experiment. (The average quality scores for the thirteen procedures that identified no matches are all set equal to zero.) This two-step process does not depend on the model validity and is unbiased.Footnote 11 We assess uncertainty with a variant of the parametric bootstrap. See Appendix E in the Supplement for further details of the estimation approach and associated uncertainty quantification. Figure 2 shows the performance of each of the 130 procedures in terms of average predicted match quality vs. number of pairs identified, with uncertainty intervals estimated using a parametric bootstrap; see Appendix D in the Supplement for a tabular summary of these results. We group the procedures by the large-scale choices of representation and distance metric used. Within each tile of the larger plot are different procedures corresponding to different design decisions within a general approach like tuning parameters such as number of topics used in a topic model. As sensitivity check, see Appendix F in the Supplement for results using the simple weighted means of the sampled pairs of each method; results are broadly similar.

Figure 2. Number of matches found versus average model-assisted match quality scores for each combination of matching methods. Gray points indicate procedures with extreme reduction in information (e.g., procedures that match on only stop words). Blue circles highlight procedures that use existing state-of-the-art methods for text matching. One procedure with many low-quality pairs is excluded from this plot.
The methods which generally produce the highest quality matches for our study are those based on cosine distance calculated over a TDM-based representation. The method that produces the most matches out of all 130 procedures considered uses STM on ten topics with sufficient reduction and CEM in two bins and identifies over 1600 matched pairs. However, this method is among the lowest scoring methods in terms of quality, with a sample-adjusted average match quality of 0.81. Conversely, a procedure that uses STM on thirty topics with sufficient reduction and CEM in three bins appears to produce considerably higher quality matches, with an average match quality of 6.50 but identifies only eighty-one matched pairs. In comparison, a method that combines a bounded TDM with TF–IDF weighting with the cosine distance metric identified 579 matches with an average match quality of 7.08. This illustrates an important weakness of CEM: too few bins produce many low-quality matches, while too many bins produce too few matches, even though they are high quality. While in many applications there may be a number of bins which produce a reasonable number of good quality matches, that is not the case in our setting. Here, two bins produce poor matches, while three bins produce far too few. This trade-off does not appear to be present for matching procedures using cosine distance with a TDM-based representation, which dominate in both number of matches found and overall quality of those matched pairs. In addition, the matching procedures based on this combination appear to be more robust to various preprocessing decisions made when constructing the representation than procedures that use an alternative distance metric or representation, as illustrated by the tight clustering of the variants of this general approach on the plot.
Overall, our results indicate that, in our context, matching on the full vector of term counts (i.e., the unbounded TDM) produces both more and higher quality matches than matching on a vector of STM loadings when considering the content similarity of pairs of news articles. Moreover, TDM-based representations with cosine matching appear relatively robust to tuning parameters including choices of bounding and weighting schemes. STM-based representations appear somewhat more sensitive to tuning parameters, with representations that include a large number of estimated topics achieving higher average match quality than those constructed with fewer topics. This result provides further support for the findings in Roberts, Stewart, and Nielsen (Reference Roberts, Stewart and Nielsen2019), where the authors found that matching on more topics generally led to better results in terms of recovering pairs of nearly identical documents.
4.3 Evaluating Text-Matching Methods
In our applied examples, we find that text representations that use the TDM or Word2Vec embeddings paired with cosine distance achieve the best results in terms of maximizing predicted match quality and the quantity of matches identified. However, we stress that these results may not generalize to other applied settings. Applied researchers interested in performing text matching in their own analyses should therefore conduct their own systematic evaluations to determine which representations and distance metrics work best in their domains.
When attempting to control for textual confounding in a given setting, we recommend that researchers first implement a suite of text-matching procedures that includes a diverse set of representations and distance metrics. Matches identified by the different methods can then be compared to determine which procedure is most suitable for the given application. If there is substantial overlap across all methods, it may be that no evaluation is necessary. However, in most cases, the sets of matched pairs identified by each procedure will largely diverge. In this case, we recommend performing a formal evaluation, for instance using experimentation, to determine which methods most accurately and precisely capture the confounding features of interest.
Recall from our discussion in Section 2.3 that if important textual confounders can be easily extracted from the observed text data (e.g., by constructing indicator variables for a set of key terms), then these more general text-matching methods may not be necessary, strictly speaking. Rather, the approach we have described aims to create matched pairs of documents that contain similar information. This is akin to viewing mean balance as a proxy for covariate balance in classic matching. In cases where some confounding factors can be directly measured from the text, we recommend that researchers incorporate these variables into standard covariate balance assessments. After controlling for these variables, text-matching methods can then be applied to adjust for any remaining differences in the text that are not directly measurable.
If potential confounding truly hinges on the more complex and latent aspects of text, however, then one could ideally leverage human judgment to manually evaluate all possible matched pairs of documents. In our case, for example, we could, given unlimited resources, ask human coders to read through the entire corpus of news articles and label them according to which stories they cover. Even untrained human coders could reliably perform this type of evaluation. Such a task, of course, is generally not feasible, but we hope the methods described here provide an accurate and efficient approximation.
As we have seen, we can evaluate the success of human evaluation experiments by inverting the full human-coding procedure to generate a test: we identify a set of possible matches using automated text-matching methods and then present a carefully constructed sample of them to trained human coders. These human coders can then evaluate the sampled pairs of matched documents to determine which matches are systematically the most similar with regard to the targeted aspects of text. Using this information, we can then see how different automated measures of match quality align with human judgment about which matches are subjectively “best”. The general intuition behind this process is simple: to find documents that are descriptively similar using automated methods, we should first learn how humans evaluate text documents and what internal criteria they use to determine textual similarity. We can then identify machine methods that most closely mirror these qualitative decision rules. These insights can then be used to build a predictive model for match quality that approximates human judgment and allows us to make precise and efficient comparisons across large collections of text documents.
Thus, the human-coding task is of utmost importance, requiring both careful pretesting and substantial guidance to ensure the human coders attend to the aspects of text deemed most important as potential confounders. In particular, the primary concern is instructing the human coders to accurately and consistently evaluate similarity along the latent dimension of interest which may be challenging or impossible for human evaluators to reliably code in some contexts. For example, even two experienced medical doctors may systematically disagree in their readings of patient data such as X-rays (Steiner et al. Reference Steiner, MacDonald, Liu, Truszkowski, Hipp, Gammage, Thng, Peng and Stumpe2018). In such a scenario, it may still be possible to obtain reliable evaluations from experts and/or human coders with sufficient domain knowledge. This strategy is implemented in our second application, described in Section 5.2, where the latent dimension of interest considers whether a pair of matched doctor notes characterizes two patients whose conditions are equally severe. However, in other cases, human evaluations simply may not serve as a reliable ground truth to which automated text match quality may be compared. While the observed text may still offer important information about potential confounders in these cases, automated text-matching methods cannot be properly validated using this framework.
5 Applications
5.1 Decomposing Media Bias
While American pundits and political figures continue to accuse major media organizations of “liberal bias,” scholars, after nearly two decades of research on the issue, have yet to come to a consensus about how to measure bias, let alone determine its direction. A fundamental challenge in this domain is how to disentangle the component of bias relating to how a story is covered, often referred to as “presentation bias” (Groseclose and Milyo Reference Groseclose and Milyo2005; Gentzkow and Shapiro Reference Gentzkow and Shapiro2006; Ho et al. Reference Ho and Quinn2008; Gentzkow and Shapiro Reference Gentzkow and Shapiro2010; Groeling Reference Groeling2013), from the component relating to what is covered, also known as “selection bias” (Groeling Reference Groeling2013) or “topic selection.” In particular, systematic comparisons of how stories are covered by different news sources (e.g., comparing the level of positive sentiment expressed in the article) may be biased by differences in the content being compared. We present a new approach for addressing this issue by using text matching to control for selection bias.
We analyze a corpus consisting of
 $N=9903$
articles published during 2013 by each of the thirteen popular online news outlets.Footnote
12
These data were collected and analyzed in Budak, Goel, and Rao (Reference Budak, Goel and Rao2016) and are posted on the Deep Blue Data repository offered by the University of Michigan (Budak, Goel, and Rao Reference Budak, Goel and Rao2019). The news sources analyzed here consist of Breitbart, CNN, Daily Kos, Fox News, Huffington Post, The Los Angeles Times, NBC News, The New York Times, Reuters, USA Today, The Wall Street Journal, The Washington Post, and Yahoo. In addition to the text of each article, the data include labels indicating each article’s primary and secondary topics, where these topics were chosen from a set of fifteen possible topics by human coders in a separate evaluation experiment performed by Budak, Goel, and Rao (Reference Budak, Goel and Rao2016).
$N=9903$
articles published during 2013 by each of the thirteen popular online news outlets.Footnote
12
These data were collected and analyzed in Budak, Goel, and Rao (Reference Budak, Goel and Rao2016) and are posted on the Deep Blue Data repository offered by the University of Michigan (Budak, Goel, and Rao Reference Budak, Goel and Rao2019). The news sources analyzed here consist of Breitbart, CNN, Daily Kos, Fox News, Huffington Post, The Los Angeles Times, NBC News, The New York Times, Reuters, USA Today, The Wall Street Journal, The Washington Post, and Yahoo. In addition to the text of each article, the data include labels indicating each article’s primary and secondary topics, where these topics were chosen from a set of fifteen possible topics by human coders in a separate evaluation experiment performed by Budak, Goel, and Rao (Reference Budak, Goel and Rao2016).
The data also include two human-coded outcomes that measure the ideological position of each article on a 5-point Likert scale. Specifically, human workers tasked with reading and evaluating the articles were asked “on a scale of 1–5, how much does this article favor the Republican party?”, and similarly, “on a scale of 1–5, how much does this article favor the Democratic party?”Footnote 13
To perform matching on this data, we use the optimal procedure for identifying articles that cover the same underlying story identified by our prior evaluation experiment: cosine matching on a bounded TDM.Footnote 14 Because in this example we have a multivalued treatment with thirteen levels, each representing a different news source, we follow the procedure for template matchingFootnote 15 described in Silber et al. (Reference Silber, Rosenbaum, Ross, Ludwig, Wang, Niknam, Mukherjee, Saynisch, Even-Shoshan and Kelz2014) to obtain matched samples of 150 articles from each news source. Briefly, the template matching procedure first finds a representative set of stories across the entire corpus and then uses that template to identify a matched sample of similar articles within each source that collectively cover this canonical set of topics. This allows us to identify a subset of articles within each source that are all similar to the same template and therefore similar to each other.
Before matching, our estimates of a news source’s average favorability are a measure of overall bias, which includes biases imposed through differential selection of content to publish as well as biases imposed through the language and specific terms used when covering the same content. The matching controls selection biases due to some sources selecting different stories that may be more or less favorable to a given party than other stories. Differences in estimated favorability on the matched articles can be attributed to presentation bias. The difference between estimates of average favorability before matching (overall bias) and estimates after matching (presentation bias) therefore represents the magnitude of selection biases imposed by the sources. Large differences between prematched and postmatched estimates indicate a stronger influence of selection bias relative to presentation bias.
Figure 3 shows the average favorability toward Democrats (blue) and Republicans (red) for each news source overall and the average favorability among the template matched documents. Arrows begin at the average score before matching and terminate at the average score after matching. The length of the arrows is the estimated magnitude of the bias of each source that is attributable to differences in selection.
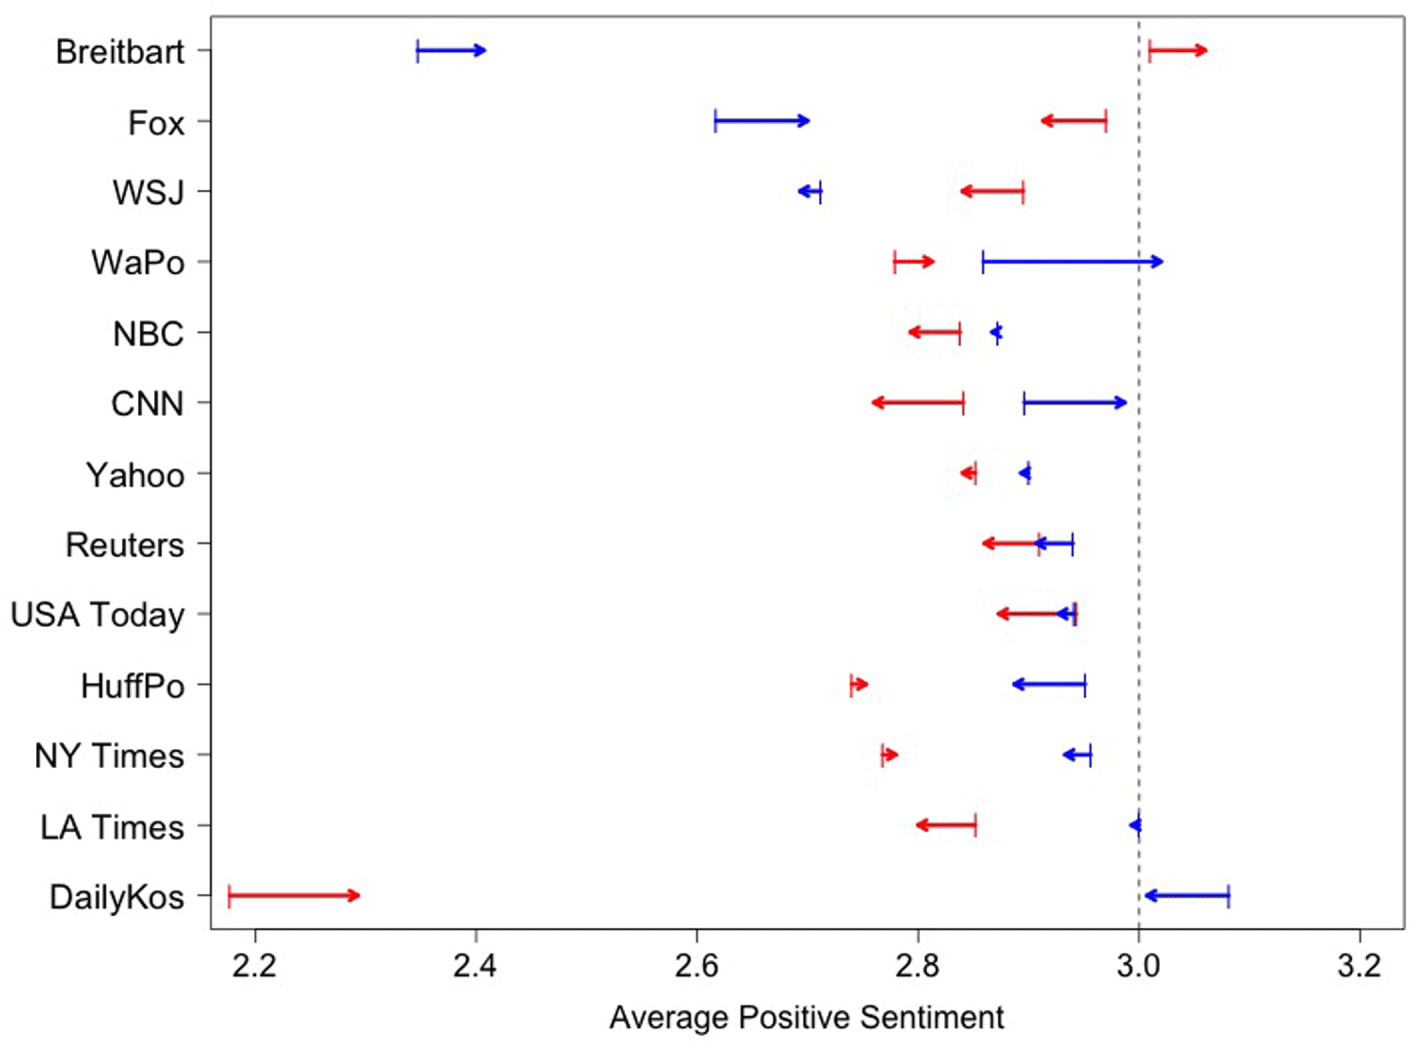
Figure 3. Estimates of average favorability toward Democrats (blue) and Republicans (red) for each source both before and after matching.
Before discussing the pattern of shifts, we first look at overall trends of favorability across sources. First, overall sentiment toward Republicans generally hovers around 2.8–3.1, slightly less, on average, than the partisan neutrality of
 $x=3$
, which corresponds to a response of “neither favorable nor unfavorable.” The one exception is the Daily Kos, which is unfavorable. Other sources (the Huffington Post, the NY Times, and the LA Times) are at the low end of this range, indicating some negative sentiment. For the Democrats, there is somewhat more variation, however, with Breitbart being the least favorable, followed by Fox and WSJ, and the Daily Kos being the most favorable. Furthermore, it is primarily the more extreme sources that show selection effects. Breitbart, Fox and the Washington Post, for example, all become more positive toward Democrats when we adjust for story. This suggests that they tend to select stories that are biased more toward Republicans and away from Democrats, a selection bias effect. The Daily Kos, the Huffington Post, and the New York Times show similar selection bias effects in the opposite directions. The remaining sources do not appear to be significantly impacted by controlling for selection.
$x=3$
, which corresponds to a response of “neither favorable nor unfavorable.” The one exception is the Daily Kos, which is unfavorable. Other sources (the Huffington Post, the NY Times, and the LA Times) are at the low end of this range, indicating some negative sentiment. For the Democrats, there is somewhat more variation, however, with Breitbart being the least favorable, followed by Fox and WSJ, and the Daily Kos being the most favorable. Furthermore, it is primarily the more extreme sources that show selection effects. Breitbart, Fox and the Washington Post, for example, all become more positive toward Democrats when we adjust for story. This suggests that they tend to select stories that are biased more toward Republicans and away from Democrats, a selection bias effect. The Daily Kos, the Huffington Post, and the New York Times show similar selection bias effects in the opposite directions. The remaining sources do not appear to be significantly impacted by controlling for selection.
We performed a series of sensitivity checks to assess the stability of our results to different specifications of the matching procedure and/or different choices of template sample. We also examine the variability due to randomly matching documents to assess how much estimation uncertainty is present in our analysis. Details of these analyses are provided in Appendix G in the Supplement. Generally, we see that estimating the selection effect of an individual source is difficult and that the magnitude of the selection effects tends to be small, indicating that the choice of what stories to cover is not driving the overall favorability ratings. In other words, most differences in favorability appear to be driven by presentation bias.
5.2 Improving Covariate Balance in Observational studies
In our second application, we demonstrate how text matching can be used to strengthen inferences in observational studies with text data. Specifically, we show that text matching can be used to control for confounders measured by features of the text that would otherwise be missed using traditional matching schemes.
We use a subset of the data first presented in Feng et al. (Reference Feng, McSparron, Kien, Stone, Roberts, Schwartzstein, Vieillard-Baron and Celi2018), which conducted an observational study designed to investigate the causal impact of bedside transthoracic echocardiography (TTE), a tool used to create pictures of the heart, on the outcomes of adult patients in critical care who are diagnosed with sepsis. The data were obtained from the Medical Information Mart for Intensive Care (MIMIC) database (Johnson et al. Reference Johnson, Pollard, Shen, Li-wei, Feng, Ghassemi, Moody, Szolovits, Celi and Mark2016) on 2401 patients diagnosed with sepsis in the medical and surgical intensive care units at a Massachusetts Institute of Technology university hospital located in Boston, Massachusetts. Within this sample, the treatment group consists of 1228 patients who received a TTE during their stay in the ICU (defined by time stamps corresponding to times of admission and discharge) and the control group is composed of 1173 patients who did not receive a TTE during this time. For each patient, we observe a vector of pretreatment covariates including demographic data, lab measurements, and other clinical variables. In addition to these numerical data, each patient is also associated with a text document containing intake notes written by nursing staff at the time of ICU admission.Footnote 16 The primary outcome in this study was 28-day mortality from the time of ICU admission.
Because the treatment in this study was not randomly assigned, patients in the treatment and control groups may differ systematically in ways that affect both their assignment to treatment versus control and their 28-day mortality. For instance, patients who are in critical condition when admitted to the ICU may die before treatment with a TTE being considered. Similarly, patients whose health conditions quickly improve after admission may be just as quickly discharged. Therefore, in order to obtain unbiased estimates of the effects of TTE on patient mortality, it is important to identify and appropriately adjust for any potentially confounding variables such as the degree of health at the time of admission.
We apply two different matching approaches to this data: one that matches patients only on numerical data and ignores the text data, and one that matches patients using both the numerical and text data. In the first procedure, following Feng et al. (Reference Feng, McSparron, Kien, Stone, Roberts, Schwartzstein, Vieillard-Baron and Celi2018), we match treated and control units using optimal one-to-one matching (Hansen and Klopfer Reference Hansen and Klopfer2006) on estimated propensity scoresFootnote 17 . We enforce a propensity score caliper equal to 0.1 standard deviations of the estimated distribution, which discards any treated units for whom the nearest control unit is not within a suitable distance. In the second approach, we perform optimal one-to-one text matching within propensity score calipers. Intuitively, this procedure works by first, via the calipers, reducing the space of possible treated–control pairings in a way that ensures adequate balance on numerical covariates. By then performing text matching within this space to select a specific match given a set of candidate matches all within the calipers, we obtain matched samples that are similar with respect to all observed covariates, including the original observed covariates and any variables that were not recorded during the study but can be estimated by summary measures of the text.
Identifying the optimal text-matching method here requires careful consideration of how text similarity should be defined and evaluated in this medical context. Here, the ideal text-matching method is one that matches documents on key medical concepts and prognostic factors that could both impact the choice of using TTE as well as the outcome (i.e., potential confounders) that are captured within the text data. Unlike in the previous application, these features cannot be reliably evaluated by nonexpert human coders due to the domain expertise and familiarity with medical jargon necessary to make comparisons between medical documents. Thus, to perform a systematic evaluation of text-matching methods in this study, we adopt an information retrieval approach for comparing medical texts that has been widely applied in the biomedical literature (Aronson Reference Aronson2001; Zeng et al. Reference Zeng, Tse, Divita, Keselman, Crowell, Browne, Goryachev and Ngo2007).
In particular, by consulting with medical professionals, we first obtained a mapping of the texts to a set of clinically meaningful concepts that could be used to characterize ICU patients. Following the approach of MacLean and Heer (Reference MacLean and Heer2013), we then calculated the Jaccard similarity over this mapping between matched pairs of documents as an omnibus measure of match quality. We treat these scores as a working gold standardFootnote 18 for this particular application; these scores are based on careful consideration from domain experts who have the medical background required to extract potentially confounding information from this type of nuanced text. We therefore calculated the average pairwise Jaccard similarity achieved after matching (within propensity score calipers based on the numerical covariates) using each of 130 text-matching specifications described in Section 3. Results of this systematic evaluation indicated that the best-performing procedure uses the cosine distance calculated over a bounded TDM, where treated units whose nearest control is outside the specified caliper are discarded. See Appendix H in the Supplement for additional details.
Figure 4 shows the covariate balance between treatment and control groups on both quantitative and text-based covariates before matching, after PSM on numeric covariates alone, and after text matching using our preferred method (using cosine distance on a bounded TDM) within propensity score calipers. Here, each of the five text-based covariates represents summary measuresFootnote 19 of the observed text documents. These variables, according to medical experts consulted on this project, all could indicate potential confounds that could bias estimates of impact if not controlled. Our general text-matching methods do not directly balance these covariates; the improved balance is a consequence of matching on the overall distance metric and representation used.

Figure 4. Standardized differences in means with 95% confidence intervals between treatment and control groups on twenty-six numerical covariates and five text-based covariates (denoted by *) before matching (gray), after propensity score matching (red), and after text matching (blue).
In general, common wisdom (e.g., Imbens and Rubin (Reference Imbens and Rubin2015)) is to condition on all available data that could indicate potential confounding influences when making inferences using observational data. While PSM is able to adequately balance the numerical covariates and some of the text-based covariates most correlated with these numerical measures, it fails to sufficiently adjust for differences between treatment and control groups on a number of potential confounders captured only by the text. For instance, both the unmatched data and the matched sample generated using PSM have large imbalances between treatment and control groups on references to Lasix, a medication commonly used to treat congestive heart failure. In the unmatched sample, only 10% of treated units have documents containing references to this medication compared to 28% of control units who are associated with the medication. Matching on the estimated propensity scores reduces this imbalance only slightly, while cosine matching within propensity score calipers shows a considerable improvement in the balance achieved between treatment groups on this variable. Incorporating the text data into the matching procedure leads to similar improvements in balance for the other five text-based variables while also maintaining suitable overall balance on the numerical covariates.
Table 1. Survival rates for treatment and control groups and estimated treatment effects before and after propensity score matching (PSM) and text matching within propensity score calipers.

Table 1 summarizes the survival rates in the treatment and control groups within each matched sample along with the effective sample sizes (i.e., the equivalent number of matched pairs) in the final matched samples. Generally, there appears to be some confounding, with the adjusted impacts being larger than the naïve differences. The matched sample identified using text matching is slightly larger in terms of effective sample size than simple PSM, although they are not significantly different. This increase in effective sample size highlights the efficiency of text matching; when evaluating multiple controls that are eligible matches for a single treated unit in terms of quantitative covariates, the text-based distance offers a more refined measure of pairwise similarity than distances based on the propensity score. Further, when text matching within propensity score calipers, small differences in estimated propensity scores across controls will be offset by any large differences in text. In the present application, this allows for more precise and efficient optimization of the matched sample.
Of course, conducting a matched analysis is rooted in thoughtful design. In particular, the researcher must decide which variables are important potential confounders and which are not. This is especially important when balancing the trade-offs between achieving better balance on some variables at the expense of others. The purpose of highlighting text matching in this context is to demonstrate how information from the text can also be included in these decisions about what aspects of the data to consider. If the text is deemed not informative, then of course it should not be an important consideration when matching. But, as in this case, if the text is considered to indicate significant aspects of patient condition that should be attended to, the general matching procedures we have discussed can provide a way forward. And if it is uncertain what is important, then sensitivity checks that focus balance on different groups of variables can further strengthen causal claims in these contexts.
6 Discussion
In this paper, we have made three primary contributions. First, we have provided guidance for constructing different text-matching methods and evaluating the match quality of pairs of documents identified using such methods. Second, we empirically evaluated a series of candidate text-matching procedures constructed using this framework along with the methods developed in Roberts, Stewart, and Nielsen (Reference Roberts, Stewart and Nielsen2019). Third, we have applied our methods to a dataset of news media to engage with a long-standing debate in political science about the composition of bias in news and to an observational study evaluating the effects of a medical intervention.
Text matching is widely applicable in the social sciences. Roberts, Stewart, and Nielsen (Reference Roberts, Stewart and Nielsen2019) show how text matching can produce causal estimates in applications such as international religious conflict, government-backed internet censorship, and gender bias in academic publishing. We believe that the framework presented in this paper will help expand the scope and usability of text matching even further and will facilitate investigation of text data across a wide variety of disciplines. For instance, the methods described here could enhance state-of-the-art techniques for plagiarism detection and text reuse, techniques that are widely used in political science. By identifying bills that are textually similar to an original legislative proposal, our approach could be used to improve upon work tracking the spread of policy through state legislatures (Kroeger Reference Kroeger2016); and by comparing social media posts to a matched source article, our methods could detect the dispersion of false news topics through a social network. Second, our framework could be used to construct networks of lexical similarity, for instance, of news sources, politicians, or national constitutions. Also, the metrics we consider for measuring text similarity could themselves resolve measurement problems in cases where lexical divergence is the quantity of interest, for example, in cases of studying ideological polarization or bureaucratic discretion (Peterson and Spirling Reference Peterson and Spirling2018; Kaufman Reference Kaufman2020).
We urge, however, that researchers consider how similar their use cases are to ours when extrapolating from results based on our evaluation experiments. In particular, while cosine distance and TDM-based representations produced high-quality results in both of our applied examples, this finding should not be taken as conclusive evidence that these choices are the best in any application of text matching. Further, we emphasize to researchers that the results of our human evaluation experiment depend on the crucial assumption that humans are able to distinguish between textual differences that represent potential confounders, which may bias inferential results if not appropriately controlled for and extraneous differences that are not relevant for the purposes of inference. This assumption may not be plausible in all settings, and we therefore encourage future researchers to conduct their own evaluation studies, especially when using text matching to control for linguistic features other than content similarity, for example, stylistic, topic, tone, or semantic similarity. We hope such future evaluations, in connection with this one, will advance our collective understanding of best practices in this important domain.
Acknowledgements
The authors gratefully acknowledge the following for their feedback and suggestions on previous versions of this work: Molly Roberts, Justin Grimmer, Brandon Stewart, participants of the Miratrix Causality, Applications, and Research in Education and Statistics (CARES) Lab at Harvard University, and audiences at the Harvard Applied Statistics Workshop, PolMeth 2018, and Text as Data 2018. We also thank the anonymous reviewers, whose feedback led to important enhancements in this work, as well as Leo Celi and Mornin Feng, who graciously provided data for the medical application.
Data Availability Statement
Replication materials for this paper are posted to the Dataverse of Political Analysis (Mozer Reference Mozer2019a).
Supplementary material
For supplementary material accompanying this paper, please visit https://doi.org/10.1017/pan.2020.1.


