


Survey research plays a critical role in informing political decision-making (Page and Shapiro Reference Page and Shapiro1983). However, surveys can be too slow to adapt to changing information environments, especially in societies marked by social and political heterogeneity. First, surveys may struggle to identify and prioritize emerging issues. This is especially salient in the context of elections, where campaign-related events, foreign policy incidents, or unexpected economic developments are typical occurrences. The inherent lag time between recognizing issues as they arise and fielding a survey can lead to missed opportunities for capturing real-time opinion shifts. Second, there is often uncertainty about which questions from a larger set should be included in a survey. Third, there can be a disconnect between how researchers and participants interpret the same survey questions - an issue that is especially acute when studying minority groups, whose perspectives may diverge from mainstream viewpoints.Footnote 1
In this paper, I propose a crowdsourced adaptive survey methodology (CSAS) that leverages advances in natural language processing and adaptive algorithms to create participant-generated questionnaires that evolve over time. I use open-ended responses from participants to create question banks comprised of potential survey questions, from which questions are prioritized using a multi-armed bandit algorithm. While the survey is in the field, participants contribute to the question bank and respond to questions submitted by other participants, enabling the algorithm to explore and prioritize survey questions that resonate with the sample. Even in well-trodden settings such as identifying salient issues, the CSAS method produces promising items that warrant further investigation (see Figure 1 for a summary of the process and representative issues recovered using the method).
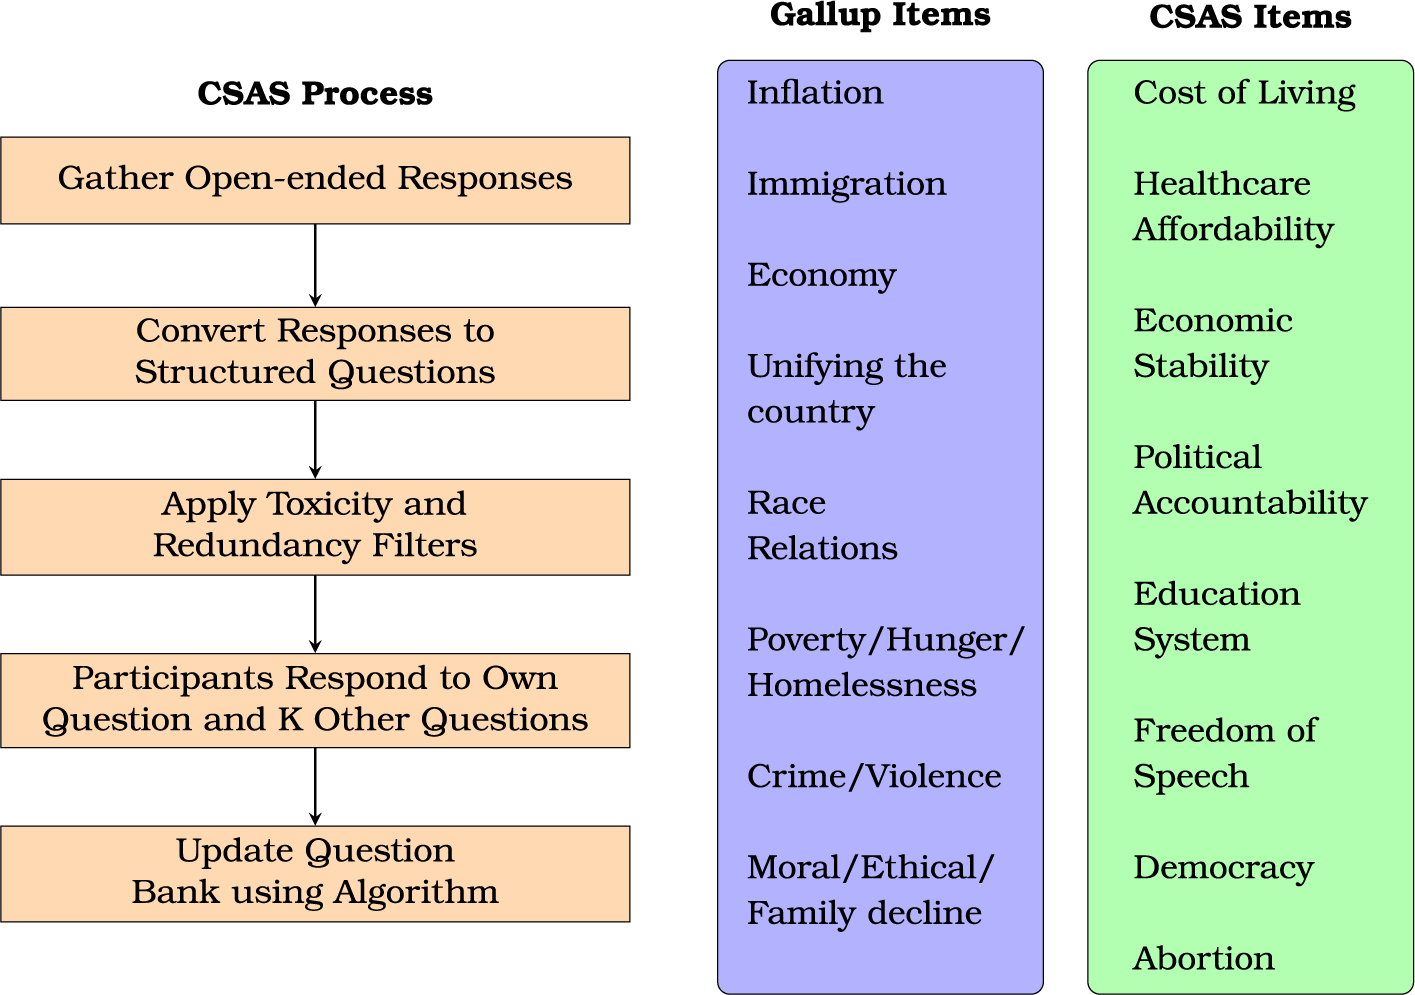
Figure 1 CSAS process flowchart and representative set of issues uncovered by CSAS.
I apply this methodology across three domains: gauging the prevalence of false beliefs among Latinos, measuring issue salience, and identifying local political concerns. First, I use CSAS to develop an evolving battery of issues to gauge issue importance in the aggregate. Despite seeding the algorithm with Gallup issue categories, I find that popular issue topics based on open-ended responses depart from the set of “most important issues,” reflecting concerns over healthcare, inflation, political accountability, and crime.Footnote 2 Then, I move to more niche applications: misinformation within the Latino community and local political concerns. I find that CSAS reveals claims and issues that would likely escape the notice of survey researchers.
The advantages of CSAS are threefold. First, it enables survey researchers to capture trends in public opinion in real-time, reflecting the public’s evolving beliefs and concerns. Second, it allows survey researchers to apply a more inductive approach to questionnaire construction. Finally, it democratizes the survey process by allowing respondents to contribute to instruments. These benefits come at little cost in terms of survey length. Researchers can set the number of “dynamic questions” in advance, and select the appropriate algorithm for determining how questions should be prioritized. For example, one can rely on a set of tried-and-true items, while allocating a few survey slots for dynamic questions.
Beyond applications to misinformation and issue importance, the method can be applied to research topics such as social movements, public reactions to unfolding political events, and political representation, among others. By enabling researchers to adapt survey instruments to changing information environments and democratizing the survey process, the CSAS approach could provide new insights into political behavior and complement traditional survey methods across various sub-fields in political science.
1 Dynamic Survey Methodologies: Existing Approaches
Influential texts on survey design stress the importance of a “tailored” approach to recruitment and stimuli, where survey materials are adapted to populations under study (Dillman, Smyth, and Christian Reference Dillman, Smyth and Christian2014). Adapting questionnaires to respondents can enhance measurement and participant satisfaction. For instance, branching questions can reduce respondent burden and measurement error by eliminating irrelevant sub-questions (Dillman and Christian Reference Dillman and . Christian2005; Krosnick and Berent Reference Krosnick and Berent1993). Questions measuring recognition of elected officials and voting in sub-federal elections can be tailored using location to produce more relevant question content
 $via$
“piped in” text that is automatically shown to participants in online surveys (Ansolabehere and Schaffner Reference Ansolabehere and Schaffner2009). These examples illustrate how surveys already possess dynamic elements that respond to user input or data.
$via$
“piped in” text that is automatically shown to participants in online surveys (Ansolabehere and Schaffner Reference Ansolabehere and Schaffner2009). These examples illustrate how surveys already possess dynamic elements that respond to user input or data.
1.1 Computerized Adaptive Tests
Scholars have recently developed methods for carrying out computerized adaptive tests (CATs) in public opinion surveys (Montgomery and Cutler Reference Montgomery and Cutler2013; Montgomery and Rossiter Reference Montgomery and Rossiter2020, Reference Montgomery and Rossiter2022). CAT algorithms “respond to individuals’ prior answers by choosing subsequent questions that will place them on the latent dimension with maximum precision and a minimum number of questions.” (p. 173). CATs are typically employed using latent scales, where the goal is to optimize the number of questions. Montgomery and Cutler show that CATs offer a superior approach to traditional static batteries, and these tools can be easily implemented in survey software such as Qualtrics (Montgomery and Rossiter Reference Montgomery and Rossiter2022).
CATs rely on pre-existing measurement scales (e.g., political knowledge, personality batteries). However, in settings where the objective is to capture novel issues or changes in the information environment, scholars and practitioners may want to learn about the prevalence of discrete beliefs, some of which cannot be known in advance. Thus, while CATs allow us to enhance precision when estimating latent traits or ideal points, there are settings where the question bank cannot be fixed in advance and describing the nature of discrete items, rather than estimating positions on latent scales, is the primary objective. These settings include misinformation research, where survey questions draw from fact-checking sources and social media data, and studies of elections and campaigns, where events and shifts in news coverage are integral to understanding the dynamics of races.
1.2 Wiki Surveys
Wiki surveys are a collaborative survey methodology where users help shape instruments (Salganik and Levy Reference Salganik and Levy2015). Drawing inspiration from online information aggregation portals such as Wikipedia, wiki surveys balance three principles: greediness, collaborativeness, and adaptivity. Greediness refers to capturing as much information as respondents are willing to provide; collaborativeness refers to allowing respondents to modify instruments (e.g., proposing new items); and adaptivity refers to optimizing instruments to select the “most useful information.” While wiki surveys have shown promise in facilitating collective decision making (e.g., allowing users to vote on policies—both pre-determined and user-generated—that should be considered by local governments), existing applications rely on pairwise comparisons between options provided by survey designers and participants. However, pairwise comparisons may not be useful in settings where options can be accorded the same weight, the decision is not zero-sum, and outcomes can be more accurately measured on an ordinal or continuous scale.
2 The Crowdsourced Adaptive Survey Method
Building on the wiki survey and other attempts to insert dynamic elements into existing surveys (e.g., CAT approaches), I develop a method that enables question banks to evolve based on user input and does not impose constraints on question formats. I use generative pre-trained transformers (GPTs) to convert participants’ open-ended responses into structured questionnaire items (see Velez and Liu (Reference Velez and Liu2024) for an example). I then employ adaptive algorithms (Offer-Westort, Coppock, and Green Reference Offer-Westort, Coppock and Green2021) to identify the “best-performing” questions from the question bank.Footnote 3 First, each respondent answers an open-ended question about a given topic that is cleaned, summarized, and converted into a structured survey question format. Second, respondents respond to their own questions, along with k other questions from a question bank generated by previous participants. Finally, ratings for user-submitted questions and k questions drawn from the question bank are updated using a multi-armed bandit algorithm, adjusting the probabilities of presenting these questions to future participants in subsequent surveys.Footnote 4
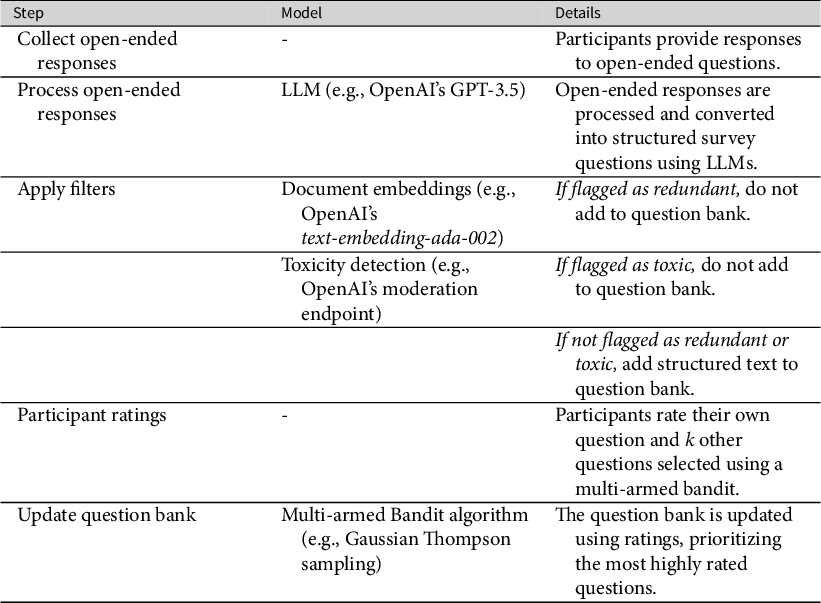
The three essential features of the proposed method are open-ended questions, a question bank, and an algorithm for updating question selection probabilities. Table 1 displays the different steps of the CSAS method: eliciting potential items using open-ended questions; processing and filtering candidate items; and optimizing question selection. I walk through each step in turn.
Table 1 Overview of the CSAS methodology.
The open-ended question is used to query participants in a free-form manner about a given topic, issue, or claim. Since these data will be unstructured, introducing heterogeneity on dimensions such as length, style, and grammar, a response conversion stage is typically necessary. For example, given that Likert scale questions in public opinion surveys tend to be brief, one can convert an open-ended response of arbitrary length into a sentence-long summary using a GPT. GPTs are large-parameter language models that can perform various tasks such as text prediction, summarization, and classification at levels that mirror human performance (Radford et al. Reference Radford, Narasimhan, Salimans and Sutskever2018; Vaswani et al. Reference Vaswani, Shazeer, Parmar, Uszkoreit, Jones, Gomez, Kaiser and Polosukhin2017). Recent years have seen the development of a diverse range of GPTs, with proprietary models like OpenAI’s GPT-4, Anthropic’s Claude, and Google’s Gemini demonstrating robust capabilities across various text manipulation, summarization, and generation tasks. In parallel, “open source” and “open weights” models, including Meta’s LLaMA and Mistral AI’s Mixtral, have emerged, offering competitive performance in similar domains (see Appendix E of the Supplementary Material, for a detailed discussion and direct comparison of these models).
Once open-ended response data are in a usable, structured format, they can be included in a question bank. Though inclusion of questions can be unrestricted at this stage, researchers may want to impose additional constraints to reduce redundant questions and apply filters to ensure that survey questions meet the researcher’s objectives (e.g., reducing toxicity, increasing relevance).
Focusing on redundancy first, if two respondents submit responses about Democratic spending priorities with only minor differences in wording, it may be unnecessary to include both questions. Moreover, multi-armed bandit algorithms can struggle to identify the best-performing arm when arms are equally matched (i.e., a “no clear winner” scenario). Assuming near-identical questions are rated similarly, this increases the odds of failing to identify the best-performing item (Offer-Westort et al. Reference Offer-Westort, Coppock and Green2021, 832–833). Because open-ended responses are rarely exact duplicates, more sophisticated NLP methods (e.g., document embeddings) can be used to filter near-duplicates. Document embeddings locate texts on a high-dimensional space and can be used to identify similarities between texts (Rheault and Cochrane Reference Rheault and Cochrane2020). By applying document embeddings, researchers can quantify the similarity between different questions even when the wording varies, and retain only questions that surpass a pre-defined threshold of uniqueness.
Researchers may also want to apply additional filters to ensure that questions meet pre-specified criteria on dimensions such as relevance and toxicity. For example, for a survey of issue importance, a survey researcher may choose to exclude responses referring to the personal characteristics of politicians. Given that this is a classification task, one may opt for a supervised learning model trained on a labeled dataset or a GPT model, among other options. The same holds for identifying and removing toxic responses. Given that a small percentage of respondents resort to “trolling” behavior, ensuring other participants are not exposed to harmful content is important (Lopez and Hillygus Reference Lopez and Hillygus2018).
The next challenge lies in how questions are presented and selected within the survey, balancing between identifying “best-performing items” (exploitation) and examining the full set of candidate items (exploration). This entails the use of an algorithm that takes a set of candidate items and determines how those items are presented to participants. In some domains, such as misinformation or issue salience, prioritizing popular claims or important issues may be crucial. Conversely, in fields like personality research, capturing the full spectrum of trait variation, including low-prevalence items, is more important. In the latter case, uniform sampling from the question bank could be useful (see Appendix J of the Supplementary Material).
Across the three applications presented in this paper, I focus on identifying the “best-performing” survey questions, defined as those with higher mean scores for the respective measures. I employ multi-armed bandit (MAB) algorithms, specifically Gaussian Thompson sampling, to prioritize item selection. These algorithms balance two key objectives: exploitation (focusing on questions that show promise) and exploration (testing additional questions to assess their potential). MAB algorithms typically use outcome measures to guide the assignment of participants to different conditions (or, in our case, questions), prioritizing those that score higher on predetermined metrics (e.g., mean scores). Through this iterative process, Thompson sampling efficiently allocates more participants to questions that “resonate” more with the sample.
3 An Application to Issue Salience
In contrast to conventional approaches that use pre-defined issues to study issue importance (see Ryan and Ehlinger (Reference Ryan and Ehlinger2023) for a critique), CSAS can be used to produce a dynamic slate of issues. This can be helpful in estimating support for idiosyncratic issues that may not appear on the national agenda, but still inspire strong reactions among “issue publics” (Elliott Reference Elliott2020) or serve as issues that could be mobilized in the future, corresponding to the elusive notion of “latent opinion” described in Key (Reference Key1961).
Since 1935, Gallup’s Most Important Problem (MIP) question has been used to identify the issue priorities of the American public. Using an open-ended format, participants are asked “What do you think is the most important problem facing this country today?,” with responses being hand-classified into a set of categories corresponding to broad issue or policy areas. Despite its adoption in public opinion research, the measure has been criticized for being an imperfect proxy of salience. As Wlezien (Reference Wlezien2005) argues, the question asks respondents to provide information on two distinct concepts—importance and “problem status.” While some respondents may interpret the question as one where they can offer a personally relevant issue, others may interpret it as an opportunity to highlight a problem affecting the nation as a whole.
More recently, Ryan and Ehlinger (Reference Ryan and Ehlinger2023) make a case for moving beyond both fixed closed-ended questions and hand-coded classifications of open-ended questions when measuring issue importance. Like the MIP, Ryan and Ehlinger (Reference Ryan and Ehlinger2023) use open-ended questions to elicit issue positions from participants. However, they ask participants to directly reflect on issues of personal importance. Moreover, in contrast to the typical MIP method, they obtain closed-ended measures of personal importance for the issues elicited using the open-ended method. This approach provides a richer amount of information about the degree to which an elicited issue may hold importance to an individual. Recent studies in this vein have recovered high levels of stability (Velez and Liu Reference Velez and Liu2024) and sizable causal effects for this “core issue” in conjoint settings (Ryan and Ehlinger Reference Ryan and Ehlinger2023; Velez Reference Velez2023).
Applying CSAS in this context is straightforward. Participants report personally relevant issues using open-ended responsesFootnote 5 ; open-ended responses are transformed into a structured question and included in a question bank; and participants respond to the different issue topics in an issue importance battery, with Gaussian Thompson sampling used to optimize question selection. I seed the question bank with a set of eight Gallup items that were popular at the time and assess whether the crowdsourced issue topics receive higher importance ratings. The issues were the following: “Immigration”, “Economy”, “Race Relations”, “Poverty”, “Crime”, “Ethics, Moral, and Family Decline”, “Unifying the country”, and “Inflation.”
From September 11 to September 13, 2023, I collected data from a national quota sample balanced on age, race, and gender using CloudResearch Connect (N = 820). CloudResearch Connect provides a low-cost, high-quality online convenience sample. Its demographic representativeness is comparable to other popular sample providers such as Prolific (Stagnaro et al. Reference Stagnaro, Druckman, Berinsky, Arechar, Willer and Rand2024).Footnote 6 OpenAI’s GPT-4 was instructed to convert unstructured text into issue topics and filter out irrelevant or redundant topics.Footnote 7 This was accomplished using a retrieval-augmented generation (RAG) pipeline. This process involved retrieving the five nearest neighbors for each potential issue, allowing GPT-4 to consider similarity and avoid redundancy when generating new issue items. For each submission, I used OpenAI’s ada embeddings model to generate a 1536-dimensional embeddings vector and retrieved the five nearest neighbors using a vector database.Footnote 8 GPT-4 was instructed to avoid generating issues similar to the “nearest neighbors” that were retrieved (see Appendix D of the Supplementary Material).
Gaussian Thompson Sampling (GTS) was then used to determine which questions to present to subsequent participants. Though traditional Thompson Sampling requires binary outcomes due to its use of the Beta distribution (Offer-Westort et al. Reference Offer-Westort, Coppock and Green2021), GTS can be leveraged to accommodate continuous outcomes (Agrawal and Goyal Reference Agrawal and Goyal2017).Footnote 9 GTS was implemented in real-time using a custom-built back-end system created by the author. In contrast to previous applications of adaptive experiments in political science that have leveraged batch-wise Thompson sampling, probabilities were adjusted at the respondent level.
Recent studies have shown that the efficacy of GPTs such as GPT-4 in generating issue categories using open-ended text is on par with classification algorithms trained on thousands of examples, achieving performance levels marginally below that of human evaluators (Mellon et al. Reference Mellon, Bailey, Scott, Breckwoldt, Miori and Schmedeman2024). Each participant rated their own issue, along with eight others that were determined using GTS. Issue importance was measured using the question, “How important is this issue to you personally?” Responses were recorded on a five-point ordinal scale with the following options: “Not at all important,” “Slightly important,” “Moderately important,” “Very important,” and “Extremely important.”
3.1 Results
Figure 2 displays mean estimates for issue topics receiving 50 or more issue importance ratings.Footnote 10 As shown in the figure, the highest-rated issues were focused on the economy and health care, with issues such as “Cost of Living,” “Healthcare Affordability,” “Healthcare Costs,” “Economic Stability,” and “Universal Healthcare.” Issues rated lower on importance include more social and culture issues such as immigration and voting rights.Footnote 11 The MIP issue topics of “Race Relations” and “Ethics, Moral, and Family Decline” appeared among the lower-rated items, as did topics related to immigration (i.e., “Illegal Immigration,” “Border Security”). In the list of highly rated topics, we see issues that would likely not appear in traditional issue importance batteries such as “Mental Health Access,” “Privacy Protections,” and “Candidate Transparency.” Moreover, the frequent mention of various economic and healthcare dimensions is instructive, indicating the salience of economic concerns in the sample. In Appendix B of the Supplementary Material, I assess heterogeneity across partisan subgroups finding some issues that generate consensus across parties such as healthcare costs, political polarization, and economic issues.
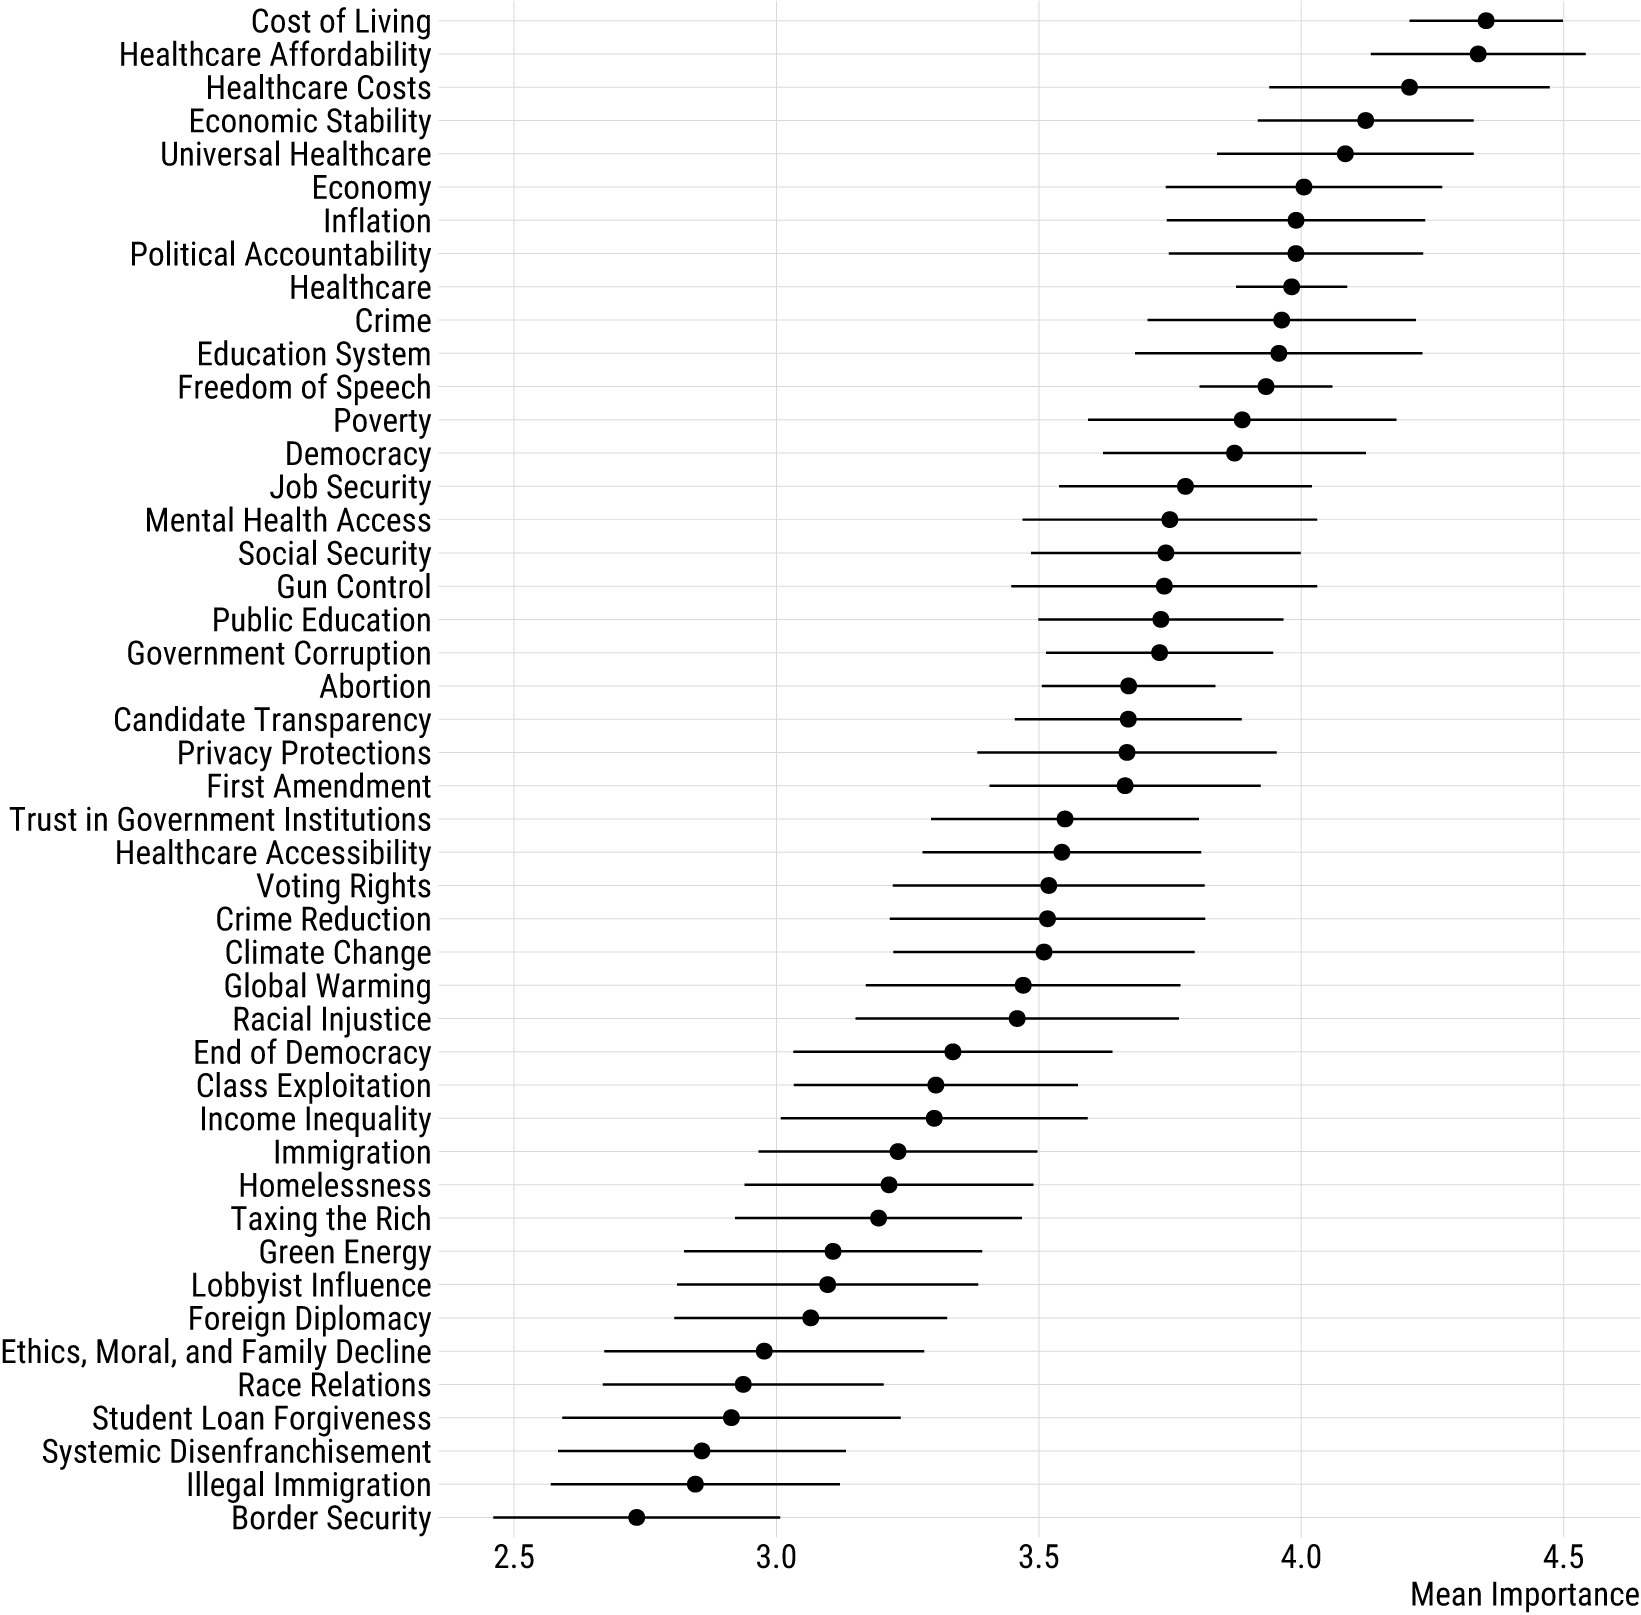
Figure 2 IPW-weighted estimates of survey questions measuring issue importance with corresponding 95% confidence intervals.
4 An Application to Latino Information Environments
Moving from issue importance to concerns within hard-to-reach communities, I use the CSAS method to identify rumors, negative political claims, and misinformation reaching Latinos, a group that has received attention among journalists and social scientists due to potential misinformation campaigns targeting the community (Cortina and Rottinghaus Reference Cortina and Rottinghaus2022; Velez, Porter, and Wood Reference Velez, Porter and Wood2023). I focus on Latinos for two reasons. First, fact-checking is still a relatively new institution within Latino-oriented media (Velez et al. Reference Velez, Porter and Wood2023, 790). Existing organizations might overlook important claims that circulate within the community due to resource constraints and the possibility that best practices for verification are still being developed. Second, private, encrypted messaging applications used by Latinos such as WhatsApp and Telegram may hinder the detection of false claims. In contrast to misinformation that is transmitted through social media such as Instagram, Twitter, and Facebook, fact-checkers and researchers may not be privy to claims circulating in private channels.
Implementing this more “bottom-up” approach to misinformation detection, I fielded a survey of 319 self-identified Latinos from the United States using the survey platform, CloudResearch Connect, from July 6 to 7, 2023. First, participants were asked two open-ended question regarding negative claims they had heard about Republicans and Democrats.Footnote 12 These claims were then passed to a fine-tuned version of OpenAI’s ada text generation model that classified the text as a “verifiable claim.”Footnote 13 Fine-tuning was necessary to ensure that questions entering the question bank were falsifiable political claims, rather than value judgments (e.g., politicians are evil). To carry out the fine-tuning step, a mixture of researcher-provided examples and participant-provided examples (N = 87) were hand-coded to indicate whether a claim was falsifiable in principle. Hand-coded classifications were then used to fine-tune the ada text generation model.Footnote 14
I also used a similarity and toxicity filter before adding items to the question bank.Footnote 15 For each submitted question, I used the ada model in OpenAI’s embeddings API, retrieved the five nearest neighbors using a vector database, and filtered out questions with a similarity score above .90.Footnote 16 I also used OpenAI’s moderation endpoint to filter out offensive and toxic claims. Claims that passed these filtering steps were added to the question bank.
After the submission and cleaning step, participants responded to their own question bank submission, along with four items from the question bank and six items capturing conspiracy beliefs and more common misinformation items (e.g., Covid-19 vaccines modify your DNA). All of the questions were presented in a matrix format, with a four-point accuracy scale. The response options were “not at all accurate,” “not very accurate,” “somewhat accurate,” and “very accurate.” Four claims were taken from the front pages of Latino-oriented fact-checking websites (i.e., Telemundo’s T-Verifica, Univision’s El Detector) to seed the question bank. As in the issue importance study, GTS was used to update question selection probabilities with accuracy ratings being used as the metric for updates.
5 Results
Figure 3 displays mean accuracy estimates for claims receiving more than ten ratings. The claims with the highest perceived factual accuracy covered information about both Republicans and Democrats. Party stereotypes about Republican positions on moral issues were rated as highly accurate (
 $\bar {x}$
= 3.54; SE = .07), as were claims that Trump used the presidency to enrich family and friends (
$\bar {x}$
= 3.54; SE = .07), as were claims that Trump used the presidency to enrich family and friends (
 $\bar {x}$
= 3.54; SE = .16) and possessed classified documents in his vacation homes (
$\bar {x}$
= 3.54; SE = .16) and possessed classified documents in his vacation homes (
 $\bar {x}$
= 3.43; SE = .12). Other highly rated claims focused on Republicans such as Ted Cruz (
$\bar {x}$
= 3.43; SE = .12). Other highly rated claims focused on Republicans such as Ted Cruz (
 $\bar {x}$
= 3.40; SE = .05), extreme policy positions such as a claim that Trump plans to deport all undocumented people (
$\bar {x}$
= 3.40; SE = .05), extreme policy positions such as a claim that Trump plans to deport all undocumented people (
 $\bar {x}$
= 3.32; SE = .31), and President Biden’s son, Hunter Biden (
$\bar {x}$
= 3.32; SE = .31), and President Biden’s son, Hunter Biden (
 $\bar {x}$
= 3.24; SE = .20). The lowest-rated claims typically involved false statements, allegations, or extreme descriptions of issue positions. Claims that scored especially low on perceived accuracy included “This year, there was a major explosion close to the White House” (
$\bar {x}$
= 3.24; SE = .20). The lowest-rated claims typically involved false statements, allegations, or extreme descriptions of issue positions. Claims that scored especially low on perceived accuracy included “This year, there was a major explosion close to the White House” (
 $\bar {x} = 1.50$
; SE = .15), “There were no wars during the Trump presidency” (
$\bar {x} = 1.50$
; SE = .15), “There were no wars during the Trump presidency” (
 $\bar {x} = 1.74$
; SE = .17), “Republicans support going back to the 1776 constitution.” (
$\bar {x} = 1.74$
; SE = .17), “Republicans support going back to the 1776 constitution.” (
 $\bar {x} = 1.80$
; SE = .33), “Trump will deport all immigrants if he wins in 2024” (
$\bar {x} = 1.80$
; SE = .33), “Trump will deport all immigrants if he wins in 2024” (
 $\bar {x} = 1.91$
; SE = .19), and “The president was involved with his son’s bribes” (
$\bar {x} = 1.91$
; SE = .19), and “The president was involved with his son’s bribes” (
 $\bar {x} = 1.92$
; SE = .20). It is worth noting that the standard errors increase as mean factual accuracy ratings decrease, and vice versa. This stems directly from the Gaussian Thompson sampling algorithm, which directs more participants to rate 'promising' items.
$\bar {x} = 1.92$
; SE = .20). It is worth noting that the standard errors increase as mean factual accuracy ratings decrease, and vice versa. This stems directly from the Gaussian Thompson sampling algorithm, which directs more participants to rate 'promising' items.
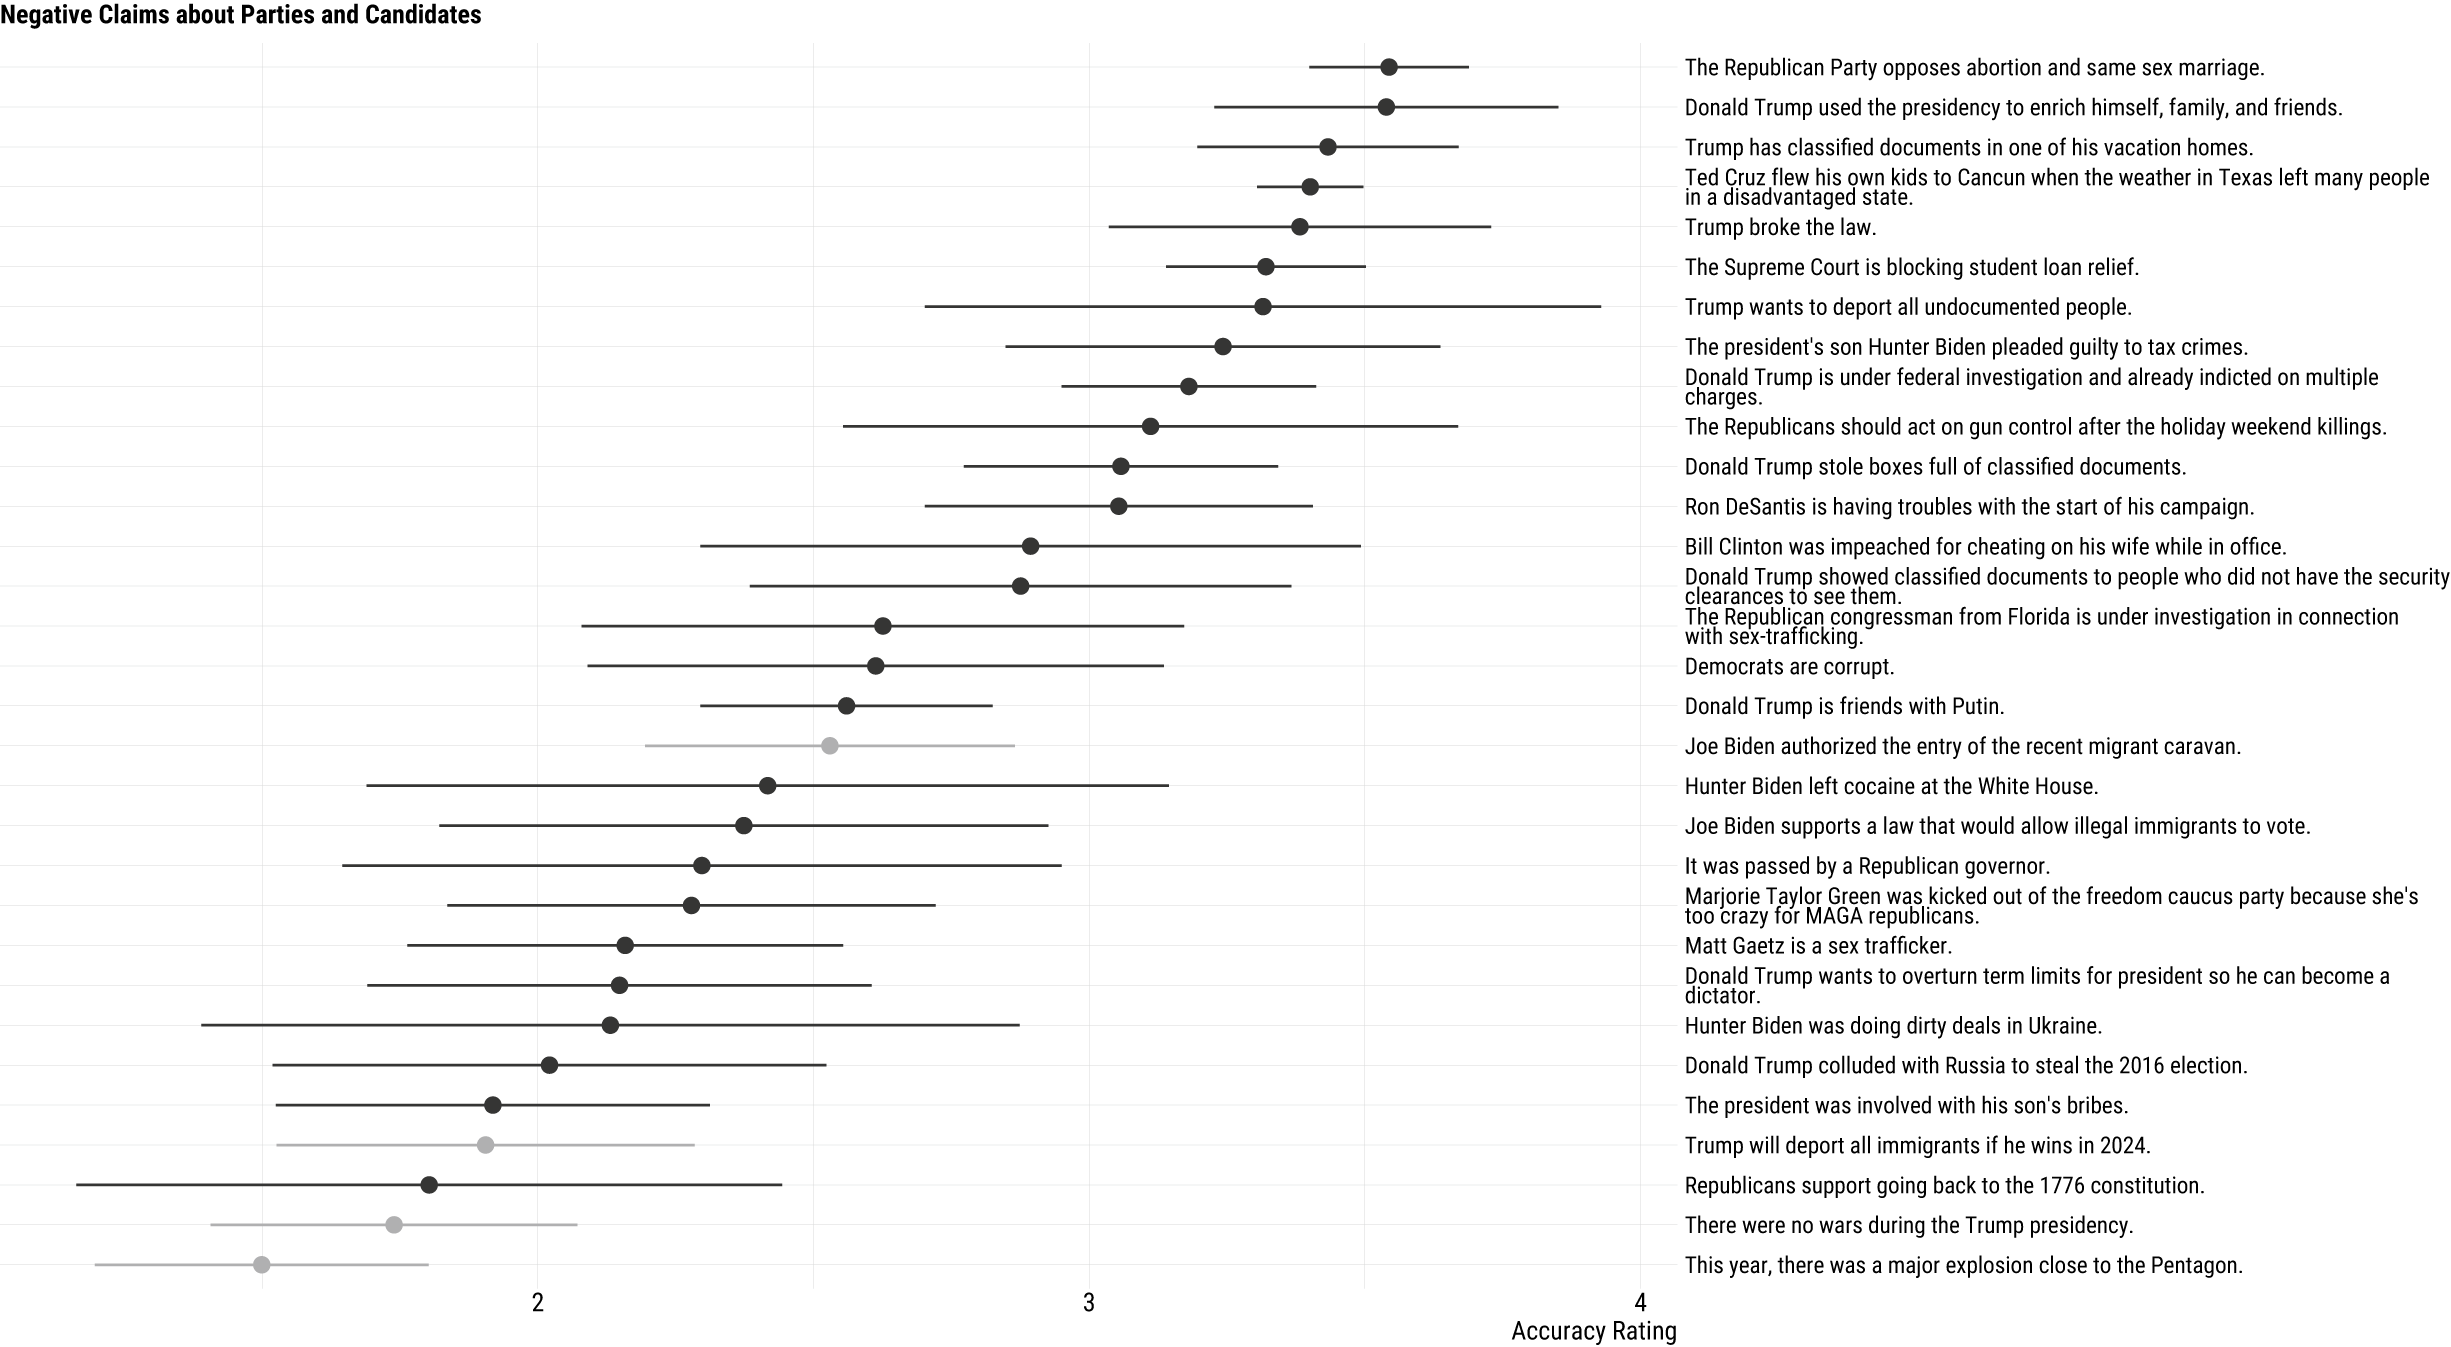
Figure 3 IPW-weighted estimates of survey questions measuring negative political claims with corresponding 95% confidence intervals. Items in gray were initial seed items based on fact-checked claims produced by Latino-focused fact-checking organizations. Black items are participant-generated items.
Whereas claims rated highly on perceived accuracy mostly reflected actual events or generalizations of party positions, claims with lower accuracy ratings typically involved verifiably false information or oversimplifications. These findings are instructive in that they reveal a level of discernment in the aggregate. Objectively false claims are generally seen as less credible by participants. Instead, higher accuracy ratings are observed when participants judge claims that are widely reported in the news (e.g., Ted Cruz’s Cancun trip amid a Texas blackout) or that reflect commonly-held perceptions of party positions (e.g., Republicans opposing abortion and same sex marriage). Though the initial seed claims based on fact-checks were small in number, the analysis revealed a surprising disparity: the most readily believed claims were not identified by the fact-checking organizations, but rather originated from other participants. In Appendix B of the Supplementary Material, I explore heterogeneity by levels of trust in the private, encrypted messaging application WhatsApp, which has been argued to be a vector of misinformation (Velez et al. Reference Velez, Porter and Wood2023). I find that those who trust the platform are less likely to view genuine newsworthy scandals as accurate, but rate factually inaccurate claims similarly to those who do not trust WhatsApp. This suggests that gaps between the two groups might not be a function of misinformation per se, but instead more general political knowledge.
The results highlight the complexity of the information environment among Latinos in the United States. They engage with a variety of narratives, some of which portray different parties negatively, but also reflect actual events. These findings offer a glimpse into how a prominent and politically pivotal ethnic group, which receives significant attention from campaigns, interfaces with information about political parties. Moving beyond the application to Latinos, an advantage of CSAS is that group-specific understandings may be reflected in the question bank and researchers can assess whether questions that perform well within certain subgroups also perform well in others. Moreover, while the focal outcome of this study is perceived accuracy, one could implement variations of CSAS for misinformation measurement that optimize for exposure. In this setup, participants might be asked to report whether they have seen a set of claims. Though exposure does not equate to belief, this approach could help identify false claims that are gaining traction within specific communities.
6 An Application to Local Political Issues
In Appendix K of the Supplementary Material, I examine local political concerns. Similar to the case of studying minority opinion, inconsistent polling at the local and state levels can complicate the development of quality survey items. Dovetailing with recent research on the “nationalization” of local politics (Hopkins Reference Hopkins2018), policy domains that are typically considered national in scope such as immigration, gun policy, foreign policy (e.g., stances on Gaza), and the environment emerge as participant-submitted items and gain traction within the sample. In surveys of particular states, Congressional districts, or cities, CSAS could be a valuable tool for uncovering local attitudes, beliefs, and preferences.
7 Concerns and Caveats
7.1 Is the CSAS method compatible with traditional survey design?
Despite the limitations of traditional surveys in identifying changing information environments or measuring responses within minority or otherwise hard-to-reach communities, the two approaches are not at odds. Researchers can decide the number of adaptive questions, and include these questions in standard batteries. For example, in the Latino survey, participants rated a pre-existing set of false claims and conspiracies, along with an adaptive set, in a question matrix. Before using this method, scholars should determine whether the marginal benefit of having a designated slot for exploratory questions is worth the survey time and cost.Footnote 17 A distinct advantage of multi-armed bandits is that several items can be explored despite having a smaller set of survey slots. The two approaches can also work in tandem when there are multiple phases of data collection. An initial wave (or pilot) could use CSAS to develop a fixed battery of questions for future waves, functioning much like pilot studies that gather open-ended data to inform scale construction (Weller Reference Weller1998). With CSAS, however, future surveys can be designed not only with open-ended content in hand, but question ratings and posterior probabilities that a given question is the best-performing question. This approach may be optimal if researchers prefer to split their research process into exploratory and confirmatory stages, as is recommended in Egami et al. (Reference Egami, Fong, Grimmer, Roberts and Stewart2018). Pre-registration across these different stages could lend more credibility to conclusions derived using this method (see Offer-Westort, Rosenzweig, and Athey (Reference Offer-Westort, Rosenzweig and Athey2022) for an example).
7.2 Late Arrivals, Prompting Participants, and Costs of LLM Inference
In Appendix C of the Supplementary Material, I address additional issues such as “late arrivals” or items added to the question bank toward the end of the survey, general concerns about crafting open-ended questions, and inference costs. I estimate inference costs for both closed-source and open-source models (i.e., OpenAI's GPT-4 versus Mistral AI's Mixtral), finding that costs ranged between $0.005 and $0.01 per participant. Furthermore, I discuss the issue of toxicity and recommend using moderation APIs. In Appendix G of the Supplementary Material, I provide detailed steps for implementing the CSAS method. I develop a Django application that can be hosted on popular platforms such as Amazon Web Services, Replit, or Google Cloud. Finally, in Appendix I of the Supplementary Material, I examine whether sample composition varies over the course of the study but fail to detect evidence of “demographic bias.” I discuss potential solutions that could be implemented in settings where this may be an issue.
8 Conclusion
This paper introduces a novel adaptive survey methodology that engages participants in stimuli creation and creates dynamic surveys that evolve with participant input. Applied first to issue salience, the CSAS method enabled participants to submit items reflecting prioritized issues. While traditional issue priorities like economic conditions, healthcare, crime, and education emerged as top-rated issues, the method also surfaced unique concerns such as candidate transparency and privacy protections. Given that participant-submitted questions frequently outranked those based on Gallup issue categories, CSAS could potentially identify public priorities that conventional survey approaches might ignore.
The method was also used in two additional settings: to study misinformation within the Latino community and measure salient concerns in local politics. In the Latino misinformation case, the analysis revealed that the most highly rated claims were partisan stereotypes, accurate statements, or widely reported allegations. In contrast, claims that were rated lower on accuracy were often objectively false and reflected more blatant misinformation. This application highlights CSAS’s usefulness in identifying contested claims that might otherwise go unnoticed in traditional surveys. CSAS was also used to examine local political concerns, where its flexibility enabled the identification of both locally salient issues absent from national discourse and national issues not traditionally associated with local government like foreign policy.
A distinct advantage of the adaptive design is that the exploration of new items can yield a larger number of items than one would include in a traditional static survey. This not only makes it possible to explore new issues (e.g., artificial intelligence), but also to uncover unexpected areas of agreement (and disagreement) across partisan or ideological subgroups. Future studies could apply more sophisticated algorithms such as contextual bandits to account for subgroup heterogeneity and explore how question banks vary across social and political contexts (Offer-Westort et al. Reference Offer-Westort, Rosenzweig and Athey2022). Although no substantial over-time sample imbalances were detected in this study, future applications could also use deconfounded Thompson sampling to adjust for potential variations in demographic composition over time (Qin and Russo Reference Qin and Russo2022).Footnote 18
Future research employing CSAS has the potential to explore a variety of topics where participant-generated content is particularly valuable. For instance, when voting in elections, voters not only consider issue positions or party affiliation, but also personal attributes such as honesty and competence and how politicians are perceived to navigate different economic and political conditions (Lenz Reference Lenz2012). CSAS could be useful in uncovering additional factors that influence voting decisions, but are not salient to researchers. Furthermore, when identifying norms, core beliefs, or key sources of identity within hard-to-reach communities, CSAS could reduce the misalignment of researcher-defined concepts with respondents’ actual perceptions and interpretations of constructs (e.g., socially expected political behaviors or attitudes). Finally, when studying representation, scholars often rely on nationally salient issues, potentially overlooking the more idiosyncratic concerns of the public. CSAS could be used to complement existing measures of representation with dynamic question banks that include participant-generated issues.
CSAS could also be used to develop measurement scales that more accurately reflect considerations that are important to participants. Given that many core constructs in the social sciences reflect latent variables (e.g., democracy, political sophistication, prejudice, identity), CSAS could help extract folk definitions and incorporate them into multi-item scales. Future research could also explore the feasibility of optimizing additional criteria, such as item discrimination and difficulty, to refine existing measures as new items are explored. By prioritizing the perspectives of study populations, CSAS could strengthen the connection between researchers and respondents and advance our understanding of public opinion and political behavior.
Acknowledgments
I would like to express my gratitude to the editor and three anonymous reviewers for their valuable comments. I am deeply indebted to Brandon Stewart, Don Green, Daniel Russo, Brendan Nyhan, Vin Arceneaux, Florent Parmentier, Jean-Philippe Cointet, and participants at the 2024 Exploring Misinformation Meeting at Sciences Po for their insightful feedback and suggestions. Special thanks are extended to Sciences Po CEVIPOF, the TIERED Project, and the Open Institute for Digital Transformations for their support.
Supplementary Material
For supplementary material accompanying this paper, please visit http://doi.org/10.1017/pan.2024.34.


 Open access