


Introduction
The International Polar Year, 2007–2009, has contributed to an increasing awareness of the Arctic and the Antarctic amongst researchers, scholars, the media and the general public. The attention that has been paid to the polar regions during recent years has also made them a more appealing travel destination. Tourism has grown considerably in the last decade. Antarctica, for instance, experienced a rise of almost one-third of tourists in the past five years (IAATO 2007). Precise figures for the Arctic are as yet difficult to obtain, but it seems that approximately 1.5 million visitors have visited the region with most travelling to Alaska (Mintel 2006). Trips to both regions are predicted to rise by 15–20% per annum in the next few years leading them into ‘mainstream travel’, with non-specialist tour operators starting to offer tours (Mintel 2006). Generally, tourism has generated an important source of income and has produced notable economic value, specifically for peripheral Arctic regions with sparse or difficult to access mineral resources (Snyder Reference Snyder2007).
Greenland exemplifies such a destination with the value of tourism slowly increasing. Visitor numbers rose by around 14% from 2005 to 2006 to 245,000 (these figures exclude one-day tourists and cruise passengers), with most travellers visiting the western coast (Statistics Greenland 2007). Unofficial data gathered by the World Wildlife Fund (Nyegaard Reference Nyegaard2007) suggest that the value of tourism is around US$80 million. Greenland has especially become a symbol in regard to the impacts of climate change and a rapidly shrinking ice sheet (Nyegaard Reference Nyegaard2007). Reports describing disappointed and dissatisfied travellers because of the small amount of ice and wildlife seen have become more common (Pagnan Reference Pagnan2003). The gap between tourists' perceptions of climate conditions and the actual situation is increasingly becoming a problem (UNWTO 2007). Yet, the last ‘frontiers’ (Mason Reference Mason1997: 153) have become a competitive marketplace and Arctic destinations are required to attract visitors and investment alike through efficient marketing that is, inter alia, based upon the knowledge of actual expectations and perceptions of the potential stakeholders. However, previous works analysing and comparing these are rare. Accordingly, the aim of this research is to illustrate perceptions held by travellers to the Arctic who had not been there before and to identify whether Greenland is recognised as a distinct destination. This should help marketers of Greenland, such as the Greenland Tourism and Business Council (GTBC), the NTO's and the local tourism entrepreneurs, to promote a sustainable image and to acquire a better understanding of Greenland's competitive position within the polar region.
Considering the fact that the German market, with international expenditures of more than €40 million (DRV 2007), is in relative proximity to Greenland and that it was named as a target market by the GTBC, naturally suggests it as an area for study. Before analysing the images and making recommendations for marketing, an overview of the literature that is referred to in this study is provided.
Destination image
During the last few decades, the study of images has received increasing attention by a range of interrelated disciplines since they have been recognised as important in affecting decision making processes and impacting on economical, sociological and environmental issues (Ace Reference Ace2001; Ajzen Reference Ajzen1980; Downs and Stea Reference Downs and Stea1977; Gartner Reference Gartner1996; Hall and Johnston Reference Hall and Johnston1995; Liping Reference Liping2002; Mason Reference Mason1997; Murphy and Murphy Reference Murphy and Murphy2004; Oppermann Reference Oppermann, Woodside, Crouch, Mazanec, Oppermann and Sakai2000; Theobald Reference Theobald and Theobald2005; Woodside Reference Woodside, Woodside, Crouch, Mazanec, Oppermann and Sakai2000).
Tourism research has predominantly covered aspects concerning the development of destinations. Therein, images have been examined, for example in reference to image formation and travel decision making processes (Baloglu Reference Baloglu, Woodside, Crouch, Mazanec, Oppermann and Sakai2000; Baloglu and McCleary Reference Baloglu and McCleary1999; Bauer Reference Bauer2001; Beerli and Martín Reference Beerli and Martín2004; Crompton and Kim Reference Crompton and Kim2001; Echtner and Ritchie Reference Echtner and Ritchie2003; Gartner Reference Gartner1996; Gunn Reference Gunn1988; Hosany and others Reference Hosany, Yuksel and Muzaffer2006; Jenkins Reference Jenkins1999; Murphy and Murphy Reference Murphy and Murphy2004; San Martin and Rodriguez del Bosque Reference San Martin and Rodriguez del Bosque2008). Also, they have been considered when identifying niche markets and customer satisfaction (Ibrahim and Gill Reference Ibrahim and Gill2005; Prebensen Reference Prebensen2007), in relation to taxonomies of measurements and measurement techniques (Coshall Reference Coshall2000; Gallerza and others Reference Gallarza, Saura and García2002; Pike Reference Pike2002; Prebensen Reference Prebensen2007; White Reference White2004) and in reference to positioning strategies and destination branding (Baker and Cameron Reference Baker and Cameron2008; Haahti Reference Haahti1986; Pike and Ryan Reference Pike and Ryan2004; Zehrer and others Reference Zehrer, Pechlaner and Raich2007). The number of studies conducted underpins the complexity and, hence, the difficulty of obtaining an explicit idea of image formation and measurement.
Destination image formation
In the early years of image formation studies, Gunn (Reference Gunn1972) was one of the first to develop a model in which the process is broken down into seven stages. In later studies (Reference Gunn1988), she summed them up in three segments: the organic, the induced, and the modified induced. The organic image refers to naive or non-tourist targeted information (such as independent newspaper articles, word of mouth) and is described as the knowledge or perception stage. The induced image generates from commercial information (such as professional brochures or TV commercials) and enhances the image with feelings. The modified induced image relates to the traveller's post-visit experience.
The basic construct of these stages was adapted, and slightly modified by various marketing professionals and researchers. They elaborated the evoked mental processes (Ace Reference Ace2001; Gartner Reference Gartner1996; Keller and Kotler Reference Keller and Kotler2006; Sheth and others Reference Sheth, Mittal and Newman1999). Gartner (Reference Gartner1996), for instance, outlined the development of the cognitive, the affective and the conative components.
The cognitive stage comprises the total beliefs and attitudes of the individual towards an object that are ‘based on perceptual fact [awareness] rather than reality’. Academics emphasise that this process of ‘forming cognitive images [. . .] is important in creating destination awareness (Gartner Reference Gartner1996: 457). The affective phase is divided into three sets which are to express the feelings towards the object: the inert set results in a balanced image, the inept in a rather negative image and the evoked set in a rather positive image. The conative stage is action related and refers to the overall outcome. Generally, it proves the intensity of the object from the individual's point of view. Besides, Gartner (Reference Gartner1996) credits attitude with a crucial part of image formation, on which following processes are based. Motivations on the other hand ‘impact on the affective component of image [. . .] only when travel to a particular place is considered’ (Gartner Reference Gartner1996: 458).
However, Gunn's (Reference Gunn1988) and Gartner's (Reference Gartner1996) approaches contain important elements that are neglected in either one or the other. Gunn (Reference Gunn1988) emphasises external factors slightly influenced by the internal stages, whereas Gartner (Reference Gartner1996) focuses on the internal stages being slightly influenced by external factors.
Baloglu and McCleary (Reference Baloglu and McCleary1999) recognise their equal significance, their mutual impacts and their equal inter-relation with the mental process. A more holistic approach is thereby achieved. The model refers to the attitudinal notion as a vital part of the image construct as seen in other studies. Similarly affected by the personal factors and the external stimuli, the induced knowledge and beliefs are associated with the cognitive, feelings and emotions are referred to the effective stage. As underpinned by Baloglu (Reference Baloglu, Woodside, Crouch, Mazanec, Oppermann and Sakai2000: 84), the former takes a major part herein: it precedes the affective stage, and its ‘evaluations serve as intervening variables and mediate the relationship between stimuli and consumer characteristics variables, and affect towards destinations’. Unlike Gunn (Reference Gunn1988) and Gartner (Reference Gartner1996), Baloglu's and McCleary's (Reference Baloglu and McCleary1999) model omits the conative component. Nevertheless, they accomplished a fundamental model for the formation of destination images in which influencing elements are considered evenly and are empirically demonstrated to be multi-dimensional.
The multi-dimensionality has been taken up, for instance, by Echtner and Ritchie (Reference Echtner and Ritchie2003) in reference to the impact of images on strategies. They drafted key components for valuable destination positioning to create a positive differentiation to competitors in the consumers' minds; key components which evoked from the development of a ‘distinctive and appealing perception’ (Reference Echtner and Ritchie2003:44). Their model captures these ‘unique features or auras which distinguish a particular destination’ (Reference Echtner and Ritchie2003: 37). It implies that the components influence both the subjective and objective views held as well as the practical and non-measurable items that are categorised in two dimensions. However, Echtner and Ritchie (Reference Echtner and Ritchie2003) emphasise that it is difficult to make out the various parts of image formation variables. Overlapping can be addressed concerning holistic imagery and attributes and concerning the functional (specific) and psychological (abstract) characteristics of a destination. Additionally, the model may integrate feelings and emotions of the individual towards the destination, but lacks the implementation of values and beliefs of the respondent.
Overall, a general framework used for the creation of models has been discerned in the reviewed literature in which sequential stages of developing, assessing and (re)acting have been used to describe the image formation process. Affecting components and their influence on the image formation varied. Furthermore, all studies underpinned the difficulty of acquiring a persistent theory of the image formation process since it is subject to continuous alteration.
The strategic management of destinations
As pointed out earlier, image studies are not purely focused on mental sets, but also serve as a relative component for inter-disciplinary research. Since the economical value of tourism and the stronger competition among destinations has increased, studies have gradually focused on key elements for successful marketing (Buhalis Reference Buhalis2000; Echtner and Ritchie Reference Echtner and Ritchie2003; Gallerza and others Reference Gallarza, Saura and García2002; Haahti Reference Haahti1986; Hsu and Powers Reference Hsu and Powers2002; Mykletun and others Reference Mykletun, Crotts and Mykletun2001; Pike and Ryan Reference Pike and Ryan2004). Ritchie and Crouch (Reference Ritchie and Crouch2003: 245) emphasise that ‘the awareness and image of a destination in the mind of potential visitors is [. . .] one of the most important factors that affect destination competitiveness’. This competitiveness is used for marketing the salient features of the destination within the same product groups to the relevant market segment. Scholars underline the need for a sustainable position and long term prosperity which can be achieved by seeking value and cost competitive advantage (Buhalis Reference Buhalis2000; Ritchie and Crouch Reference Ritchie and Crouch2003). Advantage is determined by how to appeal, whom to attract, and with what to exploit the destination's full potential. Fig. 1 proposes a process on how to establish and enforce a position.

Fig. 1. Determining the positioning process (Hooley and others Reference Hooley, Saunders and Piercy2004: 327).
The identification of the possible customers, the destinations and the competitors is the basis for successful differentiation. A review of destination marketing literature showed ‘that image and identity play an important role in differentiation between objectively similar alternatives’ (Baker and Cameron Reference Baker and Cameron2008: 79). Mykletun and others (Reference Mykletun, Crotts and Mykletun2001) and Buhalis (Reference Buhalis2000) highlight the importance of reinforcing present images of the consumer rather than reinventing a position while Ritchie and Crouch (Reference Ritchie and Crouch2003) put stress on the need for developing or strengthening the destination's brand. They conclude that those visitors who are positively aware of a destination are as much attracted as those who rather lack a cognitive and affective image.
In regards to the differentiation between destinations, scholars emphasise the need for establishing a distinctive destination brand which sets itself apart from its competitors (Aaker Reference Aaker1991; Hankinson Reference Hankinson2005). Aaker (Reference Aaker1991 as cited in Baker and Cameron Reference Baker and Cameron2008: 88), for instance, summarises that ‘consumer-based equity consists of [. . .] brand loyalty, brand awareness, perceived quality and brand associations’. Taking these factors into account, the brand is likely to succeed in the market. Furthermore, in their latest study, Hosany and others (Reference Hosany, Yuksel and Muzaffer2006) proved the importance of the brand personality, ‘the set of human characteristics associated to a brand’ (Aaker Reference Aaker1997 as cited in Hosany and others Reference Hosany, Yuksel and Muzaffer2006: 638), alongside the brand image which consists of the consumer's feelings of sincerity, excitement and conviviality towards a destination. Their theory has proved the significance of the brand personality particularly for affective images.
However, the degree of association (the reproduced components during the image formation) between the held image and the (destination) brand is also decisive for its recognition (Liping Reference Liping2002; Ritchie and Crouch Reference Ritchie and Crouch2003). Concerning this, Liping (Reference Liping2002: 726) points out that ‘secondary associations [for example TV reports or article on climate change] are not controllable’. The induced image may then serve as a cost saver (Ritchie and Crouch Reference Ritchie and Crouch2003). However, associations depend on the marketer's formulated homogenous market segment and the subsequently created mix to transfer the right message to the right customer (Buhalis Reference Buhalis2000; Mykletun and others Reference Mykletun, Crotts and Mykletun2001). This message shall comply with the unique values and benefits of the product or service and the active or prospective demand side (Pike Reference Pike2002; Sheth and others Reference Sheth, Mittal and Newman1999).
In conclusion, a strategic framework that combines these major components is a foundation for ‘effective positioning [that] is a mutually beneficial process to both the marketer and the consumer’ (Pike and Ryan Reference Pike and Ryan2004: 333).
In the tourism literature, studies on tourist images of the polar regions have rarely been conducted. To the best of the author's knowledge, there has been no research completed on the images of non-previous travellers to Greenland nor has the relationship of these images in regard to the Arctic region been analysed. Findings may therefore represent a mutually beneficially outcome for both marketers of Greenland as well as for potential visitors.
Destination image measurement
The variety of existing models of destination images shows the complexity of the subject matter. This is also reflected in the number of measurement techniques used to identify destination images. Universal techniques include structured and unstructured quantitative studies as well as qualitative research which are predominantly aimed at relative comparisons of competitors and markets' needs and expectations.
The most common structured approaches incorporated scales such as the Likert and the semantic-differential scale (Baloglu and Brindberg Reference Baloglu and Brindberg1997; Ibrahim and Gill Reference Ibrahim and Gill2005; Liping Reference Liping2002; Pike and Ryan Reference Pike and Ryan2004). These are straightforward concerning the appraisal of data. However, some scholars (Prebensen Reference Prebensen2007; Fink Reference Fink1995; Finn and others Reference Finn, Elliott-White and Walton2000) point out that attributes used in scales do not always apply to those imagined by the respondents and regard unstructured techniques as necessary for implementation. Therefore, ‘explorative’ (Prebensen Reference Prebensen2007: 750) open ended questions as well as word or picture associations were introduced in surveys to uncover salient attributes for identifying a market position (Ibrahim and Gill Reference Ibrahim and Gill2005; Prebensen Reference Prebensen2007).
Baloglu and Brindberg (Reference Baloglu and Brindberg1997) proved the application of affective image measurement particularly useful to destinations that are not directly perceived or not directly visible. They were the first to apply an effective positioning model on measuring and comparing destination images and illustrating results on a response grid.
Generally, researchers demand the employment of a set of techniques for elicitation in order to uncover the range of emotions and in order to acquire a comprehensive and flexible approach to tourists' images of a destination (Echtner and Ritchie Reference Echtner and Ritchie2003; Gallerza and others Reference Gallarza, Saura and García2002; Hooley and others Reference Hooley, Saunders and Piercy2004; Ibrahim and Gill Reference Ibrahim and Gill2005; Jenkins Reference Jenkins1999).
However, the literature reviewed disclosed a lack of implementation concerning the distortion of images. Gartner (Reference Gartner1996: 476) emphasises that ‘image measurement is not necessarily a measurement of reality’. Additionally, it is the influential factors being measured, but not necessarily quantified. Volumes could serve as an indicator on how greater or lesser aspects are required actually to affect the distinct components. Moreover, as made out by Gartner (Reference Gartner1996), the variable of time and space is rarely taken into account.
Method
The collection of data for this study took place during a two weeks period in December 2007. Questionnaires were distributed amongst passengers at Berlin Tegel International Airport (n = 138), and amongst the author's circle of friends and acquaintances largely from the northern and eastern parts of Germany (n = 81). 219 questionnaires were gathered in total. The author strove for a geographical spread of the origins of respondents that it was hoped would be provided by approaching people waiting for flights to a variety of destinations inside Germany. 210 self-completed questionnaires were considered for the data analysis, 9 samples were excluded because of previous travel experience to the Arctic or impracticality.
Two slightly different questionnaires were issued in order to avoid biases. Survey A focused on the Arctic image, whereas survey B concentrated on the image of Greenland. The three and four page questionnaires respectively, broadly consisted of three parts: questions concerning the cognitive, affective and conative stage, enquiries referring to the information sources that had been accessed or had been taken notice of, and questions eliciting the respondents' characteristics. After pre-testing the surveys in a pilot study (n = 6), changes had to be introduced: attributes were reformulated (for example central-peripheral) since they retrieved misunderstandings evoked by the translation process (English-German), and variables capturing the samples' characteristics were categorised to simplify the surveys. The pilot study was not part of the sample unit.
The cognitive stage was analysed by the use of visual association, by questions referring to geographical awareness and by implementing a semantic-differential scale. The first was implemented by asking respondents to encircle the Arctic on a world map. Definitions of the Arctic territory are complex (Hall and Johnston Reference Hall and Johnston1995) and, herein, the definition of the ArcticStat (2007) is adopted. This covers the northern regions of Norway, Finland, Sweden, Russia and Canada, the US state of Alaska, Greenland and Iceland. Accordingly, sketches were analysed per region ticked off on the map. Additionally, survey B held five geographical and demographical questions referring to Greenland.
The geographical questions allow for a true reflection of awareness and knowledge and an unbiased reply that is not based upon guesswork. Limitations apply concerning the choice of an appropriate map. A few respondents complained that the map did not imitate the round shape of the globe and that this could lead to misinterpretations. In addition to that, the appraisal of this question has to be regarded as rather vague. Even though just small parts of countries were encircled (for example Baffin Island), the marking was assessed as the whole country (for example Canada). An example is shown in Fig. 2.

Fig. 2. Interpretation of the physical map.
The 7 point semantic-differential scale consisted of 17 attributes. The items employed derived from personal dialogue with German citizens (n = 6), from the Arctic/Antarctic literature reviewed (Bauer Reference Bauer2001; Hall and Johnston Reference Hall and Johnston1995; Kaæ Reference Kaæ and Baldacchino2006; Mason Reference Mason1997; Stewart and others Reference Stewart, Draper and Johnston2004) and the author's subsequent selection.
The scale was implemented after the affective open-end question since it was not intended to influence replies by providing possible attributes that were not thought of otherwise. In appraisal, the listing was rearranged and anchored at 1 from positive and 7 to negative attributes.
Limitations were shown by the evaluation of positive in opposition to negative features, by different interpretations of the adjectives used, and by the fact that it missed out on important attributes of which respondents may have thought.
The affective stage was examined with an unstructured open-end question and a four bi-polar attribute scale. The accumulated keywords were clustered in the following 9 broader segments of attributes and features: ice, environment, atmosphere, wildlife, local culture and history, research and expedition, economy, geography and others. The categories were then assigned to Echtner's and Ritchie's multi-dimensional model (Reference Echtner and Ritchie2003: 40).
The open-end question allowed for a wider spread of attributes and for a more complex insight into the sample's first impressions when thinking of the Arctic and Greenland. A limitation brought up was the time constraint. It is assumed that, given more time to fill out the questionnaire, the range of answers would have increased.
The affective scale included Baloglu's and Brindberg's (Reference Baloglu and Brindberg1997) suggested adjective-pairs of pleasant-unpleasant, exciting-gloomy, arousing-sleepy and relaxing-distressing. These ranged from 1 positive to 5 negative attributes. The scale was then approached on the basis of Pike's and Ryan's (Reference Pike and Ryan2004) study on positioning destinations: grand means of the two items pleasant-unpleasant and arousing-sleepy were calculated and plotted onto a graphical response grid.
The major constraint existed in non-response biases. Many respondents stated that they did not feel sufficiently competent to answer.
The conative section intended to measure the likelihood of a visit to Greenland in the next five years and an examination of associations to the samples' characteristics. This was followed by the types of information sources assessed or related to the Arctic and Greenland. The survey instruments terminate with questions referring to the respondents' characteristics. The items selected were age, gender, marital status, occupation and whether the respondent had children or not.
Limitations
Upon completion of this paper certain limitations arose that need to be acknowledged. A study comparing one country and one region may not be fully applicable; it has to be taken into account that respondents in the sample may have determined Arctic boundaries differently and therefore may have indicated no travel experience to the area, although in fact they have been to the Arctic as defined in this research. Moreover, the census is not ideally reflected, primarily relating to an under representation of the older generation and the occupational status held by respondents (compare Eisenmenger 2007). The shortness of the timeframe may lead to an inadequate representation; during the period 3 December to 14 December 2007 and therefore during the study's timeframe of data collection, the UN climate change conference took place in Bali which was widely discussed in the German media (for example ARD 2007) and which may have had an impact on a respondent's present perceptions. In addition, an analysis of destination images and positioning strategies should be dealt with separately (Pike and Ryan Reference Pike and Ryan2004) and within a broader range of comparable competitors.
Findings and discussion
A total of 210 questionnaires was taken into account for the study, 97 surveys were gathered for the Arctic sample (A), another 113 were collected for the questionnaire referring to Greenland (B). Herein, the gender was evenly split between female and male respondents with 48.1% male and 51.4% female. The youngest age group (18–30 years) represented the highest percentage of survey A at 47.4%, the 31–45 year olds were the main representatives in survey B with 37.2%. In total, the age groups of 46–65 and 66+ years old were at 17.6% and 3.8% respectively and depicted the lowest value. Differences relating to marital status were more significant. Single persons represented the main group in both A and B survey, married respondents ranked second with one-third of the total, followed by widows and widowers at 1.9%. Generally, around two-thirds of the sample was childless. Concerning occupational status, the majority of respondents were employees (62.9%), followed by students (18.6%), freelance workers (10.0%) and retirees (4.3%). A comparison of profiles of survey A and B can be seen in Table 1.
Table 1. Profile of respondents.

NA = No Answer; Freq = Frequency.
Concerning the measurement of the cognitive stage, the encirclement of the Arctic revealed that the sample (n = 210) generally associated the region with a landmass. Accordingly, the majority neglected the Arctic ocean. Within the markings, it turned out that certain regions/countries were more associated with the Arctic than others. Greenland was relatively outstanding with a mark of 80% by the sampled population, followed by Norway with 54.7% (specifically due to Spitsbergen) and northern Canada (54.2%). At the bottom of the table was Alaska with 8.5%. Although Alaska receives the highest visitation frequencies within the Arctic (Mintel 2006), its geographical distance from Germany may have lead to its low score. 10.4% geographically associated Antarctica with the Arctic. Canada and Norway (specifically Spitsbergen) and particularly Greenland dominate the overall picture.
The results were underlined by the subsequent naming of countries within the Arctic in relation to markings of Greenland (78.6%). In addition to Canada (40.5%), it was also Antarctica and Alaska being mentioned to a greater extent with 34.8% and 32.9% respectively. The low numbers for northern Scandinavia in both sections lead to the first assumption that Germans are relatively unaware of the Arctic region being in relatively close proximity to their country. A comparison of both the encirclement and the statement question can be seen in Fig. 3.
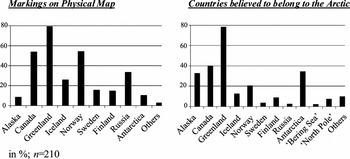
Fig. 3. A comparison of markings and statements made in open-ended questions.
Pearson's chi-square test was carried out in order to compare possible impacts of socio-demographic variables to the markings of Greenland and to other regions marked in the Arctic. The test did not indicate any significant associations, except for the correct marking of Greenland and the age of the respondent, x2(3) = 10.246(a), p = .017.
The cognitive results of survey B are as follows. A remarkable 85.8% marked Greenland correctly on the world map (others included Iceland n = 8 and Canada n = 1), 18.6% were aware that Nuuk is a city/the capital. 64.4% thought the flight hours to be between 4 and 8 hrs, and 69.9% estimated the population of Greenland to be between 31.000–70.000 (20% estimated it to be more than 200.000). 56.6% and 18.6% of the sample knew that Danish, and Greenlandic, were one of the official languages. Only 12.3% mentioned both languages.
The relationship of characteristics and the categorical data of questions referring to geographical and demographical knowledge about Greenland in survey B also showed significant associations between the number of correctly answered questions and the age of respondents, x2 (3) = 8.988(a), p = .029, as well as whether the respondent had children or not, x2(3) = 12.688(a), p = .005. A post hoc test revealed that the group means of the 18–30 year olds compared to the 31–45 year olds differed with –.429, significantly at the p <.05 level. It must be pointed out however that the four age groups were collapsed into three: 18–30, 31–45 and 46+ years old. This was to ensure better accuracy of the results. A cross tabulation indicated that those with children were more aware of the geographical settings than those without. 38.1% with children had more than three correctly answered questions, whereas only 11.7% without children had three or more correctly answered.
As a whole, the results for the cognitive stage point out that Germans do distinguish between the Arctic and Greenland. However, this turned out differently than expected. It was not that Greenland remained unnoticed within the Arctic, but rather that respondents were particularly aware of it. The outcome of the visual awareness illustrated that the Arctic seems to be strongly associated with Greenland which could be a valuable asset and a cost-saver for marketing. Promotions may profit from any associations drawn to the Arctic in Germany. A slogan like ‘Think Arctic: think Greenland.’ may strengthen the connection.
For the semantic-differential scale, differences and similarities in mean scores of the 17 attributes were calculated and compared across both data sets. Cronbach's alpha was representative for survey B with .93, survey A is not fully applicable with the alpha being .69. Fig. 4 illustrates a split bar chart of mean deviations of attribute pairs reporting in sequence and direction. Overall, the mean scores were plotted relatively closely together and the distribution to positive and negative direction turned out to be balanced.

Fig. 4. Differences in mean scores of the Arctic and Greenland and significance amongst items. The scores for Greenland are at the top, those for the Arctic are at the bottom.
A bar chart of mean deviations of Greenland compared to those of the Arctic was created to highlight differences (Fig. 5). For both scales, the scattering shows that those attributes relating to feelings or psychological impressions tend to be more reflected on the positive side (for example free, wild, unique, lonely and exciting) while attributes relating to climate or functional impressions are more strongly apparent on the negative side (green, accessible, central, warm and northerly). Yet, it needs to be considered that there is only a minor span of mean variations between the Arctic and Greenland. Moreover, the total range varies by 1.53 points on the bar chart scale that hints towards a less differentiated cognitive picture between the destinations.

Fig. 5. Bar chart of mean deviations of image attribute pairs – Greenland in comparison to the Arctic.
The significance amongst items was tested with an independent-samples t-test. It demonstrated that eight variables were substantially different, amongst them the following four variables with the highest effect sizes of r = .20.–.29. Participants thought Greenland to be more traditional (M = 2.96, SE = .160) than the Arctic (M = 3.72, SE = .165). This difference was significant with t(195) = 3.292, p = .001. Participants thought Greenland to be less sunny (M = 3.55, SE = .136) than the Arctic (M = 2.95, SE = .144). This difference was significant with t(193) = −3.072, p = .002. Participants thought Greenland to be more accessible (M = 4.69, SE = .159) than the Arctic (M = 5.30, SE = .151). This difference was significant with t(195) = 2.771, p = .006. And, lastly, participants thought Greenland to be greener (M = 5.18, SE = .156) than the Arctic (M = 6.11, SE = .154). This difference was significant with t(196) = 4.264, p < .001. All in all, due to the small and medium effect sizes, the stated results need to be regarded as a rather weak representation of correlations.
Subsequently, variables which differed significantly were tested against the age, gender and occupation of the sample. A one-way analysis of variance (ANOVA) of image attributes of survey A and survey B was introduced. Table 2 illustrates those variables which differed significantly against the samples' characteristics. A post hoc test was carried out against age and occupation in order to examine the significant variables more profoundly. This illustrated particularly that the middle-age group of 46–65 year olds thought the Arctic to be more unique than the 18–30 years old, p = .042. The results of the attribute cheap-expensive consequentially reflected the outcome of the more highly perceived prices. On average, the latter group thought Greenland to be less expensive than the 46–65 years old, p = .002 and a cross-tabulation revealed that men thought Greenland to be more pristine (M = 2.31) than did women (M = 3.00).
Table 2. An ANOVA of image variables against gender, age and occupation.

BG = between groups; WG = within groups.
Generally, the cognitive stage was found to be more developed for Greenland than for the Arctic. Although the Arctic is present in minds, it seems that particularly younger respondents tend to fill in the picture with perceptual facts. Beliefs and attitudes tend to be predominantly influenced by personal factors.
The comparison of the single attribute pairs revealed that those concerning feelings like excitement, loneliness or wilderness are positively evaluated for both destination entities. Relating to the more functional attributes, Greenland was perceived to offer better accessibility (or less distance from Germany) in contrast to other Arctic regions. Marketing could communicate this through such slogans as: ‘Gets you closer to the Arctic: Greenland’.
Affective attributes in the open end question brought up the following results for the nine categories: approximately the same number of attributes per respondent derived in the A and B surveys (Arctic n = 455 = 4.5 attributes/respondent, Greenland n = 509 = 4.69 attributes/respondent), but features turned out to be more diverse for Greenland. In both questionnaires, the two categories for environmental and ice features count for more than 50% of the total number of listed attributes, followed by wildlife (19.5% for the Arctic and 15.1% for Greenland) and local culture and history (11.6% for the Arctic and 17.4% for Greenland). Percentages of the findings are almost equally distributed for the Arctic and Greenland. A noticeable difference was found in the greater number of descriptions for the category of local culture and history in survey B. This may simply be for the reason that Greenland does not depict such an immense entity as the Arctic. On the other hand, it may point out a lack of knowledge of the cultural diversity within the Arctic. It is interesting to note that the top answers of both questionnaires matched for nearly all of the categories (for example environment: cold, wildlife: polar bear, atmosphere: lonely). These similar outcomes indicate a relatively cohesive affective image. Table 3 provides a full overview of the attributes mentioned.
Table 3. Attribute list of Greenland and the Arctic. Freq = frequency. T = Total. ‘Knut’ is a polar bear born in Berlin Zoo and Miss Smilla's sense for snow is a novel published in 1992 and that was made into a film in 1997.

The categories were then applied to the suggested model of Echtner and Ritchie (Reference Echtner and Ritchie2003: 43) (Fig. 6). When comparing the Arctic and Greenland, it shows that attributes are mainly averaged in the tangible/holistic and the intangible/attribute dimensions. Common/unique features are rare. These findings link to a balance between the inert and the evoked set of the affective image of both destinations. However, this may not only be induced by the inexperience of travel to either one of the two regions, but also by the interference of the source of information.

Fig. 6. Components of destination images of Greenland and the Arctic (compare Echtner and Ritchie Reference Echtner and Ritchie2003: 43).
The chi-square test brought up only two significant correlations between the features cited and socio-demographics of the respondents. The atmosphere and the gender associated at p = .032 in survey A: three times more women than men named an atmospheric feature. In survey B, age and culture were significant at p = .049. The post-hoc test indicated the greatest disparity between the youngest age group and the 46+ years old with a mean difference of −.273 that was not significant.
For the affective scale, Cronbach's alpha of the four items for the Arctic and Greenland indicated an acceptable reliability with .702 (survey A) and .863 (survey B).
Table 4 portrays the reversed mean scores of the four items. Surprisingly, all means for Greenland are set on the positive side of the scales (M Greenland = (a) 2.52, (b) 2.76, (c) 2.76, (d) 3.12) whereas the Arctic is only positively represented for the sleepy-arousing and the gloomy-exciting attributes (M Arctic = (b) 2.70, (d) 2.93).
Table 4. Reversed mean scores of affective items.

The results were plotted onto a response grid (Fig. 7). The total means of the items (a) and (b) were used to identify the crosshair. Greenland lies closer to the arousing-exciting-pleasant elements whereas the Arctic is represented on the opposite dimensions. A rather positive perception seems to be evoked for Greenland and a rather negative of the Arctic. Yet, as mentioned earlier, attention needs to be paid to the fact that the mean score of the B survey also indicated tendencies towards positive affections and that both destinations are positioned very closely together.

Fig. 7. Response grid.
Based on the overall findings of the affective image, suggestions for marketing include specifically emphasising the existing awareness of the local culture and history in promotions. The fact that the largest number of the Arctic indigenous population live in Greenland and the images of a traditional life in close communion with nature (stressing the environmental features) and the atmosphere this creates should be reinforced. A pictorial example may be the depiction of a traveller fishing with an Inuit and a Viking in a fjord. Underneath it may say: ‘Greenland: where explorers meet the Arctic’. This would intensify its position as reflected in the affective response grid: Greenland is an exciting, but still pleasantly quiet place to be, offering nature and tradition.
The conative element indicated that 16.7% of respondents anticipated journeys to Greenland within the next five years. 45.2% would not think of a visit within this period, whereas one third was indecisive. The chi-square test resulted in no significant associations of travel intention and the socio-demographics of the respondents.
The examination of impacting information sources on the results showed that television and newspapers ranked highest in usage (86.6%/62.9% for the Arctic, 75.2%/47.8% for Greenland), followed by magazines and books. It was surprising that the internet did not play a serious role with only 2.1% and 0.9% respectively. Furthermore, it is observed that although the n-size of the total sample was lower by around 14%, the n-size of information sources was higher by 10%. Accordingly, this points at a broader media coverage of the Arctic than of Greenland which may not be surprising considering the actual size difference of the areas.
Except for one point, a chi-square analysis indicated no significant relation between information sources used and attributes mentioned in the open-ended question: there was a noteworthy association between TV and ice features, t(1) = 4.203(a), p < .040. A cross-tabulation showed that 80% of those who indicated that they had heard of Greenland through TV mentioned at least one ice feature.
On the whole, the results show that images of the Arctic and Greenland held by Germans blend and that perceptions of nature prevail. However, a changing environment (IPCC 2007), specifically relating to climate change, will impact on these features and their fulfilment to some extent. Few tourism-related studies have taken this into account. The fast retreat of the ice, for instance, will not allow for promotions of ice experiences in certain areas of the Arctic (IPCC 2007): ice floats, ice bergs and immense glaciers will simply not be available anymore. The danger towards specific wildlife such as the polar bear and the change to the lifestyle of the Inuit will be similarly affected. Therefore, in the long run it is not the reinforcement, but an adapted strategy to the environment that is supported. The Arctic and Greenland have more to offer than ice. Summers can already become relatively warm and reveal the beauty of the fjords and untouched mountain peaks, offering kayaking, climbing and camping opportunities.
The finding that television had a significant impact on derived ice attributes should be used to help the implementation of a shift towards different features using television as a major medium. It will be a difficult challenge to struggle against the large amount of naïve information affecting the images presented through the medium. Never before has climate change, for instance, been more discussed in the German media than in 2007 (ARD 2007; Welt am Sonntag 2007). But how can this status be effective for tourism in the long run when all have taken their final picture of an iceberg and an Inuit hunting for seals?
Conclusion
In the context of globalisation and of increasing competition, it is not only incumbent on the Arctic tourism operators to promote the whole area as a destination, but also on the regions of it to attain differentiation from the consumer's point of view. This paper attempts to illustrate the overall image of the Arctic and Greenland held in Germany and has pointed out similarities, positive and negative differences between these two destination entities. It has also highlighted strengths and weaknesses that may be considered for strategic marketing to match perceptions of non-experienced travellers.
Findings for the cognitive stage indicated that there was a higher awareness of geographical facts, but a lower awareness of socio-demographical facts for Greenland. A low awareness was also discovered for the Arctic: Canada, Greenland and Norway (Spitsbergen) were the salient regions associated with this area. A knowledge check for Greenland also indicated a lack of in depth familiarity with the territory. Furthermore, it was found that respondents were similarly, positively and negatively alike, conscious of the given attribute pairs. On the whole, functional attributes were less favourable while psychological attributes were perceived as more favourable.
An open-ended question uncovered that ice and environmental features were the keywords with the strongest connection to both destinations. Specific ones (for example ice or cold) dominated in the Greenland and the Arctic survey and, generally, attributes were represented in the tangible/functional and the holistic dimension. It was evident that those referring to the local culture and history were more intensely linked to Greenland. Propositions have been made to stress these elements specifically, although the importance of the residents communicating this image must be highlighted (compare Prideaux and Cooper Reference Prideaux and Cooper2002 as cited in Baker and Cameron Reference Baker and Cameron2008) since the ‘supply side’ (Baker and Cameron Reference Baker and Cameron2008: 82), the residents of a destination, contribute to the sustainability of the image.
An affective scale reflected Greenland on the pleasant-arousing side whereas the Arctic was represented on the unpleasant-sleepy direction. Yet, the results were plotted very closely together and illustrated a balanced view of the attribute items. The findings of the affective stage confirm the findings of Hosany and others (Reference Hosany, Yuksel and Muzaffer2006) of the relevance of brand personality as part of the overall image for Greenland.
The conative stage revealed a large number of Germans considering the possibility of visiting Greenland in the near future. The examination of information sources exposed that TV and newspapers were the major media referred to by respondents when receiving facts concerning either Greenland or the Arctic.
The analysis showed that images of Greenland and the Arctic strongly correlate, but also indicated that the German market does differentiate to a minor extent. Socio-demographics do not seem to influence the image considerably. Only the age of respondents has had a regular impact when assessing the variations of awareness and feelings towards the destination. This was observable for Greenland and the Arctic. Generally, older age groups had a more complex image of Greenland.
Overall, the findings point out that the images of Greenland and the Arctic drawn by Germans are in an early stage of the image formation process, that inert image sets prevail and, thus, fuse. Accordingly, Greenland is not clearly perceived as a salient destination within the Arctic. Nevertheless, the ‘level of abstraction’ (Haahti Reference Haahti1986: 18) showed that Greenland was taken as a representation of the Arctic within the minds of Germans to a substantial extent. Thus, it reveals that those travellers seeking the Arctic experience would widely refer to Greenland as a destination, granting it a dominating position within the Arctic region.


