Introduction
Although the Arctic plays a globally significant role in the ongoing climate change, the long-term climate patterns have been challenging to establish, especially in the High Arctic. The homogenised Svalbard Airport (Longyearbyen) temperature record is one of the rare long-term instrumental temperature series from the High Arctic (Nordli, Reference Nordli2010), but its early part (1912–1920) may be less reliable due to series combination from different sources (Kohler et al., Reference Kohler, Nordli, Brandt, Isaksson, Pohjola, Martma and Aas2002). Because of the scarcity of long instrumental records from the High Arctic, proxy-based indirect reconstructions are needed to interpret Arctic trends in terms of past long-term climate oscillations. This long-term information is crucial for thorough understanding of natural climate dynamics and ongoing and future trends in Arctic climate change from local to regional scales.
In addition to ice core records (Klein et al., Reference Klein, Nolan, McConnell, Sigl, Cherry, Young and Welker2016; Lecavalier et al., Reference Lecavalier, Fisher, Milne, Vinther, Tarasov, Huybrechts and Dyke2017), lake sediment archives are the most useful proxy sources for palaeotemperature reconstructions (Besonen et al., Reference Besonen, Patridge, Bradley, Francus, Stoner and Abbott2008; Kaufman, Reference Kaufman2009). From the variety of different lake sediment palaeolimnological temperature proxies, fossil chironomids (Insecta: Diptera: Chironomidae) have proved most useful for reconstructions of Arctic climate change for several reasons (Thomas, Axford, & Briner, Reference Thomas, Axford and Briner2008; Axford, Briner, Miller, & Francis, Reference Axford, Briner, Miller and Francis2009; Nazarova, Bleibtreu, Hoff, Dirksen, & Diekmann, Reference Nazarova, Bleibtreu, Hoff, Dirksen and Diekmann2017). Most chironomids have aquatic larval stage, which leave behind well-preserved chitinous head capsules (Hofmann, Reference Hofmann1988). Since chironomids are regularly encountered even in the coldest lakes and they are highly sensitive to temperature, with each taxa having a specific temperature preference (Eggermont & Heiri, Reference Eggermont and Heiri2012; Engels, Self, Luoto, Brooks, & Helmens, Reference Engels, Self, Luoto, Brooks and Helmens2014), taxonomical analysis of chironomid head capsules readily provides information on prevailing climate conditions at each chronologically dated interval of a sediment downcore profile. By combining biostratigraphical analysis with available chironomid-based temperature training sets (calibration-in-space), it is possible to provide quantitative estimates of palaeotemperature. In fact, chironomid-based temperature models for the Arctic areas have become more available nowadays with a pan-Arctic coverage (Self et al., Reference Self, Brooks, Birks, Nazarova, Porinchu, Odland and Jones2011; Fortin et al., Reference Fortin, Medeiros, Gajewski, Barley, Larocque-Tobler, Porinchu and Wilson2015; Nazarova et al., Reference Nazarova, Self, Brooks, van Hardenbroek, Herzschuh and Diekmann2015). In this transfer function approach, multivariate statistical models, such as those based on weighted-averaging and partial least squares techniques, relate modern communities (surface sediment assemblages from multiple lakes) to environmental conditions (for example, temperature) that can be further applied to fossil assemblages from deeper sediment layers and reconstructions of past environmental changes (Shala et al., Reference Shala, Helmens, Luoto, Salonen, Väliranta and Weckström2017; Plikk et al., Reference Plikk, Engels, Luoto, Nazarova, Salonen and Helmens2019).
As the Arctic has a large influence on global climate system, the palaeoclimate reconstructions in the Arctic provide a basis to understand longer-term climate trends and to assess the consequences of threshold changes in regional climate system and their dynamics. During the recent decades, most profound warming in the Arctic, including Svalbard (Førland, Benestad, Hanssen-Bauer, Haugen, & Skaugen, Reference Førland, Benestad, Hanssen-Bauer, Haugen and Skaugen2011), has taken place during winter. Moreover, palaeoclimate evidence, which is strongly focused on summer conditions, shows that Arctic summers are now warmer than at any time during at least the last Millennium (Werner, Divine, Ljungqvist, Nilsen, & Francus, Reference Werner, Divine, Ljungqvist, Nilsen and Francus2018). It has also been shown that changes in the length of the ice-free season have triggered a set of interlinked feedbacks that will amplify future rates of summer warming (Chapin et al., Reference Chapin, Sturm, Serreze, McFadden, Key, Lloyd and Beringer2005).
In this study, we use a fossil chironomid biostratigraphy and apply a regional calibration model to quantitatively reconstruct mean July air temperatures from a 300-year-long High Arctic lake sediment profile derived from Revvatnet in Hornsund, southern Svalbard. We test the reconstructed values of the last 100 years against available meteorological data with special interest on differences between summer and annual temperatures. The aims of the study include determining a potential break point for climate warming in southern Svalbard and to assess the significance of possible climate warming trend. We also estimate the rate of climate warming in the study area, which is of high significance since Svalbard is located in the climatically particularly sensitive region at an intersection of Arctic and Atlantic oceanic water masses where the Polar Front develops (Isaksson et al., Reference Isaksson, Divine, Kohler, Martma, Pohjola, Motoyama and Watanabe2005; Majewski, Szczuciński, & Zajączkowski, Reference Majewski, Szczuciński and Zajączkowski2009). Research carried out in the recent decades shows that in the European Arctic, the air temperature increase during the Medieval Warm Period and Modern Warming (MW) correlate with the strong influence of the warm Atlantic water (Wanamaker et al., Reference Wanamaker, Butler, Scourse, Heinemeier, Eiríksson, Knudsen and Richardson2012). In turn, the weakening of the Atlantic Meridional Overturning Circulation and lower heat transport to the Arctic might be responsible for the Little Ice Age (LIA) cooling (Lund, Lynch-Stieglitz, & Curry, Reference Lund, Lynch-Stieglitz and Curry2006). At present, the climate/oceanographic conditions in the west Spitsbergen fjords are shaped mainly by the inflow of warm and highly saline Atlantic waters transported from the south by West Spitsbergen Current (Nilsen, Skogseth, Vaardal-Lunde, & Inall, Reference Nilsen, Skogseth, Vaardal-Lunde and Inall2016). Therefore, considering the unique ocean–atmosphere interplay of the study area, disentangling detailed features of long-term development in the climate of southern Svalbard is invaluable to understand past, present and future large-scale Arctic climate processes, feedback mechanisms and land–ocean–atmosphere interactions.
Material and methods
Study site
Revvatnet (77.022°N, 15.368°E; 30 m a.s.l.) is an oligotrophic lake located near the Hornsund fjord, southern Svalbard (Fig. 1a). The lake has a surface area of 0.9 km2 and a maximum depth of 26 m (Fig. 1b). The measured epilimnetic pH of the lake was 7.6 in June 2013. The average modern July air temperature is 4.8°C (Cisek, Makuch, & Petelski, Reference Cisek, Makuch and Petelski2017) with daily temperatures generally varying between 3°C and 10°C at the Hornsund meteorological station (Norwegian Meteorological Institute) located 4 km southeast from Revvatnet at the Polish Polar Station Hornsund. An approximately 2°C increase in summer air temperature has been instrumentally observed since the initiation of measurements in 1979 (Marsz & Styszyńska, Reference Marsz and Styszyńska2013). The catchment of Lake Revvatnet is characterised by periglacial tundra with outwash plains, ancient marine terraces, talus and proluvial cones, and undulating ground moraine that appear all around the Hornsund Bay and on the hills of adjacent mountains (Ojala et al., Reference Ojala, Arppe, Luoto, Wacker, Kurki, Zajączkowski and Oksman2016). There are several side hanging valleys with active glaciers near Revvatnet, such as Eimfjellbreane, Gangsbreen and Skålfjellbreen, but no geomorphological evidence exists that would suggest glaciers advancing and covering the entire Revvatnet basin during the late Holocene. However, the hydrology of the basin is governed by the discharge of surface run-off waters via creeks into the basin from the north, which at least partly originates from valley glaciers.
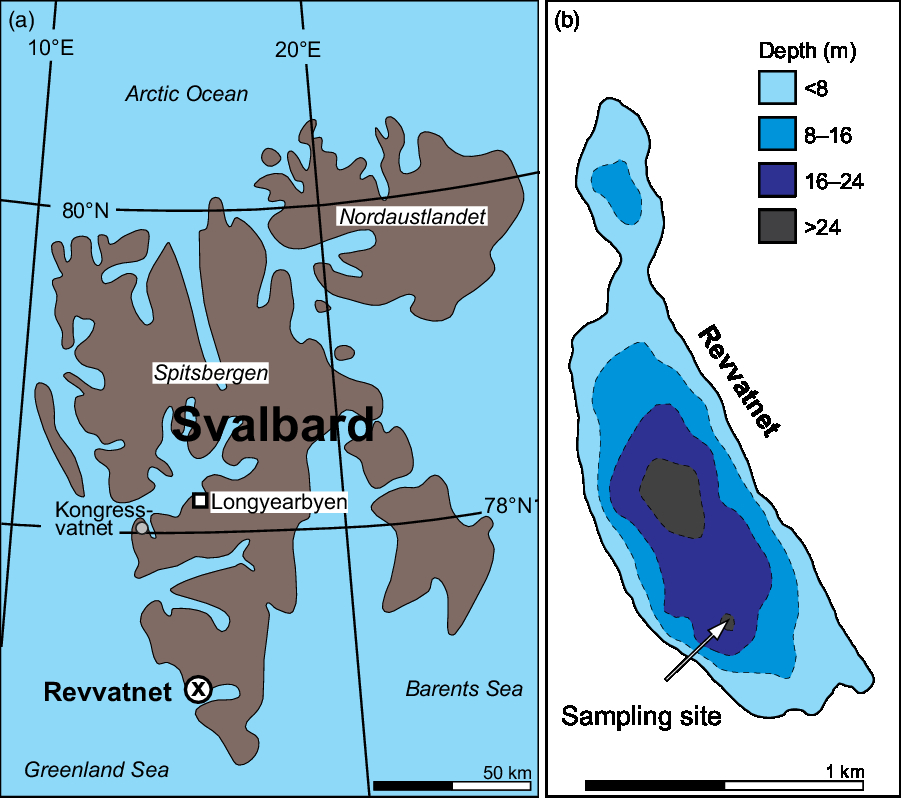
Fig. 1. Location of the study site Revvatnet in southwestern Svalbard (a) together with lake bathymetry (b).
Sediment samples and chironomid analysis
A 30-cm sediment profile RE2 sampled with a Kajak corer in June 2013 was used in the present study. The core was taken from a water depth of 23.5 m (Fig. 1b) as part of a larger lake survey. Further details on sampling can be found from a previous publication (Ojala et al., Reference Ojala, Arppe, Luoto, Wacker, Kurki, Zajączkowski and Oksman2016). 137Cs analysis was used to indicate an age horizon for the atmospheric nuclear weapons testing maximum fallout that occurred in 1963 CE (Fig. 2). The 137Cs analysis was performed using an EG and G Ortec ACETM—2 K gamma spectrometer equipped with a 4-inch NaI/TI detector at the Geological Survey of Finland. The age horizon of the RE2 core was verified by 137Cs analysis of other cores from the lake (RE1, RE3 and RE4).
Fig. 2. 137Cs activity in the sediment cores RE1-4. The 137Cs peak refers to the nuclear weapons testing maximum fallout in 1963 CE. Core RE2 was used in the chironomid analysis.
Results of fossil chironomid community analysis are previously published in a multiproxy paper focusing on long-term ecological shifts, biogeochemical cycling and microplastic accumulation in Revvatnet (Luoto, Rantala, Kivilä, Nevalainen, & Ojala, Reference Luoto, Rantala, Kivilä, Nevalainen and Ojala2019). In brief, standard methods were used for chironomid analysis and a minimum head capsule counting sum per sample was set to 50 (Brooks, Langdon, & Heiri, Reference Brooks, Langdon and Heiri2007). The most common chironomid taxa (≥2 occurrences) are given in Fig. 3.

Fig. 3. Chironomid biostratigraphy of the 10 most common taxa (≥2 occurrences) from Revvatnet (Svalbard). The assemblage compositions are expressed as relative abundance of total chironomids. Full chironomid assemblage composition is published elsewhere (Luoto et al., Reference Luoto, Rantala, Kivilä, Nevalainen and Ojala2019). Also the rare taxa missing from the figure were included in the temperature reconstruction.
Numerical methods
For temperature reconstruction, we used a chironomid-based temperature training set constructed on the basis of several North Scandinavian data sets (Luoto, Reference Luoto2009; Luoto et al., Reference Luoto, Kaukolehto, Weckström, Korhola and Väliranta2014a, Reference Luoto, Rantala, Galkin, Rautio and Nevalainen2016; Luoto & Ojala, Reference Luoto and Ojala2017) and here further updated it with 10 additional High Arctic sites mostly from the Hornsund area and Nordaustlandet. The mean July air temperature gradient of the model is 1.8°C–17.1°C. As the model type, locally weighted-weighted average (LWWA) regression with squared chi-squared distance as the dissimilarity coefficient was used. LWWA is potentially suitable for detecting environmental signal at the training set gradient ends, since it creates ‘local’ data sets (cold lakes in the current case), which have weighted input in the reconstruction. The number of samples in ‘local’ training set was set to 20 and the species data were log10 transformed. The model includes 191 sites and 132 taxa and has jackknife cross-validated coefficient of determination (R 2 Jack) of 0.91, root mean squared error of prediction (RMSEP) of 0.88°C (5.8% of the training set temperature gradient) and mean and maximum biases of 0.11°C and 4.11°C, respectively (Table 1). Sample-specific modelling errors (estimated standard error of prediction = eSEP) in the Revvatnet reconstruction (including all taxa) were determined using bootstrapping cross-validation with 999 iterations.
Table 1. Characteristics of the used chironomid-based calibration set consisting of boreal, subarctic and Arctic lakes.

For comparison with the present reconstruction, we used the temperature data (June to August) published by D’Andrea et al. (Reference D’Andrea, Vaillencourt, Balascio, Werner, Roof, Retelle and Bradley2012), which is based on alkenone unsaturation in Lake Kongressvatnet located ~100 km north from Revvatnet (Fig. 1a). The Kongressvatnet data were obtained from the World Data Center for Paleoclimatology and NOAA’s National Climatic Data Center, Paleoclimatology Branch website (http://www.ncdc.noaa.gov/paleo/paleo.html). In addition, we compared the recent part (past ~100 years) with available meteorological data from the Svalbard (Longyearbyen) airport (~140 km north from Revvatnet) and from Bjørnøya (~300 km south from Revvatnet). The mean annual air temperature data from Longyearbyen and the mean July air temperature data from Bjørnøya were available through the online database of the Norwegian Meteorological Institute (http://eklima.met.no/). The early part (1912–1920) of the Longyearbyen airport record was not used due to doubts on its reliability (Kohler et al., Reference Kohler, Nordli, Brandt, Isaksson, Pohjola, Martma and Aas2002). The temporally adjusted (closest years matched) records were statistically compared using Pearson correlation statistics.
Since the chironomid assemblage data had a linear (non-unimodal) response, the community shifts were assessed using a principal component analysis (PCA) with the program Canoco 5 (Šmilauer & Lepš, Reference Šmilauer and Lepš2014). The PC1 axis scores were compared with site-specific temperatures using Pearson Product-moment correlation coefficient (R), corrected coefficient of determination (R 2 adj) and the level of statistical significance (p < 0.05) to verify that the communities were responding to temperature. Using the modern analogue technique, the cut level of the 2nd percentile of all squared chi-squared distances in the modern calibration data was determined. These distances were then compared with the distance between each fossil assemblage and its most similar assemblage in the modern data set and used to define ‘close’ and ‘no close’ analogues. Fossil samples having values below the 2nd percentile dissimilarity threshold were hence consider to have ‘close’ analogues in the calibration data, and consequently, ability to provide reliable temperature estimates. Segmented regression analysis was used to identify statistically significant break point in the temperature reconstruction applying a minimum confidence level of 95%. The selection of the best break point and function type was based on maximising the statistical coefficient of explanation, and performing tests of significance using the program SegReg (Oosterbaan, Reference Oosterbaan2005).
To assess statistically significant trends in the reconstruction, the Mann–Kendall trend test (Gilbert, Reference Gilbert1987) was used. In the non-parametric test for trend, the S-statistic is negative for a negative trend, zero for no trend and positive for an increasing trend. For a trend to have statistical significance, the p value was required to be <0.05. To further depict general trends and stabilise chronological uncertainty and noise in the reconstructed values, LOESS, sometimes also called LOWESS (LOcally WEighted Scatterplot Smoothing) (Cleveland, Reference Cleveland1979, Reference Cleveland1981), algorithm was applied with a span 0.4. In illustrations of the break point and trend analyses, temperature anomalies standardised to the record mean were used to exclude potential error originating from the fact that the study site locates close to the end of the training set temperature gradient (potential systematic overestimation of temperatures).
Results
The 137Cs analysis of different cores from Revvatnet showed a parallel peak at ~5 cm for all three cores (RE1-3) from the southern basin (Fig. 2). The onset of Cs fallout from nuclear weapons testing in the early 1950s corresponds in RE2 for 6 cm (initial increase, assigned sample-specific year 1953 CE according to linear age modelling) and the maximum fallout in 1963 CE for 5 cm (maximum peak). A faster sedimentation rate was assigned for the northern basin (RE4), which receives melt waters from the glacier and has turbid water column, consequently leading to higher local sediment accumulation rate. Since the rate of sedimentation in the southern basin is consistently of similar magnitude and the 137Cs peak is very distinct, it can be expected that no major and/or sudden changes in the rate of sediment deposition has occurred in this part of the basin. Chronological extrapolation provides an age estimate of ~1720 CE for the bottom core, but since the lower part of the sediment profile lacks chronological control, this estimate is uncertain. The rate of sedimentation in the basin is generally increased towards the present day (with lower rate of compaction), because of climate warming and increase in the catchment-derived material (Ojala et al., Reference Ojala, Arppe, Luoto, Wacker, Kurki, Zajączkowski and Oksman2016; Luoto et al., Reference Luoto, Rantala, Kivilä, Nevalainen and Ojala2019), so if anything, the extrapolated ages are more likely older than younger.
The Revvatnet RE2 sediment profile consisted of 14 taxa (Luoto et al., Reference Luoto, Rantala, Kivilä, Nevalainen and Ojala2019), of which 10 most common (≥2 occurrences) are shown in Fig. 3. All taxa were used in the temperature reconstruction. The most abundant chironomids in Revvatnet were Oliveridia tricornis (abundant between ~1720 and 1980 CE), Micropsectra radialis-type (1720–1820 CE and 1920 CE-present) and Hydrobaenus lugubris-type (1780–1910 CE and 1960 CE-present). Orthocladius trigonolabis-type, O. consobrinus-type and Metriocnemus eurynotus-type increased in the recent sediments.
The primary PC axis 1 scores for chironomids in the Revvatnet record showed little changes (generally between −1 and 0 PCA units) from 1720 CE until values began to increase from the 1940 CE onward (Fig. 4). The highest values were reached between 1980 CE and present (~2–3 PCA units). The secondary PC axis 2 had highest values (~1–2 PCA units) in the mid-stratigraphy (1830–1900 CE) and lowest values between 1720 and 1780 CE and between 1920 and 1940 CE (generally between −1 and −2 PCA units).

Fig. 4. PCA axis scores for chironomids, chironomid-based mean July air temperature reconstruction, sample-specific prediction errors estimated using bootstrapping cross-validation and closest modern analogues in the sediment record from Revvatnet, southwestern Svalbard. Also shown are the alkenone-based temperature reconstruction from Kongressvatnet, western Svalbard (D’Andrea et al., Reference D’Andrea, Vaillencourt, Balascio, Werner, Roof, Retelle and Bradley2012), the model’s prediction error (RMSEP) and the 2 percentile modern analogue dissimilarity threshold.
The chironomid-based mean July air temperature reconstruction resulted in values varying between ~4°C and 8°C (Fig. 4). During the eighteenth century, the temperatures remained at 4°C–5°C. Between 1820 and 1920 CE, the values were slightly higher varying between ~5°C and 6°C. According to the reconstruction, a colder period (~4°C) prevailed in the 1920s and 1930s. Since then, the temperatures rapidly increased reaching 6°C in the 1950s, 7°C in the 1980s and 8°C in the 2000s. The inferred value for the surface sample is higher than the observed July average; however, it is within the general modern July temperature variability of 3°C to 10°C at the Hornsund station. The surface sample also has the highest sample-specific error, which is almost 2°C, while the other samples generally have errors below 1.5°C (Fig. 4). All samples had good modern analogues (2 percentile dissimilarity threshold 7.5 minDC), with the most similar communities in the early and most recent parts of the profile (3–5 minDC) (Fig. 4).
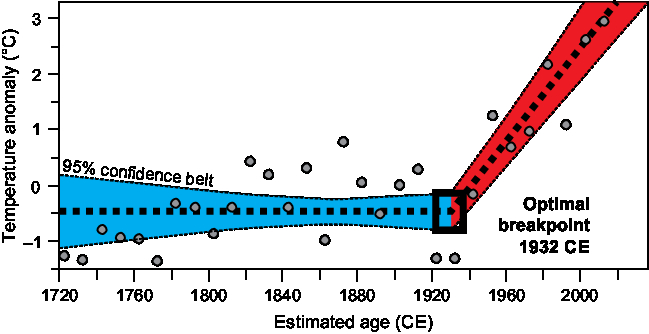
The temperature reconstruction correlated significantly with chironomid primary PC axis with R of 0.82, R 2 adj of 0.65 and p < 0.001. There was no significant correlation (p = 0.145) between inferred temperature and the secondary PC axis. When comparing the temperature reconstructions from Revvatnet and Kongressvatnet (Fig. 4), a significant correlation was found with R of 0.56, R 2 adj of 0.29 and p of 0.001. Both records held a simultaneous initiation of temperature increasing trend from the 1940s onward. Based on the segmented regression analysis, a statistically significant (p < 0.05) optimal break point in the Revvatnet temperature reconstruction was found at 1932 CE. In the regression function, there was a horizontal segment followed by sloping (Fig. 5). The Revvatnet mean July air temperature reconstruction also correlated with the 100-year observational mean annual air temperatures observed at the Longyearbyen airport (R = 0.77, R 2 adj = 0.56 and p of 0.003) and the July temperatures observed in Bjørnøya (R = 0.87, R 2 adj = 0.74 and p of 0.001) (Fig. 6).

Fig. 5. Optimal break point at 1932 CE in the chironomid-inferred temperature reconstruction (grey dots) from Revvatnet (Svalbard) assessed using segmented regression analysis. Shown are the 95% confidence block of the optimal break point and the 95% confidence belt.
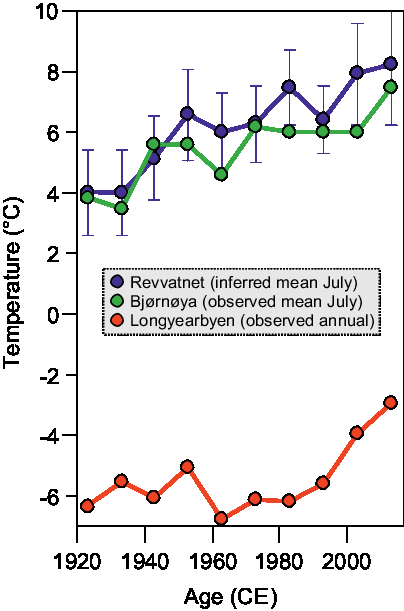
Fig. 6. Chironomid-inferred mean July air temperature reconstruction (blue) with sample-specific errors from Revvatnet (Svalbard) compared with mean annual meteorological observations (red) from Svalbard Airport (Longyearbyen) and mean July air temperature observations (green) from Bjørnøya over the instrumental period (past ~100 years).
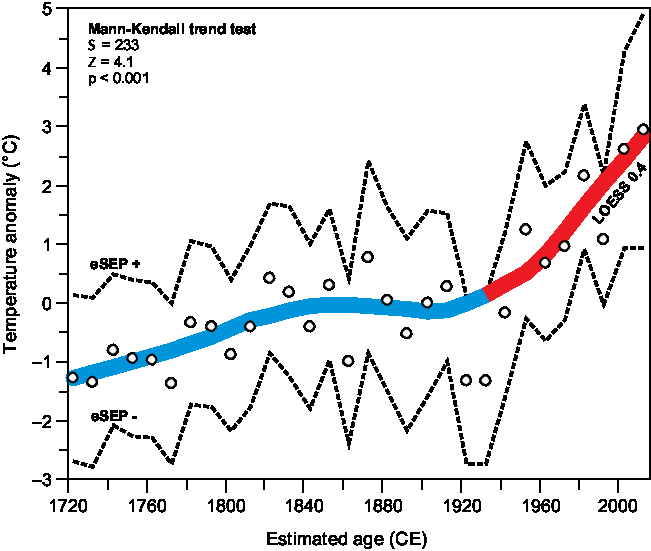
According to the Mann–Kendall trend test, there was a strong (S = 233, Z = 4.1) and statistically significant (p < 0.001) increasing trend in the reconstructed values from Revvatnet (Fig. 7). Following this trend, the LOESS smoothed temperature anomalies (standardised to record mean) turned from negative to positive values in the 1930s. The most negative temperature anomaly (−1.3°C) occurred in the beginning and the most positive (2.3°C) at the end of the sequence.

Fig. 7. Reconstructed summer temperature anomalies (white dots) from the Revvatnet (western Svalbard) sediment record using fossil chironomids and the transfer function approach. According to the Mann–Kendall trend test, there is a statistically significant increasing trend in the samples. To stabilise chronological uncertainty and noise in the reconstructed values, a LOESS smooth was used (blue/red curve). Also shown are the sample-specific errors (eSEP) estimated using bootstrapping cross-validation (dashed lines).
Discussion
Chironomid fauna of the Revvatnet sediment stratigraphy consisted of temperature sensitive taxa, such as the cold-indicating Oliveridia tricornis, which was the most abundant chironomid and continuously present until the 1970s. Another cold-indicating chironomid in the calibration set, Micropsectra radialis-type, thrived during periods 1720–1820 CE and 1920 CE–present. Warmer indicating chironomids included Orthocladius trigonolabis-type, O. consobrinus-type and Metriocnemus eurynotus-type, which increased from the 1970s onward (Fig. 3). Although the latter taxa have been known to have preference for warmer lakes in northern Europe, they are also known to be more common in bird-impacted nutrient-enriched lakes of Svalbard (Brooks & Birks, Reference Brooks and Birks2004; Luoto et al., Reference Luoto, Brooks and Salonen2014b, Reference Luoto, Oksman and Ojala2015). Therefore, this study cannot fully separate the climate signal from the potential influence of increasing bird impact and nutrient enrichment in Revvatnet. However, the size and volume of Revvatnet is considerable compared to bird-impacted strand flat ponds reported by Brooks and Birks (Reference Brooks and Birks2004) and Luoto et al. (Reference Luoto, Brooks and Salonen2014b, Reference Luoto, Oksman and Ojala2015), which is why the contribution of bird guano is probably a less important factor explaining the changes. Also, to confront this problem, we compared the chironomid-inferred temperatures with observational temperature records (meteorological validation of the reconstruction) in the more recent time interval when also these chironomid taxa that potentially favour bird-impacted lakes appeared in the record.
Since the chironomid primary PC axis correlated strongly and significantly with the chironomid-based temperature reconstruction and there was no significant correlation with the secondary PC axis and inferred temperatures, the data suggest that chironomid assemblages in the Revvatnet sequence were responding to the reconstructed environmental variable (cf. de Jong et al., Reference de Jong, Kamenik, Westover and Grosjean2013). As all the fossil assemblages also had good modern analogues in the temperature calibration set (Fig. 4), we were subsequently able to ‘reliably’ reconstruct past summer temperature variability from the Revvatnet core using chironomids. Compared to the temperature reconstruction from Kongressvatnet in western Svalbard (D’Andrea et al., Reference D’Andrea, Vaillencourt, Balascio, Werner, Roof, Retelle and Bradley2012), a similar trend was found (Fig. 4). Although these two proxy-based reconstructions had statistically significant correlation, they also exhibited differences, which however, may be partly owing to the inaccuracy rising from the extrapolated lower part (below 7 cm/prior 1950s) of the Revvatnet record. Nonetheless, mismatch in ages would likely worsen the correlation between the two records rather than improve it.
The warmer temperatures within the LIA at Kongressvatnet between 1740 and 1770 CE were not as clearly present in the chironomid-based reconstruction at Revvatnet. Although it has been shown from elsewhere in Scandinavia that the LIA was not uniformly cold but often separated in two cold phases (Zawiska et al., Reference Zawiska, Luoto, Nevalainen, Tylmann, Jensen, Obremska and Walseng2017), it is also clear that it had marked spatial variability in timing and magnitude even between relatively adjacent sites (Tiljander, Saarnisto, Ojala, & Saarinen, Reference Tiljander, Saarnisto, Ojala and Saarinen2003; Rantala, Luoto, & Nevalainen, Reference Rantala, Luoto and Nevalainen2016; Luoto et al., Reference Luoto, Kivilä, Rantala and Nevalainen2017a). Even today, the temperature varies considerably across the Svalbard High Arctic archipelago having an influence on permafrost and glacier activity (for example, Humlum, Instanes, & Sollid, Reference Humlum, Instanes and Sollid2003; Marsz & Styszyńska, Reference Marsz and Styszyńska2013). Martín-Moreno, Allendo Álvarez and Ove Hagen (Reference Martín-Moreno, Allendo Álvarez and Ove Hagen2017), for example, concluded that the influence of the LIA climate on glaciers was dissimilar in different parts of Svalbard depending on local climate but also glacier dynamics and surging. Pawłowska et al. (Reference Pawłowska, Zajączkowski, Łącka, Lejzerowicz, Esling and Pawłowski2016) revealed a sharp change in the sea-environmental conditions in central Hornsund at ~1800 CE and their study on the ancient foraminiferal DNA (aDNA) revealed that the transition to the LIA between 1600 and 1800 CE was well marked by the increase in the percentage of monothalamous foraminifera aDNA sequences (mainly from genus Bathysiphon) and additionally by low sediment accumulation rate and low ice rafted debris (IRD) flux. This provided that the position of the glacier fronts was relatively distant to the fjord centre; however, the fjord was influenced by the Arctic waters and melt waters (Pawłowska et al., Reference Pawłowska, Zajączkowski, Łącka, Lejzerowicz, Esling and Pawłowski2016). Hence, the differences between lacustrine and marine records may result from the direct contact of fjord waters with developed tidal glaciers fronts.
Furthermore, the alkenone-based reconstruction from Kongressvatnet did not show as distinct temperature rise from the 1940s onward as the current chironomid-based reconstruction from Revvatnet. Curiously, the largest sample-specific errors in the chironomid-based reconstruction are in the more recent samples (Fig. 4) that could imply more uncertain temperature estimations. Nonetheless, there are close modern analogues in the training set for the samples in the later part of the core suggesting that the reconstruction does not become less reliable. As the best way to determine reliability of a temperature reconstruction is to compare the inferred values against instrumentally observed values over the observational period (Larocque-Tobler, Filipiak, Tylmann, Bonk, & Grosjean, Reference Larocque-Tobler, Filipiak, Tylmann, Bonk and Grosjean2015), we tested the Revvatnet reconstruction against available mean July meteorological temperatures from Bjørnøya and annual meteorological temperatures from Longyearbyen (Fig. 6). In addition to statistically significant correlation between the Revvatnet temperatures and the observational records, we also found that the summer time records were similar in their magnitude of recent change suggesting that the current reconstruction is reliable also in the most recent sediment section.
Similar to the hydroclimatic appearance of the LIA (Helama, Luoto, Nevalainen, & Edvardsson, Reference Helama, Luoto, Nevalainen and Edvardsson2017; Linderholm et al., Reference Linderholm, Nicolle, Francus, Gajewski, Helama, Korhola and Väliranta2018), there is distinct spatial variability in the onset of the MW in northern Scandinavia (Weckström, Korhola, Erästö, & Holmström, Reference Weckström, Korhola, Erästö and Holmström2006; Matskovsky & Helama, Reference Matskovsky and Helama2014; Luoto & Nevalainen, Reference Luoto and Nevalainen2017). The segmented regression analysis of the Revvatnet reconstruction showed a horizontal segment followed by sloping with the statistically significant break point at 1932 CE (Fig. 5), hence indicating that a climate warming threshold occurred in the 1930s. A similar climate warming development of the past century has been meteorologically observed from Bjørnøya, 300 km south of Revvatnet (Fig. 6). Similarly between the inferred and observed mean July air temperature records, the temperatures rapidly increased in the 1930s and 1940s but stabilised to only a slight warming from the 1950s until a new distinct temperature increase during the most recent decades. The annual mean air temperature observations from Longyearbyen airport, 140 km north of Lake Revvatnet, show partly differing story with temperatures remaining constantly low during the past century until a slow progressive increase in the 1960s followed by rapidly increasing trend during the most recent decades, which is similar to the Revvatnet and Bjørnøya summer temperature records (Fig. 6). The differences between mean July and mean annual temperature records suggest significant variability between seasonal temperature trends in Svalbard. In previous palaeoclimatic studies from Lake Svartvatnet, located 15 km south of Lake Revvatnet, it has been shown that in centennial-scale chironomid-based mean July air temperature and stable oxygen isotope-based mean annual air temperature reconstructions, the general trends are similar but significant differences occur in the magnitude of climate changes (Arppe et al., Reference Arppe, Kurki, Wooller, Luoto, Zajączkowski and Ojala2017; Luoto & Nevalainen, Reference Luoto and Nevalainen2018). These studies, however, were conducted with significantly lower resolution for the last centennial than in the present study, but for example, the late Holocene cooling trend (cf. Wanner et al., Reference Wanner, Beer, Bütikofer, Crowley, Cubasch, Flückiger and Küttel2008) was less pronounced in the annual record, while the annual record demonstrated a much more prominent LIA signal together with emphasised MW compared to the summer temperature record. Therefore, the present findings well agree with the previous evidence on that summer, and annual temperature trends have similar general trends, but also significant differences in magnitude and timing, highlighting the significance of seasonal climatic components in the High Arctic.
According to meteorological observations in Hornsund, the summer air temperatures have increased 2°C since the beginning of instrumental measurements in 1979 (Marsz & Styszyńska, Reference Marsz and Styszyńska2013). This agrees well with our present reconstruction, which shows an increase from 6.3°C in the mid-1970s to the present 8.3°C (Fig. 4). The ~2°C rise also concurs with the Bjørnøya observational record of mean July air temperatures, whereas in the observed annual temperatures from Longyearbyen there is an over 3°C temperature increase since the 1980s. Therefore, it appears clear that winter warming is even greater than summertime warming in Svalbard. For Svalbard, climate projections also suggest greater temperature increase in the future during winter than summer (Førland et al., Reference Førland, Benestad, Hanssen-Bauer, Haugen and Skaugen2011).
A palaeoclimate synthesis of Arctic-wide mean summer temperatures has shown that the Arctic cooling trend, which was culminated during the LIA, was reversed during the twentieth century, with warmest decades occurring between 1950 and 2000 CE (Kaufman et al. Reference Kaufman, Schneider, McKay, Ammann, Bradley and Briffa2009). The present results from Revvatnet are in agreement with these pan-Arctic temperature anomalies (Fig. 7). The current sediment record extends back in time to the early eighteenth century, when the LIA was still at its coldest in northern Europe (Osborn & Briffa, Reference Osborn and Briffa2006; Zawiska et al., Reference Zawiska, Luoto, Nevalainen, Tylmann, Jensen, Obremska and Walseng2017). Compared to the modern temperature inferred from the topmost sediment sample, the coldest temperatures inferred in the eighteenth century were 4.3°C lower (Fig. 7). This difference between the present and LIA temperatures is hence considerably larger than the 2°C difference estimated from boreal northern Europe (Luoto, Reference Luoto2013) but at similar magnitude as in the northeastern European Russian Arctic (5°C) (Luoto et al., Reference Luoto, Kuhry, Holzkämper, Solovieva and Self2017b), underlining the influence of Arctic climate amplification. Our data show a statistically significant temperature increasing trend from the LIA towards the present with more stable 100-year period between ~1820 and 1920 CE (Fig. 7), probably reflecting the time phase between the LIA and the MW that was characterised by reduced variability in the North Atlantic Oscillation index (Trouet et al., Reference Trouet, Esper, Graham, Baker, Scourse and Frank2009; Luoto & Nevalainen, Reference Luoto and Nevalainen2018). According to the break point analysis (Fig. 6) and LOESS trend (Fig. 7), a climate warming threshold in the 1930s was assigned. The temperature increase from the 1720 to 1820 CE was relatively rapid, approximately 0.2°C per decade, but the temperature increase from the 1930s until present clearly exceeds this being approximately 0.5°C per decade (Fig. 7). Previously, the temperature increase from the 1960s to 2050 CE has been projected to be 0.3°C per decade (Hanssen-Bauer, Reference Hanssen-Bauer2002), which is slightly lower than suggested for the period from 1960 CE to present day by the current reconstruction. In these temperature comparisons, it should be noted though that the used temperature calibration model has an RMSEP of 0.88 C and the sample-specific errors vary between 1.1°C and 2.0°C. While these uncertainties are seemingly large compared to the late Holocene climate oscillations, it is likely that potential errors deriving from the chironomid-based temperature estimates are systematic between the focal samples throughout the profile considering that temperature is the dominant community forcer and secondary environmental factors do not play a significant role (Heiri, Birks, Brooks, Velle, & Willassen, Reference Heiri, Birks, Brooks, Velle and Willassen2003; Brooks Reference Brooks2006). Moreover, the RMSEP of the model used in this study is much lower than reported from other existing chironomid-based temperature transfer functions, such as the widely used Swiss, Norwegian and their combined version with RMSEPs of 1.3–2.6°C (Heiri et al., Reference Heiri, Brooks, Birks and Lotter2011). Therefore, the results of this study well manifests the exceptional speed and scale of the ongoing climate warming in southern Svalbard and provides an important perspective for estimations of the present and future Arctic environmental change.
Conclusions
The present 300-year-long reconstruction of mean July air temperature from Revvatnet showed significant correlation with a previous palaeolimnological reconstruction from Kongressvatnet, ~100 km north from our study site, however, with more distinct recent warming. The Revvatnet palaeotemperature record also correlated significantly with the meteorological mean July temperatures from Bjørnøya over the observational period (100 years) showing close correspondence. Compared to instrumental temperatures from Svalbard Airport (~140 km north), the initiation of rapidly increased temperatures occurred earlier in the summer temperature records than in the annual temperature record. According to the break point analysis, a climate warming threshold occurred in the summer temperatures in the 1930s. We also found that the climate warming trend was progressive and statistically significant. Since the LIA, the summer temperatures have increased by >4°C being far greater warming than in continental Scandinavia. Following the break point in temperature increase in the 1930s, the warming rate has been as much as 0.5°C per decade. These findings hence emphasise the influence of Arctic amplification and significance of seasonal climate components and suggest climate warming that is exceptional in its magnitude. The scale of temperature change over the past century proposes cascading environmental impacts in this climatically ultrasensitive region, where significant environmental and ecological shifts have already been observed.
Author ORCIDs
Tomi Luoto, 0000-0001-6925-3688
Acknowledgements
We are grateful to Laura Arppe, Mimmi Oksman, Mateusz Damrat, Joanna Pawłowska and the crew of the Polish Polar Station Hornsund for their help with the fieldwork. Constructive comments by two journal reviewers are greatly appreciated.
Financial support
This work was supported by the Emil Aaltonen Foundation (T.P.L., grants numbers 160156, 170161, 180151); Kone Foundation (T.P.L., grant number 090140); Academy of Finland (A.E.K.O., grant number 259343); and the National Science Centre in Poland (M.Z., grant number 2016/21/B/ST10/02308).