Introduction
Climate records from ice cores and geomorphological and sedimentological evidence show that the temperature increase following the Last Glacial Maximum (LGM) began on the Antarctic continent at 18 ky (Bentley et al., Reference Bentley, Cofaigh, Anderson, Conway, Davies, Graham and Zwartz2014; Denton et al., Reference Denton, Anderson, Toggweiler, Edwards, Schaefer and Putnam2010; Stenni et al., Reference Stenni, Buiron, Frezzoti, Albani, Barbante, Bard and Udisti2011). One of the main environmental consequences of this warming was the appearance of ice-free areas in regions of the maritime Antarctic where the Equilibrium Line Altitude was close to sea level. This glacial retreat was clearly observed in the South Shetland Islands (SSI), where present-day mean annual air temperatures at sea level are between −1 and −2 °C (Oliva et al., Reference Oliva, Navarro, Hrbáček, Hernández, Nývlt, Pereira and Trigo2017a).
Based on currently available geochronological data (mostly from lacustrine and marine records), the deglaciation of the northern fringe of the western Antarctic Peninsula Region started between 14 and 15 cal ky BP and continued throughout the Holocene (Ingólfsson, Hjort, & Humlum, Reference Ingólfsson, Hjort and Humlum2003; Ó Cofaigh et al., Reference Ó Cofaigh, Davies, Livingstone, Smith, Johnson, Hocking and Simms2014). In the case of the SSI, the margins of the largest deglaciated areas became ice-free during the early Holocene, as inferred from lake records in Fildes Peninsula, King George Island (Watcham et al., Reference Watcham, Bentley, Hodgson, Roberts, Fretwell, Lloyd and Moreton2011) and Byers Peninsula, Livingston Island (Oliva et al., Reference Oliva, Antoniades, Giralt, Granados, Pla-Rabes, Toro and Vieira2016; Toro et al., Reference Toro, Granados, Pla, Giralt, Antoniades, Galán and Appleby2013). Surface exposure dating using atmospheric 36Cl on Barton Peninsula, King George Island, suggested that the remaining ice caps (which still cover 85–90% of the SSI) started thinning at 15.5 ky, which continued throughout the Holocene (Seong et al., Reference Seong, Owen, Lim, Yoon, Kim, Lee and Caffee2009). This timing is in agreement with marine records from Maxwell Bay, King George Island, which indicates that glacial retreat began between 14.1 and 14.8 cal ky BP (Milliken, Anderson, Wellner, Bohaty, & Manley, Reference Milliken, Anderson, Wellner, Bohaty and Manley2009; Simms, Milliken, Anderson, & Wellner, Reference Simms, Milliken, Anderson and Wellner2011) or potentially earlier at 17 cal ky BP (Yoon, Han, Park, Oh, & Chang, Reference Yoon, Han, Park, Oh and Chang1997). The implications of this retreat for both terrestrial and marine ecosystems were significant and included changes in the distribution of vegetation (Fretwell, Hodgson, Watcham, Bentley, & Roberts, Reference Fretwell, Hodgson, Watcham, Bentley and Roberts2010) and changing geomorphological dynamics (López-Martínez, Serrano, Schmid, Mink, & Linés, Reference López-Martínez, Serrano, Schmid, Mink and Linés2012; Oliva & Ruiz-Fernández, Reference Oliva and Ruiz-Fernández2015; Ruiz-Fernández & Oliva, Reference Ruiz-Fernández and Oliva2016; Ruiz-Fernández et al., Reference Ruiz-Fernández, Oliva, Nývlt, Cannone, García-Hernández, Guglielmin and López-Martínez2019).
This study focuses on Barton Peninsula, an ice-free area in the southwest corner of King George Island, northern SSI. Our aim is to expand our understanding of the deglaciation process in this peninsula through the integrated study of both geomorphological features and lake sediment records. Geomorphological observations reveal a sequence of environmental stages that took place following the onset of deglaciation. Furthermore, we describe lacustrine sedimentary sequences and tephrostratigraphy from five lakes distributed around the peninsula; we present radiocarbon dates indicative of the onset of lacustrine sedimentation and therefore of glacial retreat; and we improve the chronological framework of the deglaciation process in the Barton Peninsula by providing new ages for its south-eastern region, where cosmogenic dates are lacking.
Study area
King George Island is the largest island in the SSI archipelago. Glaciers cover more than 90% of its total area (Osmanoğlu, Braun, Hock, & Navarro, Reference Osmanoğlu, Braun, Hock and Navarro2013). Aside from the Fildes Peninsula – the island’s largest ice-free area – there are several small ice-free enclaves along the margins of this island, of which Barton Peninsula is one. This peninsula, located between Maxwell Bay and Collins Glacier, has a rough orography with elevations exceeding 290 m asl (Fig. 1).
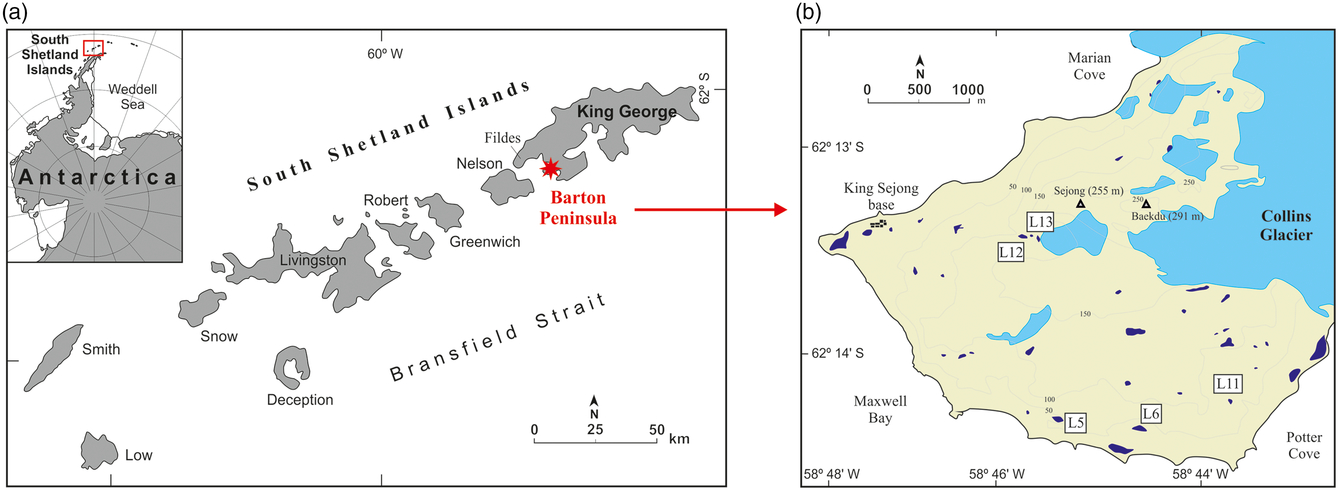
Fig. 1. Location of Barton Peninsula within the South Shetland Islands and the Antarctic Peninsula Region (a), with the distribution of the studied lakes in Barton Peninsula (b).
The retreat of Collins Glacier during the Holocene exposed an ice-free area of ca. 8 km2, where numerous lakes are distributed in glacial depressions and/or dammed by moraines (Fig. 1). Several of these lakes were cored for paleoenvironmental purposes (Fig. 2, Table 1).
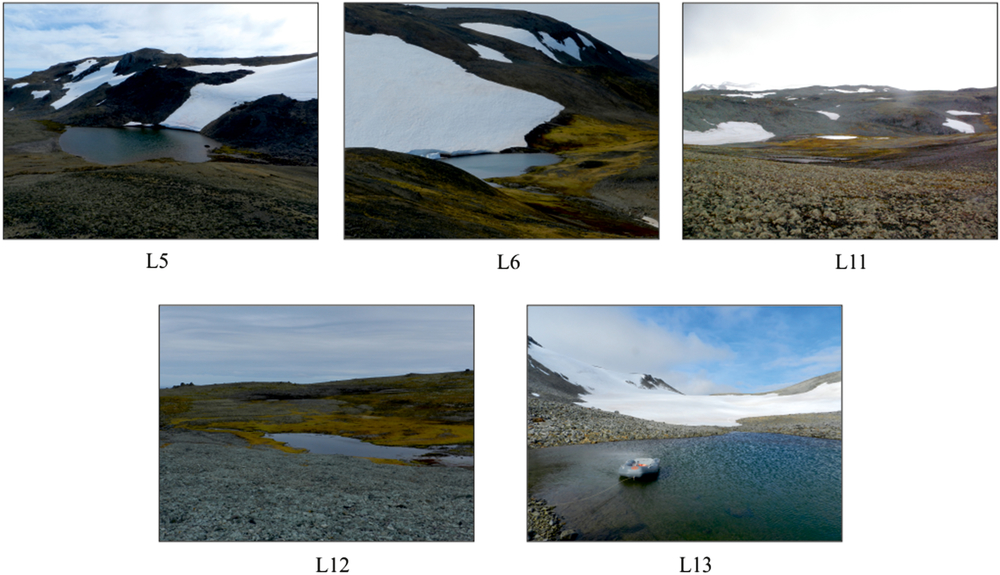
Fig. 2. Pictures of the lakes cored in Barton Peninsula.
Table 1. Main limnological and morphological data of the lakes studied in this research.

Instrumental climate records at the South Korean King Sejong Station at 11 m asl between 1998 and 2014 showed a mean annual temperature of −1.8 °C and an annual precipitation of 598 mm (1988–2014). Barton Peninsula is predominantly composed of igneous rocks (extrusive volcanics and intrusive granites) of Paleogene age that are heavily weathered where exposed (Davies, Reference Davies1982; Lee et al., Reference Lee, Yur, Yoo, Yeo, Kim, Choe and López-Martínez2002). The peninsula has been intensely shaped by glaciers, periglacial, marine and tectonic processes, with the formation of several raised marine platforms between sea level and the highest peaks (López-Martínez, Serrano, & Lee, Reference López-Martínez, Serrano and Lee2002; Serrano & López-Martínez, Reference Serrano and López-Martínez2004). In the ice-free areas of the SSI, periglacial processes are widespread. Permafrost is sporadic near the coast, with rock glaciers showing the lowest permafrost patches and becoming continuous only at higher elevations (Bockheim et al., Reference Bockheim, Vieira, Ramos, López-Martínez, Serrano, Guglielmin and Nieuwendam2013; Correia, Oliva, & Ruiz-Fernández, Reference Correia, Oliva and Ruiz-Fernández2017; Hrbáček et al., Reference Hrbáček, Vieira, Oliva, Balks, Guglielmin, de Pablo and Miamin2018; Oliva et al., Reference Oliva, Hrbáček, Ruiz-Fernández, De Pablo, Vieira, Ramos and Antoniades2017b; Vieira et al., Reference Vieira, Bockheim, Guglielmin, Balks, Abramov, Boelhouwers and Wagner2010). The vegetation cover of the peninsula is scarce and comprises small patches of grass, and prevailing communities of mosses and lichens (Ruiz-Fernández, Oliva, & García-Hernández, Reference Ruiz-Fernández, Oliva and García-Hernández2017).
Materials and methods
Geomorphology
Geomorphological mapping was conducted in the summer when the landscape was free of snow and landforms features were clearly visible. We mapped the landforms and deposits in the field at 1:10000 scale and presented the resulting map in López-Martínez et al. (Reference López-Martínez, Serrano and Lee2002). Here, we use the main geomorphological units identified in that map as the basis from which to reconstruct past glacial phases in Barton Peninsula. The geomorphological sketch presented in Figure 3 includes the main moraine systems, marine platforms and raised beaches as well as the distribution of lakes.

Fig. 3. Geomorphological sketch with the distribution of the main landforms and deposits in Barton Peninsula (modified from Serrano & López-Martínez, Reference Serrano and López-Martínez2004).
Lake sediments
Five lakes from Barton Peninsula were cored from January to February 2012 (see Table 1), using a gravity/percussion corer deployed from an inflatable boat. The sediment cores were stored at +4 °C in a dark room until opened at the Institute of Earth Sciences Jaume Almera (ICTJA-CSIC, Barcelona, Spain). A moss sample was radiocarbon dated in lake L12, but due to a lack of moss remnants, bulk sediment samples from the bottom of the other cores were processed for 14C Accelerator Mass Spectrometry (AMS) dating at the Beta Analytic (Miami, USA) and Centro Nacional de Aceleradores (Seville, Spain) laboratories. Radiocarbon dates were calibrated using CALIB 7.1 with the SHCal13 calibration curve (Reimer et al., Reference Reimer, Bard, Bayliss, Beck, Blackwell, Bronk Ramsey and van der Plicht2013) and selecting the median of the 95.4% distribution (±2σ probability interval; see Table 2).
Table 2. Results of AMS 14C dating with samples from the three lakes with living and subfossil mosses.

Tephrochronology
Tephra, in the form of ash-sized volcanic material, was sampled from six visible layers from lacustrine records: three from lake L6 and three from lake L5. Samples were cleaned in an ultrasonic bath for 5 min to remove organic material and dried overnight in an oven at 80 °C. Dried samples were sieved to separate material >125 μm, which was uncontaminated by disaggregated organic material, and mounted in epoxy resin. Major element compositions in matrix glass were measured on carbon-coated polished grain mounts using the Cameca SX100 electron microprobe (EPMA) at the University of Bristol, UK. Analyses were performed under operating conditions of 15 kV accelerating voltage and 4 nA beam current using a defocused beam (10 μm) to minimise sodium mobility. A combination of mineral and glass standards was used for calibration. Analyses of secondary standards (KK1, BCR2 and Diopside) were repeated each day to identify any instrumental drift, for which no corrections were necessary. Precision on major elements was assessed from the reproducibility (2σ) of repeat analyses of standard materials: <1% for FeO, <2% for SiO2, Al2O3, CaO, <3% for MgO, TiO2 and <5% for K2O. Counting times were 10 s for Na, Si, Al, K and Ca, and 30 s for Mg, S, P, Ti, Fe and Mn, over a total analysis time of 60 s. Analyses that were contaminated by crystal phases were excluded. All compositions are shown as oxides normalised to anhydrous composition (see Table 3). Multivariate analysis in the form of principal component analysis (PCA) was applied to standardised (z-scored) matrix glass compositions using RStudio statistical software (RStudio, Inc. Boston, USA) (prcomp function) to explore and quantify the variance in the data set. PCA is a statistical procedure for dimensionality reduction: for a set of samples, the process reduces n independent variables to n−1 principal components made up of weighted combinations of the original variables (loadings). Generally, between two and four principal components account for most of the variances within a data set; therefore, PCA plots of PC1 versus PC2 provide a way to visualise the relationships between samples based on multiple characteristics. Na2O, MnO, P2O3 and SO2 were excluded from the PCA input matrix due to the larger uncertainties on these minor/volatile elements. Rhyolitic glass compositions in L6-A were excluded from the PCA analysis, as they dominated the variance and, therefore, masked differences in basaltic glass composition.
Table 3. Mean average major element glass compositions (as weight percent oxides, normalised to anhydrous composition) and standard deviations (SD) of sampled tephra layers from lakes L5 and L6.

Results
Geomorphological setting
The distribution of glacial and periglacial features suggests the existence of several stages during the long-term deglaciation of this peninsula. We identified three moraine systems in Barton Peninsula (Fig. 3):
(1) The Outer moraine complex (I) is formed by the lateral moraines of the tidewater glacier that occupied Marian Cove, distributed on the raised beach at +9 m asl, as well as the frontal moraine ridges at the southeast margin of the peninsula at elevations between 80 and 150 m asl. Lakes L5, L6 and L11 are located ahead of this moraine complex on relatively flat surfaces associated with the Upper (L11) and the Middle (L5 and L6) marine platforms.
(2) The Intermediate moraine complex (II) consists of frontal and lateral moraines distributed in two areas: (a) along the SE fringe of the peninsula, frontal moraines of the ice dome are located between 140 and 145 m asl and (b) in the northern and western areas, with lateral and frontal moraines located ca. 150 m downslope from the small glaciers formed in a cirque shaped between the Sejong (255 m asl) and Baekdu (290 m asl) peaks (Araon Valley). Lake L12 is dammed by this moraine complex.
(3) The Inner moraine complex (III) is formed by small frontal moraines located in the glacial cirques, as well as on the edge of the present-day dome glacier. Whereas the first sets of moraines are distributed at elevations 110–150 m asl (W) and 150–175 m asl (E), the others are located below the raised beach of +3 m asl, thus being reshaped by present-day marine processes. Lake L13, located ca. 30 m from the present-day glacier front, is dammed by this moraine system.
Lacustrine sedimentary sequences
The complete sedimentary sequence was collected from lakes L6, L11, L13 and possibly in L12, but not in lake L5 (Fig. 4) where we could not reach the lowermost sediments. A similar situation occurred in a number of other lakes across Barton Peninsula, where the presence of gravels precluded the recovery of underlying sediments. The lake sediment cores from Barton Peninsula showed very different characteristics in terms of lithological composition and colouration (Fig. 4).

Fig. 4. Pictures of the cores with the available 14C dates for the sedimentary sequences and the analysed tephra layers in L5 and L6 cores (numbers denote the sediment units).
Lake L5 record
A 43-cm-long core recovered from lake L5 contained inorganic sediments:
– Unit 1 (43–29 cm) was composed of centimetric, faintly banded yellow, brown and red sediments with some gravels (Ø < 5 mm). A bulk sediment sample from the depth 42 cm was dated at 2890 ± 55 cal yr BP.
– Unit 2 (29–5 cm) included alternating 3-cm-thick black tephra layers and yellow silty layers. These tephra layers were present at 20.2–21.5, 17–18.5 (L5-A) and 15–15.5 (L5-B) cm depth.
– Unit 3 (5–0 cm) showed alternating millilitre-scale black and yellow silty layers. A dark, coarse-grained tephra layer was found at the base of the unit (4–4.5 cm; L5-C). The base of this unit was dated at 1340 ± 45 cal yr BP.
Lake L6 record
A 98-cm-long core collected from lake L6 contained three lithological units:
– Unit 1 (98–65 cm) contained alternating centimetre-thick layers of light and dark grey silty sediments. A coarse-grained dark tephra layer of variable thickness between 5 and 10 mm was found at a depth 86–87 cm (tephra L6-A). A bulk sediment sample from the depth 94 cm was dated at 7940 ± 45 cal yr BP.
– Unit 2 (65–27 cm) was composed of massive dark brown silts, with dark sandy layers at 34–36 and 51–53 cm that are interpreted as tephra layers.
– Unit 3 (27–0 cm) was made up of centimetric-scale light and dark banded coarse-grained sediments. A 2-cm-thick coarse-grained dark tephra layer was found at the base of the unit (25–27 cm depth; L6-B), overlain by 3 cm of fine, dark, sandy, ash-rich sediment. A 5-mm fine-grained dark tephra horizon with a sharp base is present at 16–16.5 cm depth (L6-C).
Lake L11 record
A 24-cm-long core retrieved from lake L11 showed major changes in terms of colour and texture properties:
– Unit 1 (24–11 cm) was composed of sandy–silty sediments with some gravels at the base (Ø < 5 mm). The 14C sample of bulk sediment from the base of the unit returned an age of 3720 ± 110 cal yr BP.
– Unit 2 (11–4.5 cm) contained coarse-grained sediments, with gravel up to 20 mm in a sandy matrix. Some moss remnants were present in the upper part of this unit.
– Unit 3 (4.5–0 cm) consisted of light brown organic-rich silty sediments.
Lake L12 record
A 37-cm-long core was collected from lake L12, which displayed a centimetre-scale alternation of light and dark grey silty clays. This sequence had a pronounced dip (up to 40°) at the bottom, progressively decreasing towards the top of the core. A number of moss layers were interbedded in this section. The moss layer near the core base provided a calibrated age of 2440 ± 80 cal yr BP. In the uppermost 13 cm of the core, several millimetre- to centimetre-thick dark layers, interpreted as tephra deposits, were present.
Lake L13 record
A 30-cm-long core was collected from lake L13 and contained four different lithological units:
– Unit 1 (30–27 cm) was composed of gravels (Ø < 30 mm) embedded in a sandy matrix.
– Unit 2 (27–17 cm) was made up of dark grey massive silty clays with some scattered gravels (Ø < 5 mm). A bulk sediment sample at 21 cm depth returned an age of 4660 ± 90 cal yr BP.
– Unit 3 (17–10 cm) was composed of dark grey fine sands. An irregular-shaped 1-cm-thick tephra layer constituted the base of this unit (L13-A).
– Unit 4 (10–0 cm) included a centimetre-scale alternation of dark and light grey silty clays and fine sands. Two tephra layers were observed at 9–10 cm (L13-B) and 4.5–8 cm (L13-C) depth.
Tephra layers
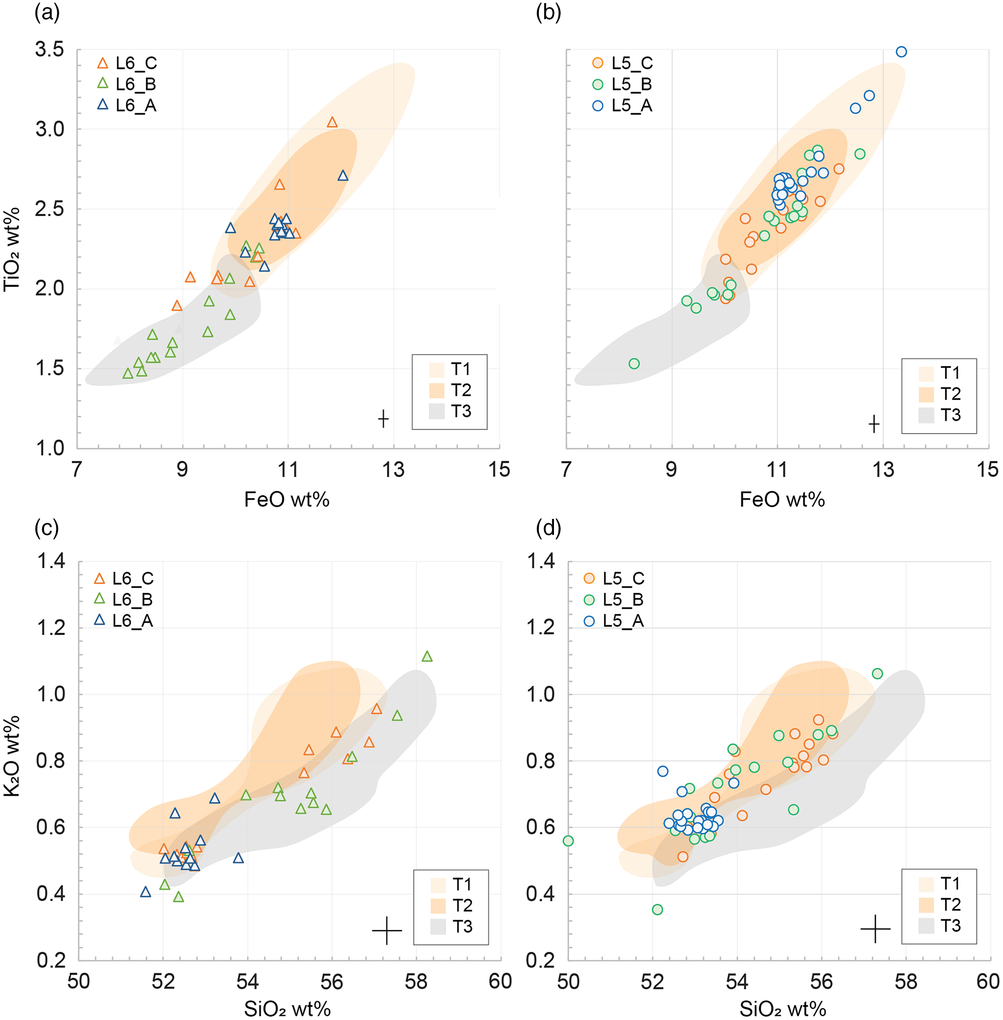
Tephra layers from the two best preserved lake cores (L5 and L6) were selected for geochemical analyses (Fig. 4). Average major element glass compositions from six sampled tephra layers are presented in Table 3 (additional data are presented in Supplementary Table A). The analysed tephras were generally basaltic to basaltic andesite in glass composition (50–58 wt% SiO2; Fig. 5). However, L6-A was compositionally bimodal; although most tephra grains comprised basaltic glasses, a minor population were characterised by higher silica glasses of rhyolitic composition (52–55 and 72–73 wt% SiO2, respectively).

Fig. 5. Matrix glass compositions of sampled visible tephra layers from (a,c) lake L6 and (b,d) lake L5, expressed as anhydrous oxides. Black crosses (lower left) represent uncertainties (2σ) based on standard repeats. For comparison, shaded regions correspond to the range of published tephra compositions for T3 (grey) and T1/T2 (light/dark orange) layers from Byers Peninsula (Liu et al., Reference Liu, Oliva, Antoniades, Giralt, Granados, Pla-Rabes and Geyer2016).
Considered together, basaltic glasses from all layers reproduced trends that mirror expected liquid lines of descent for mafic mineral crystallisation (i.e. olivine, plagioclase and clinopyroxene; Fig. 5). L6-A and L5-A were characterised by relatively homogeneous glass compositions with small standard deviations, while stratigraphically higher tephra layers exhibited much greater variance. This increased variance may reflect true magmatic geochemical processes at source, variable degrees of post-depositional chemical alteration or reworking of multiple tephra deposits. L6-A, L6-C, L5-A, L5-B and L5-C occupied overlapping compositional fields with respect to most major elements. However, L6-B was compositionally distinct outside of analytical uncertainty, comprising matrix glasses enriched in incompatible elements (e.g. SiO2 and K2O) indicative of a more evolved melt composition. Importantly, for the purposes of stratigraphic correlation, L6-B can be distinguished entirely from other samples by FeO and TiO2, which likely reflects the appearance of magnetite in the crystallising assemblage (not observed in other samples).
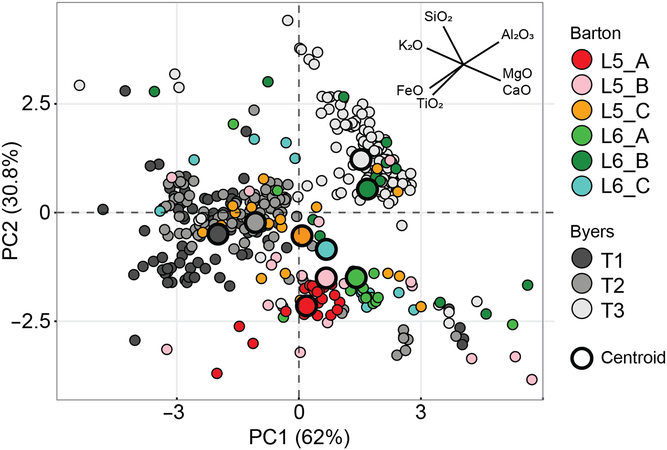
Multivariate PCA analysis demonstrates that 93% of the total variance (including published data from Byers Peninsula, see section “Discussion”) within the data set can be accounted for by the first two principal components (PC1 and PC2; Fig. 6). PCA loadings are detailed in Supplementary Table B. Although PC1 contains relatively even contributions from all oxides, it is dominated by K2O (negative) and CaO, MgO (positive). PC2 is dominated by FeO, TiO2 (negative) and SiO2 (positive). When all tephra samples are plotted as a function of the first two principal components, L6-B is distinct from other Barton tephras in the PC2 direction, with L6-B glasses statistically lower in FeO and TiO2, and higher in SiO2. PCA statistics are, therefore, in good agreement with the qualitative observations described above.

Fig. 6. Principal component analysis (PCA) visualisation of the first two principal components (PC; 93% of the variance) of standardised matrix glass compositions from Barton L5 and L6 tephras (this study) and Byers Peninsula T1–3 tephras (Liu et al., Reference Liu, Oliva, Antoniades, Giralt, Granados, Pla-Rabes and Geyer2016). PCA scores of each oxide (magnitude and direction) are shown in the upper right. Bold large circles show the centroid for each sample.
Discussion
Deglaciation timescale
Most of the glaciers on the Antarctic Peninsula have retreated significantly during the last century (Davies, Carrivick, Glasser, Hambrey, & Smellie, Reference Davies, Carrivick, Glasser, Hambrey and Smellie2012; Seehaus, Cook, Silva, & Braun, Reference Seehaus, Cook, Silva and Braun2018). King George Island, and, consequently, Barton Peninsula, is no exception with the total glaciated area having declined during the last several decades (Simoes, Rosa, Czapela, Vieira, & Simoes, Reference Simoes, Rosa, Czapela, Vieira and Simoes2015). This pattern must be framed within the long-term pattern of glacial retreat in the Antarctic Peninsula Region detected since the mid-20th century in response to one of the fastest rates of warming recorded on Earth, with temperature increases of ca. 0.5 °C/decade (Turner et al., Reference Turner, Colwell, Marshall, Lachlan-Cope, Carleton, Jones and Iagovkina2005). However, there is evidence that glacier retreat may have decelerated during recent years in the SSI (Navarro, Jonsell, Corcuera, & Martín-Español, Reference Navarro, Jonsell, Corcuera and Martín-Español2013; Oliva et al., Reference Oliva, Navarro, Hrbáček, Hernández, Nývlt, Pereira and Trigo2017a).
During the Last Glacial, the SSI were covered by an extensive ice cap connected with the Antarctic Peninsula that began to shrink as temperatures started increasing at ca. 18 ky (Stenni et al., Reference Stenni, Buiron, Frezzoti, Albani, Barbante, Bard and Udisti2011), and by 15 ky the ice cap encircling these islands became isolated from the rest of the continent (Ingólfsson et al., Reference Ingólfsson, Hjort and Humlum2003; Hall, Reference Hall2009; Ó Cofaigh et al., Reference Ó Cofaigh, Davies, Livingstone, Smith, Johnson, Hocking and Simms2014). On King George Island, the Collins Glacier thinned gradually and the highest peaks protruded the ice as nunataks. Topographic maxima in the Barton Peninsula became ice-free between 11.9 and 15.5 ky, as inferred from surface exposure dating (Seong et al., Reference Seong, Owen, Lim, Yoon, Kim, Lee and Caffee2009). Glaciomarine sediments from Maxwell Bay and Marian Cove also confirm the deglaciation of the bay between 14 and 17 cal ky BP (Milliken et al., Reference Milliken, Anderson, Wellner, Bohaty and Manley2009; Simms et al., Reference Simms, Milliken, Anderson and Wellner2011; Yoon et al., Reference Yoon, Han, Park, Oh and Chang1997). This glacial thinning was accompanied by a gradual retreat inland of the ice caps during the early Holocene 10.1 and 8.2 cal ky BP (Bentley et al., Reference Bentley, Hodgson, Smith, O Cofaigh, Domack, Larter and Evans2009; Milliken et al., Reference Milliken, Anderson, Wellner, Bohaty and Manley2009; Shevenell, Ingalls, Domack, & Kelly, Reference Shevenell, Ingalls, Domack and Kelly2011), when the continent recorded the highest temperatures of the Holocene, reaching values ca. 6 °C higher than those recorded during the LGM (Mulvaney et al., Reference Mulvaney, Abram, Hindmarsh, Arrowsmith, Fleet, Triest and Foord2012).
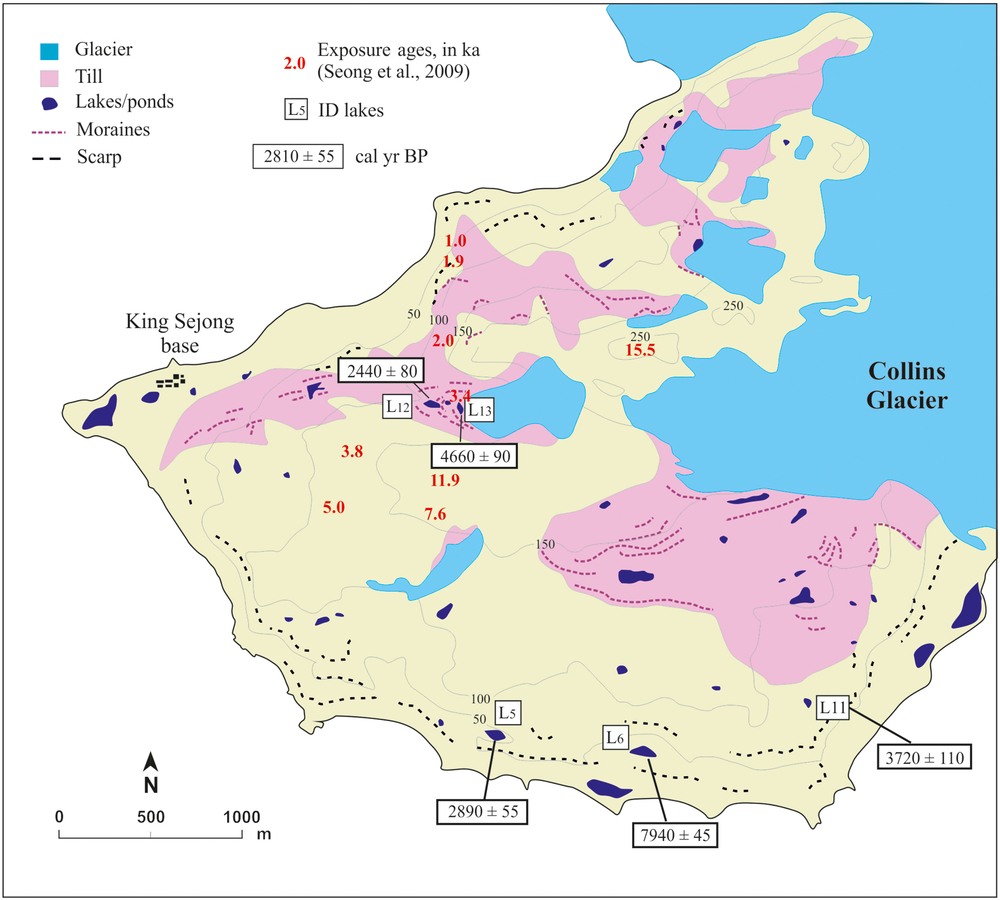
According to the lithological column of the studied lakes, there are no evidences of hiatuses or other sedimentological features between the oldest lacustrine sediments and the lake basement rocks, like incipient soils, that might indicate long-time exposure. Therefore, lakes started to be present at Barton Peninsula just after the glacier retreat began. The basal radiocarbon ages from Barton Peninsula lakes suggest that land surfaces began to deglaciate roughly by 8 cal ky BP and proceeded from the southeast to the north. Lakes L5 and L6 are located on a marine platform ca. 2 km from the current front of the Collins Glacier. These lakes are in similar topographic environments, filling depressions distributed above a cliff falling to a sequence of marine terraces. The lakes are separated by a distance of only 700 m, and yet the radiocarbon dates of the basal sediments in each lake indicate significant chronological differences: L5 showed an age of 2.9 cal ky BP, while L6 was formed at 7.9 cal ky BP. As we did not reach the oldest sediments in L5, which showed high compaction near the bottom of the core, disabling the penetration of the corer, the L5 radiocarbon age cannot be used as a marker for the deglaciation chronology of this site. The significantly older age in lake L6 is similar to coastal lakes cored from nearby Fildes Peninsula on King George Island (Watcham et al., Reference Watcham, Bentley, Hodgson, Roberts, Fretwell, Lloyd and Moreton2011) or in other lake records of the SSI, such as in Byers Peninsula from Livingston Island (Oliva et al., Reference Oliva, Antoniades, Giralt, Granados, Pla-Rabes, Toro and Vieira2016; Toro et al., Reference Toro, Granados, Pla, Giralt, Antoniades, Galán and Appleby2013). The basal 14C date of lake L6 suggests that the southern area was the first coastal environment of Barton Peninsula to become ice-free. Along the northern coast of the peninsula, the existence of several exposure ages between 1 and 2 ky suggests that this area was only deglaciated during the late Holocene (Fig. 7; Seong et al., Reference Seong, Owen, Lim, Yoon, Kim, Lee and Caffee2009). The northwards retreat of the Collins Glacier during the early Holocene was accompanied by a shrinking of the ice cap, shown by the cosmogenic age of 7.6 ky that suggests the deglaciation of the high central plateau of Barton Peninsula during this time (Seong et al., Reference Seong, Owen, Lim, Yoon, Kim, Lee and Caffee2009).

Fig. 7. Geomorphological sketch of Barton Peninsula and distribution of the basal 14C dates presented in this paper as well as the cosmogenic 36Cl exposure dates (in red) reported by Seong et al. (Reference Seong, Owen, Lim, Yoon, Kim, Lee and Caffee2009).
The relative homogeneity of cosmogenic ages below 150 m asl around the central plateau (ranging between 3.8 and 7.6 ky; Seong et al., Reference Seong, Owen, Lim, Yoon, Kim, Lee and Caffee2009) suggests that the Collins Glacier was generally stable during the mid-Holocene, without major advances or retreats in Barton Peninsula. On Byers Peninsula, a period with relative glacial stability or with minor glacier advances and retreats was also recorded after 7.5 cal ky BP (Oliva et al., Reference Oliva, Antoniades, Giralt, Granados, Pla-Rabes, Toro and Vieira2016). This glacial stability is also supported by the presence of lake L11. The basal sediments of this lake reported an age of 3.7 cal ky BP, which is indicative of a minimum age for the formation of the moraine system located next to it. The similarity of this date with that obtained by cosmogenic dating of polished bedrock (3.8 ky) strongly supports a period of glacial retreat starting at this time. The mid–late Holocene deglaciation also led to the appearance of new land surfaces in the SSI resulting both from glacial retreat and the emergence of former marine terraces due to glacio-isostatic uplift. The reduction in glaciated area in the SSI caused an uplift of ca. 14 m in Barton Peninsula (Fretwell et al., Reference Fretwell, Hodgson, Watcham, Bentley and Roberts2010), which implies that the lowlands and coastal lagoons of this peninsula only appeared over the last few millennia.
The other two lakes (i.e. L12 and L13) are located in a glacial valley that still contains a small cirque glacier in the upper part of the catchment. The modern glacier front is situated at 110 m asl, where it forms a small moraine ridge. The retreat of the glacier has formed several moraines, some of which are dam, lakes and ponds, such as L12 and L13. Lake L12 is located in a small glacial depression at 102 m asl, enclosed by the most distal moraine, and L13 shows the same geomorphological pattern at a slightly higher elevation, at 110 m asl. However, the basal sediments in both lakes show inverted ages relative to those expected: while L13, in contact with the glacier front, reported an age of 4.7 cal ky BP, the oldest sediments in L12 yielded 2.4 cal ky BP. One possible explanation is that due to its proximity to the glacier front, lake L13 continues to be contaminated with old carbon released from the glacier. The radiocarbon age may thus not reflect the true age of deglaciation at this site. Many Antarctic lacustrine records report radiocarbon ages that may have been influenced by old carbon stored in several sources, such as permafrost, glacial ice or ornithogenic soils (Hendy & Hall, Reference Hendy and Hall2006; Vonk et al., Reference Vonk, Tank, Bowden, Laurion, Vincent, Alekseychik and Wickland2015). The contamination of samples with radiocarbon-depleted material (both for bulk sediment and organic fragments) is an under-investigated problem in paleoenvironmental studies from polar regions that can lead to large uncertainties on ages, and at worse, highly erroneous results (Antoniades et al., Reference Antoniades, Giralt, Geyer, Álvarez-Valero, Pla-Rabes, Granados and Oliva2018; Píšková et al., Reference Píšková, Roman, Bulínová, Pokorný, Sanderson, Cresswell and Kopalová2019). This is a widespread problem in permafrost regions due to the good preservation of organic materials (Schuur et al., Reference Schuur, Vogel, Crummer, Lee, Sickman and Osterkamp2009) as well as in glacier forelands with old ancient carbon being released by the melting glacier (Hågvar & Ohlson, Reference Hågvar and Ohlson2013, Hood, Battin, Fellman, O’Neel, & Spencer, Reference Hood, Battin, Fellman, O’Neel and Spencer2015). Alternately, L12 simply may not have formed until a later stage of landscape evolution or we may have not reached the base of the sedimentary sequence. Assuming a minimum age of 2.4 cal ky BP for the base of L12 and considering that the present-day glacier front is located only 150 m from this lake (Fig. 8), our results suggest that the glacier has not experienced substantial advances during the late Holocene, with only a minor glacial advance or a phase of stabilisation for the last 2.4 cal ky BP that formed the moraine enclosing the lake L13. This glacier stabilisation during the late Holocene has also been reported for other ice-free environments in the SSI, such as Byers Peninsula (Oliva et al., Reference Oliva, Antoniades, Giralt, Granados, Pla-Rabes, Toro and Vieira2016).
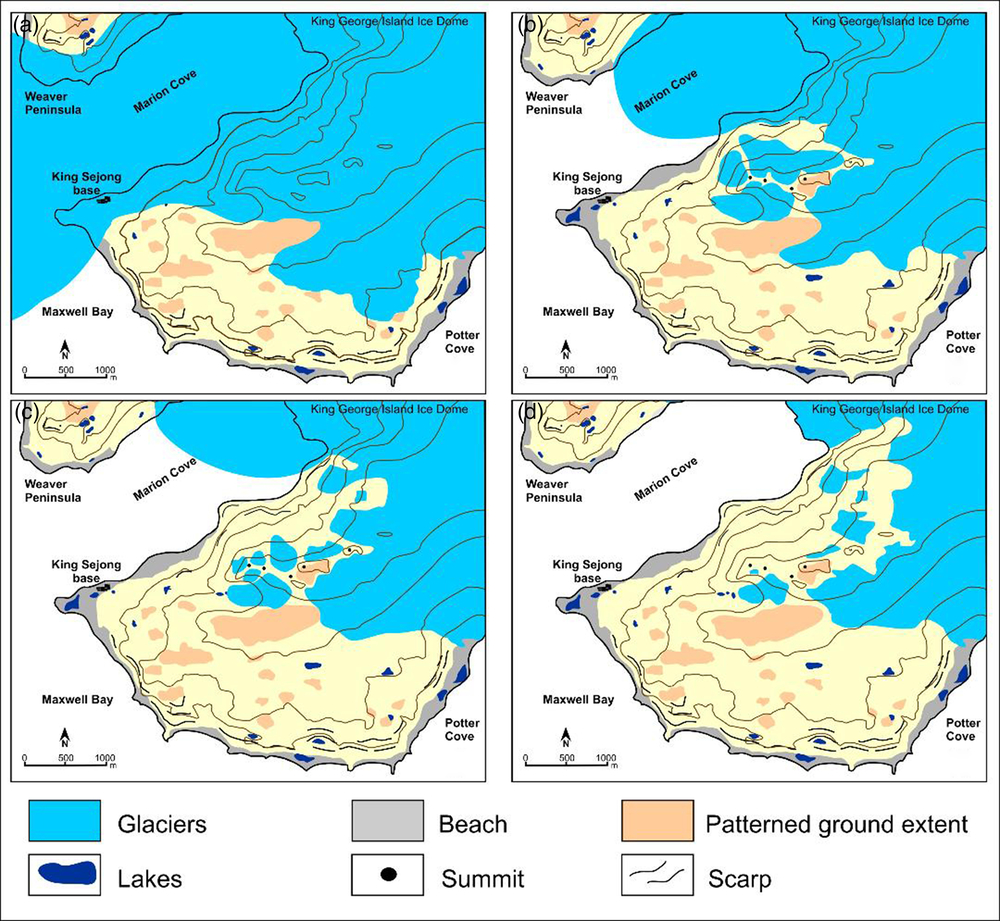
Fig. 8. Glacial evolution in Barton Peninsula after the deglaciation of Maxwell Bay with the development of the (a) Outer moraine complex, (b) Intermediate moraine complex, (c) Inner moraine complex and (d) Present-day glacier extent.
Tephra layers chronological markers
Matrix glass compositions from all sampled tephra layers plot within the compositional field of Deception Island volcano (located 125 km SE of Barton Peninsula) and distinct from those of other local volcanic centres (Fig. 9). Deception Island is, therefore, the most likely source of the volcanic material. Deception Island is a composite stratovolcano comprising a mostly submerged caldera ca. 10 km in diameter, and during its history has erupted a broad spectrum of magma compositions from basalt to dacite (Smellie, Reference Smellie2001; Martí, Geyer, & Aguirre-Díaz, Reference Martí, Geyer and Aguirre-Díaz2013). This volcano has been the primary source of Holocene tephra deposits to the SSI throughout the Holocene (Kraus, Kurbatov, & Yates, Reference Kraus, Kurbatov and Yates2013), with tephra layers geochemically consistent with Deception Island documented in lacustrine sediments from Byers Peninsula (Antoniades et al., Reference Antoniades, Giralt, Geyer, Álvarez-Valero, Pla-Rabes, Granados and Oliva2018; Björck, Sandgren, & Zale, Reference Björck, Sandgren and Zale1991; Hodgson, Dyson, Jones, & Smellie, Reference Hodgson, Dyson, Jones and Smellie1998; Liu et al., Reference Liu, Oliva, Antoniades, Giralt, Granados, Pla-Rabes and Geyer2016; Toro et al., Reference Toro, Granados, Pla, Giralt, Antoniades, Galán and Appleby2013) and King George Island (Lee, Lim, Yoon, & Tatur, Reference Lee, Lim, Yoon and Tatur2007; Roberts et al., Reference Roberts, Monien, Foster, Loftfield, Hocking, Schnetger and Hodgson2017), and marine sediments from the Scotia Sea (Moreton & Smellie, Reference Moreton and Smellie1998) and Bransfield basins (Fretzdorff & Smellie, Reference Fretzdorff and Smellie2002).
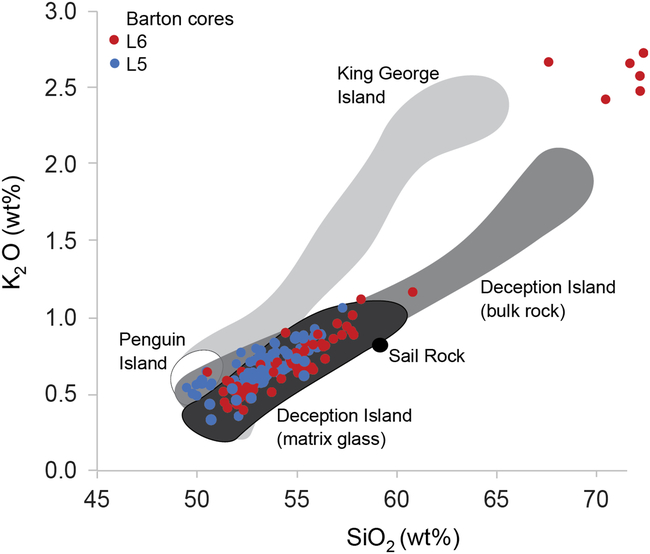
Fig. 9. Volcanic source of the Barton tephra deposits. Comparison of glass compositions of sampled tephras (symbols) to bulk rock compositional fields of nearby volcanic centres (redrawn from Fretzdorff & Smellie, Reference Fretzdorff and Smellie2002; Liu et al., Reference Liu, Oliva, Antoniades, Giralt, Granados, Pla-Rabes and Geyer2016), including Penguin Island (white), King George Island (pale grey), Deception Island (grey; glass compositions in dark grey) and Sail Rock (black).
In Byers Peninsula (Livingston Island, SSI), three major tephra horizons – T1 (1890 ± 140 cal yr BP), T2 (2370 ± 100 cal yr BP) and T3 (3980 ± 125 cal yr BP) – were correlated between three lakes based on their geochemical and textural properties, and their ages were constrained using AMS radiocarbon dates (Antoniades et al., Reference Antoniades, Giralt, Geyer, Álvarez-Valero, Pla-Rabes, Granados and Oliva2018; Liu et al., Reference Liu, Oliva, Antoniades, Giralt, Granados, Pla-Rabes and Geyer2016; Toro et al., Reference Toro, Granados, Pla, Giralt, Antoniades, Galán and Appleby2013). The T3 tephra deposit is geochemically distinct, with glass compositions more depleted in compatible elements indicative of mafic mineral fractionation (e.g. Fe, Mg and Ti). In the longest Byers Peninsula core (Escondido Lake), two additional tephra layers older than the T3 isochron were found to be geochemically similar to the younger T1 and T2 compositions, thereby constraining T3 as a geochemically distinct marker horizon (Liu et al., Reference Liu, Oliva, Antoniades, Giralt, Granados, Pla-Rabes and Geyer2016). Geochemical two-component plots and multivariate PCA show that while tephra layers L6-A, L6-C, L5-A, L5-B and L5-C are most closely related to the T1 and T2 compositions (particularly in PC2), tephra L6-B is statistically similar to the T3 tephra in both PC1 and PC2 (Figs. 5 and 6). The centroids for L6-B and T3 plot closely in the same quadrant, indicating that the two sample populations share overlapping characteristics in multiple variables (oxides).
Tephra layers in other lake sedimentary sequences from King George Island (Fildes Peninsula; Fig. 1) provide additional temporal constraints. The oldest tephras – referred to as D and E in Lee et al. (Reference Lee, Lim, Yoon and Tatur2007) – are older than ca. 5 cal ky BP and exhibit characteristic bimodal compositions; they may, therefore, be correlative of the oldest Barton tephra layer L6-A. A major primary tephra deposit in the Fildes Peninsula sedimentary sequences is overlain by massive gravity-flow deposits similar to those documented in association with the T3 tephra (Antoniades et al., Reference Antoniades, Giralt, Geyer, Álvarez-Valero, Pla-Rabes, Granados and Oliva2018), and its base is dated at 4.9 cal ky BP (Lee et al., Reference Lee, Lim, Yoon and Tatur2007). This tephra deposit is geochemically and sedimentologically similar to L6-B and T3, and therefore supports the relative chronology despite the discrepancy in absolute age. As discussed above, this may be related to the presence of old organic carbon stored in lake sediments from a catchment affected by changing permafrost conditions during the Holocene.
The presence of the T3 tephra deposit in lake L6 but not in L5 would imply that the base of L5 is not older than the well-constrained age of 3980 ± 125 cal yr BP of T3 in the SSI and neighbouring areas (Antoniades et al., Reference Antoniades, Giralt, Geyer, Álvarez-Valero, Pla-Rabes, Granados and Oliva2018), which is consistent with the younger basal radiocarbon date for L5 of 2.9 cal ky BP (compared to 7.9 cal ky BP for L6). The inferred ages of the Barton Peninsula tephras, based on geochemical comparison to other dated tephra sequences, support the chronological framework from independent radiocarbon dates presented in this study.
Conclusions
Lake sediment records from Barton Peninsula provide information of the environmental evolution in King George Island during the Holocene. The basal radiocarbon dates of sedimentary sequences from five lakes of the western part of Barton Peninsula offer a more accurate chronology on the Holocene deglaciation of this ice-free area, although surface exposure dating suggests that glacial retreat in Barton Peninsula started several millennia ago.
During the Last Glacial, the SSI were covered by an ice sheet connected with the Antarctic Peninsula Region, which started thinning between 15 and 20 ky and became isolated encircling the SSI. The thinning of the Collins Glacier accompanied marginal retreat, which exposed the lowest coastal environments along the southern fringe of the peninsula at ca. 8 cal ky BP. The ice cap was relatively stable during the late Holocene, but retreated northwards after 3.7 cal ky BP. This glacial shrinking confined some glaciers within valleys, where they are still present. This is the case for a small glacial valley on Barton Peninsula where lake sediments reveal glacial stability during the late Holocene, with no major advances, during, at least, the last 2.4 cal ky BP. The presence of small moraines ridges indicates two minor glacial advances and/or phases of glacier stabilisation during these millennia.
Deception Island volcano has been identified as the dominant source for the volcanic event horizons recorded in the sediments of Barton Peninsula. Visible tephra layers within two lake sequences record persistent eruptive activity during the Holocene. Although matrix glass compositions are relatively homogeneous through time, a key marker horizon (L6-B) has been identified based on geochemically properties to a large eruption (T3) documented in lacustrine and marine sediment records throughout the northern AP region (Antoniades et al., Reference Antoniades, Giralt, Geyer, Álvarez-Valero, Pla-Rabes, Granados and Oliva2018). The independent age constraints provided by the stratigraphic position of this major eruption are consistent with the sequence of events inferred from basal lake sediments of Barton Peninsula. Together, these multiple lines of evidence provide compelling support for the chronological deglaciation framework presented in this study.
Supplementary material
To view supplementary material for this article, please visit https://doi.org/10.1017/S0032247419000469.
Acknowledgements
The authors are grateful to the Portuguese Polar Program (PROPOLAR), the Korea Polar Research Institute (KOPRI) and the Chilean Antarctic Institute (INACH) for providing logistic support for the fieldwork. Marc Oliva is supported by the Ramón y Cajal Program (RYC-2015-17597) and the Research Group ANTALP (Antarctic, Arctic, Alpine Environments; 2017-SGR-1102) funded by the Government of Catalonia through the AGAUR agency. The work complements the research topics examined in the PALEOGREEN (CTM2017-87976-P) and CRONOANTAR (CTM2016-77878-P) projects of the Ministry of Economy, Industry and Competitiveness, Spain, and the projects Analysis of nunataks of the Antarctic Peninsula as multiproxy data sources on environmental change and climate dynamics – NUNANTAR (02/SAICT/2017 – 32002) and Holocene environments in Barton Peninsula (South Shetland Islands, Antarctica) funded by the Fundação para a Ciência e a Tecnologia, Portugal. We also thank João Agrela for the support during fieldwork.