Introduction
The cryosphere, that is those regions of the Earth dominated by the presence of frozen water, represents a unique environment, providing a vast habitat for a variety of life. For example, ice sheets and glacial ice have been found to contain viable bacteria even at great depth in the ice (Priscu and others 2007). One major component of the cryosphere, sea ice, is home to a variety of microscopic organisms, for example bacteria, algae, other protists, and their viruses, as well as providing refuge and feeding platforms for a range of larger animals. Sea ice itself is an environment of variable extent depending on the season. Recent estimates of the extent of sea ice coverage are available from the Arctic Regional Ocean Observing System (ArcticROOS) and it has been estimated that, for the northern hemisphere, its extent varies between 3 × 10⁶ and 14 × 106 km2 (Sandven Reference Sandven2012). For the Antarctic region, the National Snow and Ice Data Center estimates a range of sea-ice extent of 7–15 × 106 km2 (NDIC 2012). Thus, sea ice can occur over roughly 5–6% of the global surface area.
Recent warming in polar regions has led to changes in both the extent and duration of sea-ice coverage. For example, in the northern hemisphere during the summer of 2012, Arctic sea ice declined to a record minimum, leading to large releases of biomass from the melted ice as well as changes in primary productivity of the region (Boetius and others 2013; Parmentier and others 2013). This warming has resulted not only in the extent and duration of seasonal sea ice, but also in large losses of multi-year ice in the Arctic. In the Antarctic, the situation is more complicated. Assessing the temperature changes there over the past 50 years, Steig and others have noted a warming trend in the western Antarctic, most notably along the Antarctic peninsula, offset in part by a slight cooling in eastern Antarctica, although overall the temperature trend is positive (Steig and others 2009). These temperature trends have led to losses of sea-ice extent and duration particularly along the Antarctic peninsula.
These changes are important, since sea ice provides a habitat for algae trapped within the ice, as well as algae living along the bottom of it (Guglielmo and others 2004). When the ice melts during spring and summer, in addition to the release of trapped biomass, large quantities of biogenic sulphur can be released to the surface waters and, ultimately, the atmosphere (Trevena and others 2000; Trevena and Jones Reference Trevena and Jones2006). These chemicals are transformed into greenhouse gases, for example dimethyl sulphide [DMS] and ultimately methane sulphonic acid and sulphate, all of which are critical components of the global sulphur cycle. It has been postulated that the overall impact of biogenic sulphur on the climate may be to act as a negative feedback mechanism to the effects of global warming (the so-called CLAW hypothesis, an acronym derived from the last initials of its proposers, R. J. Charlson, J. E. Lovelock, M. O. Andreae, M. O. and S. G. Warren (Charlson and others 1987)). The CLAW hypothesis has engendered some controversy over the last quarter century and, most recently, the lack of experimental evidence supporting it has been noted (Quinn and Bates Reference Quinn and Bates2011). The concentrating effects of sea ice on biogenic sulphur can be quite large. For example, typical surface water concentrations of dimethylsulphoniopropionate [DMSP] are on the order of nM. However, Trevena and Jones found average DMSP concentrations in the range of 0.2–0.8 μM for young ice and 0.05–0.8 μM for first-year ice, that is an increase of several orders of magnitude (Trevena and Jones Reference Trevena and Jones2006).
In spite of the extent and importance of sea ice as a habitat for algae and bacteria, detailed chemical information of this system on a scale of relevance (micrometers) to trapped organisms is relatively sparse. Sea ice itself is a complex mixture of gas bubbles, brine pockets and a connected vein structure. Eicken and others have provided an overview of sea ice from a biological perspective (Eicken and others 1992), as well as its more structural and chemical aspects (Petrich and Eicken Reference Petrich, Eicken, Thomas and Dieckmann2010). Recently, Jones and others have modeled the temporal and thermal evolution of first-year sea ice, benchmarking their modeling by comparison to electrical resistivity data (Jones and others 2012). From a chemical perspective, most of the available data are based on either analysis from bulk melting or sampling of sea-ice brines. For example, for first year ice, bulk melting studies reveal a characteristic ‘C’ shaped salinity profile, with maxima at or near the top and bottom of the ice (Petrich and Eicken Reference Petrich, Eicken, Thomas and Dieckmann2010). Brine chemistry concentrations have been measured by collecting brine from sea ice boreholes. For first year sea ice in the Weddell Sea, Gleitz and others measured the chemistry of both early and late season ice (Gleitz and others 1995). They found pH values ranging between 8 and 10, and reported rather high salinity values particularly for summer sea-ice brines that exceed seawater values by as much as a factor of 3. Nutrients such as silicate, phosphate, nitrate and carbonate were also measured and the concentration correlated with the presence of biological activity. For the most part, however, the measured concentrations were within an order of magnitude of their corresponding value in seawater. Moreover, no calcium carbonate precipitation was observed for brines with salinities ranging from 34 to 108. Transport of such brines through physical processes such as gravity drainage has been used to define the chemical source term in biogeochemical models of the sea-ice/surface ocean system; see for example, the work of Jeffery and others (Jeffery and others 2011, 2012).
In order to understand (and model) more completely the processes occurring within sea ice, a more sophisticated picture of the chemical processes taking place within the ice is needed, particularly in those interior regions which are only poorly coupled to the atmosphere and surface ocean and for which bulk brine concentration is an incomplete measure. For example, in recent studies on laboratory ice as well as meteoric (glacial) ice, we have shown that ice-vein chemistry is largely controlled by chemical equilibria (phase relationships) and vein size (temperature) (Barletta and Roe Reference Barletta and Roe2012; Barletta and others 2012). High spatial resolution is required for such an analysis. Traditional methodology for ice analysis, that is core sectioning followed by melting and trace chemical analysis, such as that performed on Arctic sea ice (Nedashkovskii and others 2008), will mask spatial variability on the order pertinent to the chemistry within individual ice veins, as well as the micrometer scale environment for trapped algae and bacteria.
In this context, Raman microscopy is an invaluable tool to probe sea-ice chemistry at the micrometer level. Previously, we have applied this technique to the analysis of both laboratory-prepared samples and glacial ice. While the technique is limited to the analysis of molecular ions and neutral molecules, it has the advantage of providing both qualitative and quantitative information, being relatively insensitive to the presence of water and the ability to discriminate between ionic solids with varying cations and dissolved species (Barletta and others 2009). In order to apply this technique to the analysis of sea ice, it is necessary to be able to discriminate between those species that are tracking with seawater and those that arise in the ice veins by some other process. In order to obtain a baseline for the analysis of first-year sea ice, we have prepared ice by rapidly cooling artificial seawater (‘splat cooling’) and analysed the vein chemistry of this system.
It would also be useful to be able to differentiate chemically the various aqueous regimes within the ice, that is, large brine channels open to ambient seawater, smaller brine ice tubes and brine pockets, and the porosity formed at the intersection of the ice crystals themselves. These various structures, which are dependent on ice-growth conditions, are described and illustrated by Petrich and Eicken (Reference Petrich, Eicken, Thomas and Dieckmann2010) and Jones and others (2012). When viewed in horizontal section, the small-scale porosity appears at the junction of three crystals, commonly referred to as triple junctions, where the porosity takes the form of an interconnected transverse ice vein structure. By optical microscopy, these ice veins or triple junctions appear regular in shape and are easily distinguished from the more irregular brine pockets and small brine tubes as shown by Jones and others (2012). In glacial ice, the ice-crystal edges, visible as lines connecting triple junctions in horizontal cross section, have been shown by Barletta and others to have a similar chemistry as the triple junctions in glacial ice (Barletta and others 2012). In contrast, in sea ice, these edges can form a network of brine inclusions (Petrich and Eicken Reference Petrich, Eicken, Thomas and Dieckmann2010).
Brine channels are wide (mm to cm diameter) and long (cm to dm) and can be open to the seawater allowing fluid exchange. They drain rapidly from a sea ice core once it is removed. As the sea ice gets thicker and colder, however, the smaller diameter (sub-mm) ice-vein and brine tube porosity can become disconnected in the upper (colder) parts of the ice. Yet, these smaller diameter networks can contain the bulk of the pre-melt brine in sea ice. Based on their review of the literature, Jones and others (2012) have concluded that those networks contain some 90% of the total brine volume. Given this fact, and because the processes leading to the formation of sea ice are quite different from that of laboratory-prepared splat-cooled ice or glacial ice, we have chosen in this study to concentrate on the chemistry of triple junctions representing brine veins rather than brine channels or tubes, although, in principle, the techniques described herein are equally applicable to these other features. Thus, the analytical methodology used in this study allows for an analysis of a liquid domain within sea ice that was previously inaccessible.
As a start towards the characterization of sea ice, first year (late season) sea ice obtained from the vicinity of Palmer Station, Antarctica was sampled and analysed along with laboratory-prepared samples using Raman microscopy. On 11–12 August 2011, two samples of sea ice (PS-1 and PS-2) were taken in the vicinity of Hero Inlet and Arthur Harbor by the R/V Lawrence M. Gould. The samples were free-floating ice and collected from a Zodiac rather than cored. One of these samples (PS-1) was sectioned and analysed at discrete depth intervals by both bulk chemical analysis on melted samples (salinity, sulphate, ammonium, nitrate, phosphate and dissolved inorganic carbon (DIC) as a measure of carbonate) and Raman microscopy on unmelted ice. To allow comparison of the Raman analytical results with concentrations derived from bulk surface water, Raman microscopy was also performed on laboratory ice prepared by splat-cooling artificial sea water in a manner previously reported (Barletta and Roe Reference Barletta and Roe2012). The process of splat-cooling involves cooling a surface to –80°C. A small amount of solution is dropped upon this surface from a height sufficient to allow the solution to flatten and quickly freeze. This rapid quenching produces micro-crystals of pure water ice with salts excluded to the grain boundaries. Annealing the samples at a higher temperature allows grain growth to occur until a desired ice crystal size is obtained. While measurements on splat-cooled samples do not exactly mimic the process of forming sea ice, they provide a baseline of what to expect in terms of vein concentration if all of the soluble components are derived from a solution of concentration similar to ambient surface water.
Experimental methods
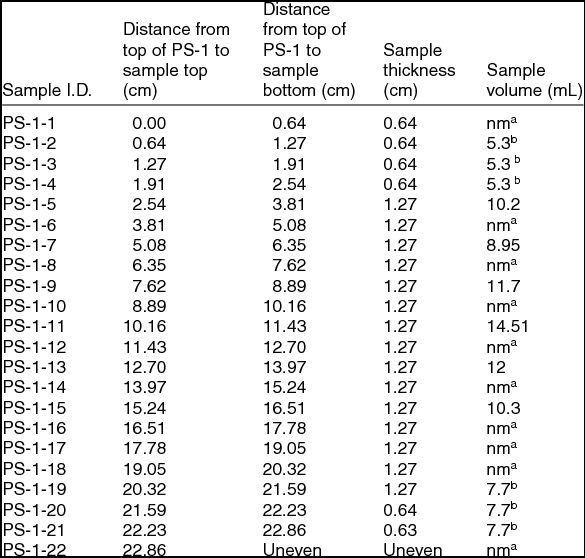
Of the two sea-ice samples obtained, the thinner (denoted PS-2) was stored at –20°C for archival purposes. The thicker (denoted PS-1) was used in this study. This sample had an overall thickness of roughly 23 cm with a tapering rectangular cross section of maximum cross section measurement of 11 × 7 cm. It had been stored at –20°C or colder since sampling. In order to minimise the possibility of external contamination, the sample was trimmed with a band saw to a roughly even cross section of 5 × 5 cm in a cold room kept at ~+4°C. It was then sliced into sections either 1.3 or 0.6 cm thickness, which were stored in a –20°C freezer until analysis. There was no evidence of significant release of brine during this process. Table 1 gives the complete sectioning plan for the PS-1 sample. Prior to either bulk analysis or Raman microscopy, the surface of a sample was scraped with a razor blade to remove any surface chemical contamination or hoar frost. The razor blade was cleaned with methanol and air-dried prior to use. A small piece of ice was cleaved for Raman microscopy. The overall size of this piece allowed it to fit within the 20 mm diameter window of the 35 mm culture dish used as a sample holder. Samples were annealed by being placed in a covered, glass-bottomed culture dish in an incubating freezer for a minimum of 12 hours at –9°C and analysed using an approach described by Barletta and others (Barletta and others 2012). The particular annealing temperature and time chosen were consistent with the previously referenced glacial ice analysis.
Table 1. Sectioning plan for sea-ice core obtained from the vicinity of Palmer Station, Antarctica, PS-1, used in this study. The sample thicknesses (cm) and volumes (mL) used for bulk characterization are also listed.

anm = not measured. bMerged into single sample for bulk analysis
For the splat-cooling experiments, artificial seawater was prepared after a procedure described by Kester and others (Kester and others 1967). In terms of molecular ions, this recipe produces a solution containing sulphate, carbonate and borate, with an overall salinity of 35.00. Trace anions such as phosphate and nitrate are absent. A bulk Raman measurement of this stock solution revealed only the sulphate anion in addition to the bands due to water. Using this stock solution, a sample of splat-cooled ice was prepared using the procedure previously described (Barletta and Roe Reference Barletta and Roe2012). Ice samples were splat-cooled by dropping seawater droplets from a distance of approximately 1.5 m onto either an aluminum plate or a 33 mm glass-bottom culture dish with an uncoated glass window 0.085–0.13 mm thick pre-cooled to –79°C by resting the aluminum block on dry ice. Samples prepared on the aluminium block were scraped off the block and placed in a pre-cooled culture dish. Once in the culture dish, samples were annealed for 12–48 hours at approximately –9°C to allow for grain growth.
All Raman microscopy was performed using an Ar-ion laser operating at 488 nm. Sea ice samples were measured at a nominal laser power of ~100 mW (60–70 mW at sample) with a total data collection time of 5 minutes with a nominal analysis temperature of –15°C. A 20X quartz microscope objective was used for all measurements. The numerical aperture of this objective was 0.4, giving a Rayleigh resolution of 740 nm. This resolution probably represents a lower bound on the spatial resolution of this system with the actual resolution probably being somewhat closer to 1 μm. The spectrometer calibration was checked at the start of each measurement session using mercury lines from a fluorescent fixture prior to examining the sample. The frequency correction factor determined from this external calibration standard was typically less than 4 cm−1 and usually closer to ± 2 cm−1. Raman spectra of splat-cooled artificial seawater were taken in a similar manner with the exception that the laser power was 66 ± 8 mW and a total data collection time of 10 seconds.
Qualitative assignment of species present in a Raman spectrum was made by comparison of the observed peaks in the Raman spectrum with published literature values for characteristic Raman emission peaks. Quantitative determination of species concentrations were made by fitting these characteristic bands with Gaussian peaks using Grams AI and taking the ratio of that peak height to the bending mode of water also similarly band fit. The sample concentration was determined by the use of a calibration curve of aqueous solutions. This procedure has been described in detail by Barletta and others (2009).
Bulk chemical analysis on sea ice was performed by first melting sea ice from an appropriate layer. Because a minimum of 8mL was required in order to conduct the number of analyses planned, for those layers with an insufficient volume of liquid equal volumes from the layer above and below the target depth layer were combined with the samples prior to analysis. The sample volumes used for chemical analysis are also listed in Table 1. Salinity was measured using a standard conductivity cell and the results corrected to 15°C. The nutrients ammonium and phosphate were determined by standard colorimetric methods using continuous flow analysis in a Skalar San+ auto-analyser. Nitrate concentration was determined from the difference between the (nitrite + nitrate) channel and the nitrite only channel. DIC was determined by adding hydrochloric acid to the sample to convert carbonates and bicarbonates to carbon dioxide, which was measured with a non-dispersive infrared gas analyser. The analytical uncertainty in nutrient analysis is ± 0.05 μM and for DIC is ± 0.2 ppm. Sulphate was measured using ion chromatography with an analytical uncertainty of ± 0.5 mM.
Results and discussion
Salinity and bulk chemical analysis of sea ice
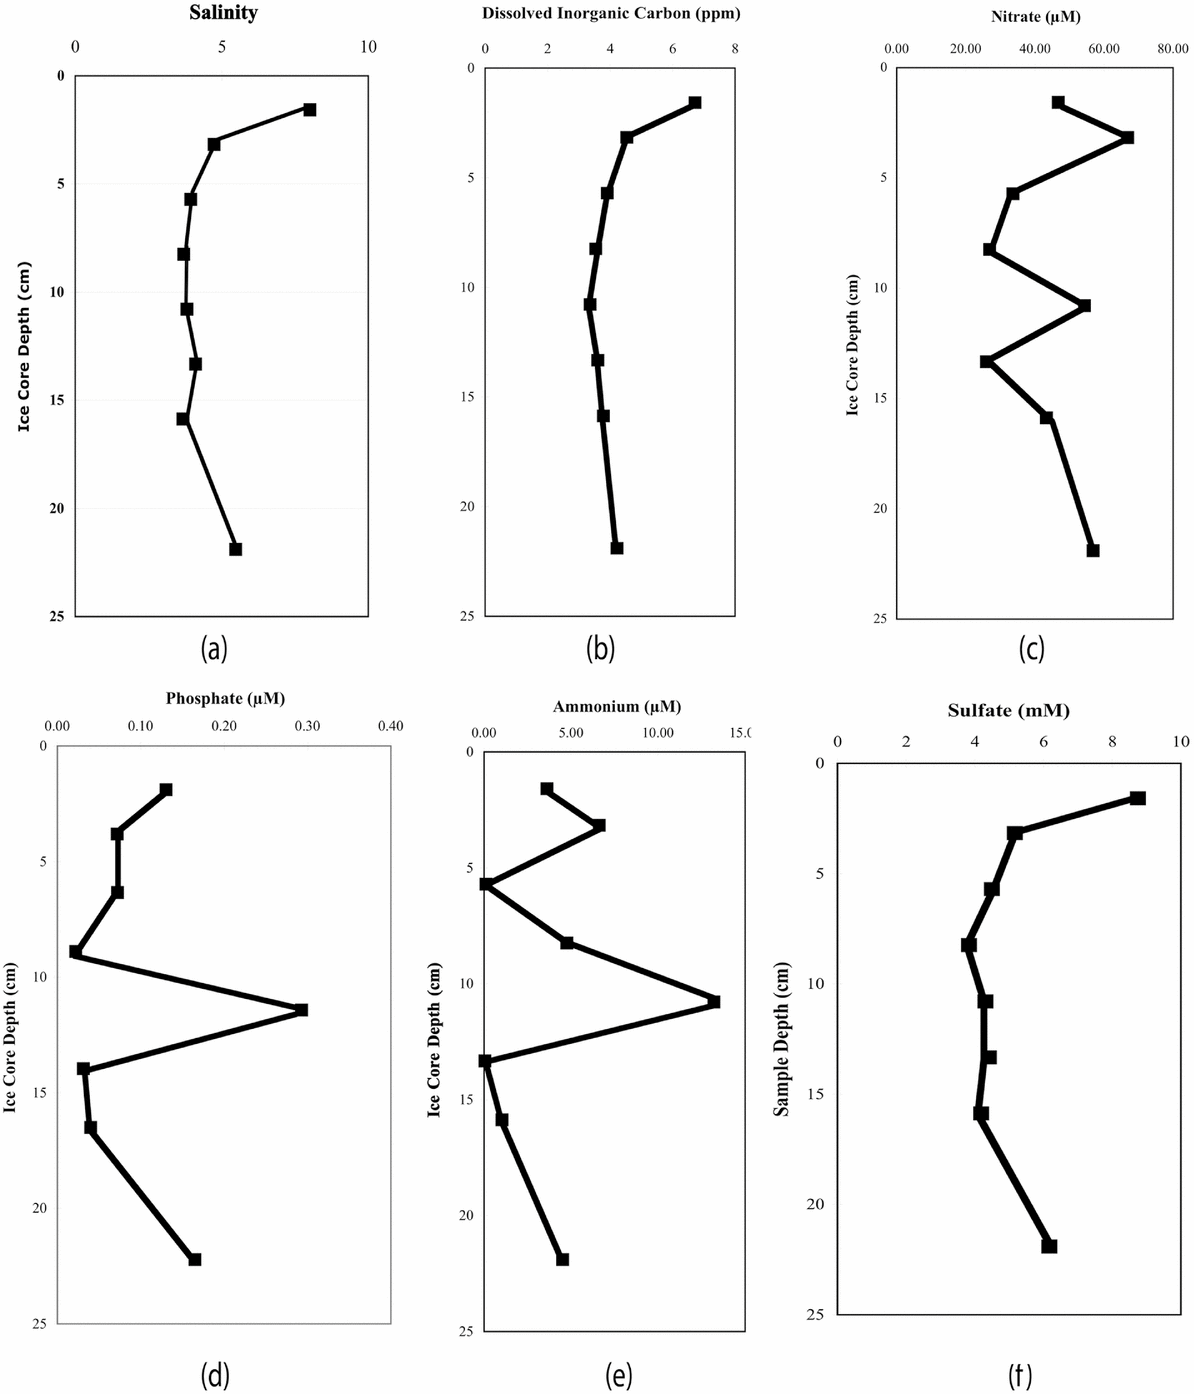
Fig. 1 provides the results of the salinity and bulk chemical analysis. The salinity profile clearly shows the ‘C’ profile typical of sea ice. Moreover, the bulk-measured salinities are within the range of 6–10 reported by Nedashkovskii and others (2008). With respect to chemical species, the measured bulk concentrations of phosphate are somewhat lower than the range reported by Nedashkovskii and others, who attribute the phosphate concentration profile to concentration of organic material in the surface microlayer, implying a phosphate source uncoupled from the bulk seawater concentration (Nedashkovskii and others 2008). Nomura and others have measured comparable values for phosphate, nitrate and ammonium in sea ice from the Sea of Okhotsk (Nomura and others 2010). They attribute the high nitrate and phosphate concentrations to atmospheric deposition of pollutants in snow, which would be an unlikely source of these anions in the PS-1 ice, but, as with the phosphate profile in sea ice, a source other than seawater may be inferred for these nutrients. While we observe a relative increase in nitrate concentration in the surface samples analysed, in general, a nutrient maximum appeared at the mid-sample level.

Fig. 1. Results of bulk chemical analysis of PS-1 samples: (a) salinity, (b) DIC concentration in ppm, (c) nitrate concentration in μM, (d) phosphate concentration in μM, (e) ammonium concentration in μM, and (f) sulphate concentration in mM.
Fransson and others (2011) have measured DIC and other nutrients in sea ice from the Ross and Amundsen seas. With respect to DIC, they found that it tracked roughly with depth profile for salinity for the eight cores analysed, with an average value of 273 ± 103 μmol kg−1 and a range of 83–769 μmol kg−1. In general, their depth profile gave low values at mid-core regions. Our observations (Fig. 1), agree qualitatively with these results, although our measured values are roughly a factor of 4 lower (70 ± 20 μmol kg−1). The measured DIC concentration profile showed the same overall shape as the salinity profile.
With respect to sulphate distribution, there are few data to serve as a basis for comparison. Andersen and Jones (1985) have measured the sulphate concentrations in both first and multi-year ice from the Fram Strait in the Arctic. They observed a high degree of variability in the relative sulphate enrichment, with a relative deviation in sulphate concentration of as much as 100%. They concluded there was a poor correlation between sulphate measured in sea ice and that produced in the laboratory. Although they did not report a characteristic ‘C’ depth profile in salinity for first-year cores, they did find higher salinities and sulphate concentrations at the top of the cores. The data obtained on bulk sulphate concentration for PS-1 mirror the results of from the Arctic (Anderson and Jones Reference Anderson and Jones1985). A visual comparison of the depth profiles for salinity and sulphate shown in Figure 1 reveals that two the profiles mirror one another. In particular, both salinity and sulphate concentration peaked in the upper portion of PS-1. In summary, salinities and bulk chemical analysis of DIC and sulphate agree quite well with each other and with the published depth profiles of both Arctic and Antarctic sea ice. For nitrate, ammonium and phosphate in addition to concentrating at the surface, large peaks in concentration were observed in the mid-sample region. These spikes could be indicative of processes other than simple gravity draining of brine within the core. However, the nature and extent of these processes cannot be elucidated from this limited data set.
Raman microscopy of splat cooled seawater
For splat-cooled artificial seawater a total of eight veins were analysed. In all of the samples analysed and, with the exception of peaks attributable to liquid water, only the peak attributable the sulphate anion at 980 cm−1 was observed. The mean vein concentration was 55 mM with a standard deviation of 5 mM. This value might be compared to an initial seawater concentration of 26 mM. The sample-to-sample variation was small, but still somewhat larger than the analytical uncertainty of ~2 mM.
It is noteworthy that the Raman spectra of the veins in splat-cooled artificial seawater contained features only attributable to sulphate even though anions such as carbonate and borate were included in the formulation. Phosphate and nitrate were not included in the formulation as they are typically present in trace concentrations in surface seawater. In previous splat-cooling studies (Barletta and Roe Reference Barletta and Roe2012), it was found that, regardless of ion, the concentration factors due to exclusion ions from water crystals were relatively constant to about an order of magnitude. Given the physico-chemical process controlling crystallisation, the same would hold true for seawater anions. The fact that neither carbonate nor borate was observed in the Raman spectra of splat-cooled artificial sea water bears this out, as even with concentration factors similar to sulphate anions, they would still be below their respective detection limits.
Raman microscopy of sea ice
Qualitatively the Raman spectra observed in PS-1 samples were relatively simple. In all the samples analysed, only three peaks were observed other than those that could be assigned to the vibrations of liquid water. These peaks occurred at 982 ± 2 cm−1, 990 ± 1 cm−1, and 1071 ± 1 cm−1. Based upon the good agreement between these peak positions and literature values for these anions as aqueous species, we have assigned these to the most intense vibrations of the following dissolved anionic species: sulphate (SO42−) at 980 cm−1 (Frezzotti and others 2012), dibasic phosphate (HPO42−) at 990 cm−1 (Syed and others 2012)), and carbonate (CO32−) at 1064 cm1 (Frezzotti and others 2012).
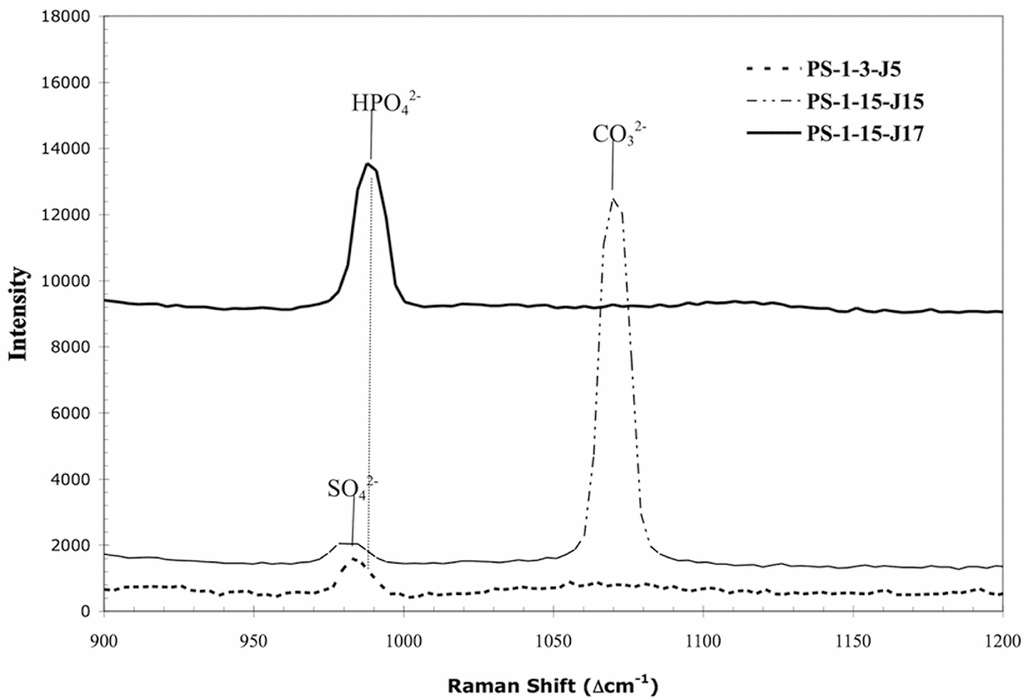
The fact that the observed Raman spectrum of a particular junction contains multiple peaks attributable to various anionic species is illustrated by the spectrum of PS-1-15-J15 in Fig. 2. This is further circumstantial evidence that these are aqueous rather than crystalline species. In this particular spectrum, two peaks are observed. One might be tempted to assign the peak at 1071 cm−1 to the carbonate stretching mode of ikaite (CaCO3·6H2O) rather than dissolved carbonate based on the proximity of this band to the reported carbonate vibration of this species of 1075 cm−1 (Geilfus and others 2013). However, the spectra of Geilfus and others of ikaite in sea ice do not show a band of appreciable intensity at either 980 cm−1 nor a relatively intense broad band at 1668 cm−1, the latter attributable to the bending mode of liquid water. Given the high spatial resolution (~1 μm) in our experiments, it is unlikely that the observed spectrum is due to a mixture of both aqueous and crystalline material.

Fig. 2. Raman spectra of three triple junctions from two depth layers (PS-1-3 and PS-1-15) of the PS-1 sea-ice sample. Spectra offset for clarity and intensity is in arbitrary units. Band assignments and peak maxima indicated above peak. The first portion of the sample id (PS-1-m) refers to the particular depth interval of the sample listed in Table 1, while the remaining portion (J#) refers to the particular triple junction measured in that interval.
Peaks associated with ammonium (NH4+), nitrate (NO3−), tribasic phosphate (PO43−), bisulphate (HSO4−), and bicarbonate (HCO3−) were not observed. The absence of peaks associated with the first two species is readily explained by the low concentration of these chemicals in seawater. Based on the observed sulphate concentrations (sea below), it may be inferred that, in the absence of other sources for ammonium and nitrate, their concentrations should be within 150% of nominal sea water concentrations, which are in the range of a few μM for ammonium and 10's μM for nitrate (see, for example, Olson Reference Olson1980). These concentrations are well below the detection limit using dispersive non-resonance Raman spectroscopy. (For resonance Raman spectroscopy, in which Raman cross sections increase by 3 to 6 orders of magnitude over conventional dispersive Raman, a detection limit for nitrate, the stronger of the two Raman scatterers, was found to be ~14 μM using UV excitation (Ianoul and others 2002).) For phosphate, bisulphate, and bicarbonate, the pH/ionic strength-controlled equilibria as well as Raman sensitivity probably explain the absence of peaks attributable to these species.
Even for those molecular species observed, not all of these peaks were present in each vein analysed as illustrated in Fig. 2. This variability was true for both depth within the PS-1 sample and at the same depth interval. Fig. 2 shows the Raman spectra obtained for triple junctions at two different depth intervals and two different triple junctions at the same depth interval. The sample numbering scheme indicates the location (depth interval) in the PS-1 sample and the particular junction. The first portion of sample identification number (PS-1-m) refers to the particular depth interval for the sample listed in Table 1, while the remaining portion (J#) refers to the particular triple junction measured. Fig. 2 illustrates that the particular species observed as well as its concentration (see below) was highly specific to location.
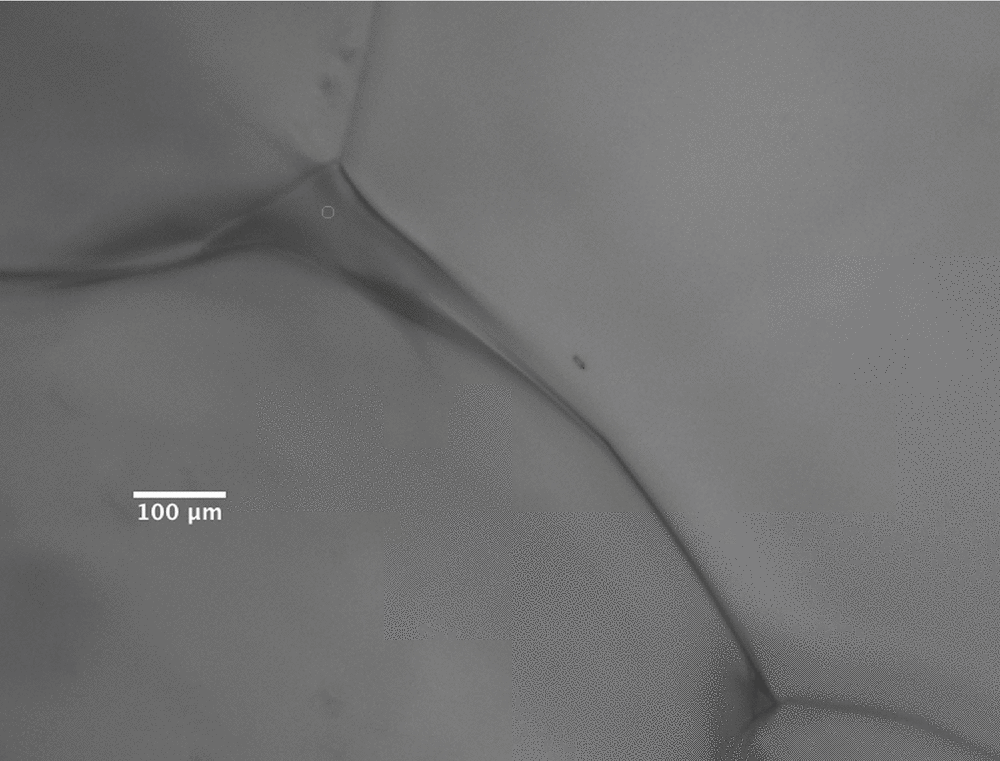
Fig. 2 also shows the small, but real, difference in the position of peak maxima between sulphate and dibasic phosphate. The variability in peak presence and intensity enabled us to eliminate the possibility of peaks being attributed to precipitated salts of these species due to the absence of corresponding dissolved species at saturation intensity levels. For example, the sulphate peak in PS-1-15-J15 was absent in PS-1-15-J7 (Fig. 2). Had the peak assigned to dibasic phosphate been attributable to micro-crystals of a sulphate salt in the junction, one would have expected to observe a peak at 982 cm−1 in that spectrum also attributable to dissolved sulphate. That none is observed, even as a shoulder, is indirect evidence supporting the assignment proposed. Indeed, the lack of precipitated solids is readily apparent from micrographs taken of the veins analysed. Fig. 3 shows a triple junction from PS-1-13, Raman spectrum of which contains peaks attributed to both sulphate and dibasic phosphate; no optical evidence of crystallisation can be seen in this figure. Lastly, from a qualitative standpoint, no peaks attributed to a molecular species other than ice could be found in Raman spectra taken within the ice crystals as opposed to the brine veins in the samples.

Fig. 3. Post-irradiation micrograph of PS-1-13-J15. Open circle in top triple junction indicates region of Raman measurement. Note that two triple junctions are evident in this micrograph.
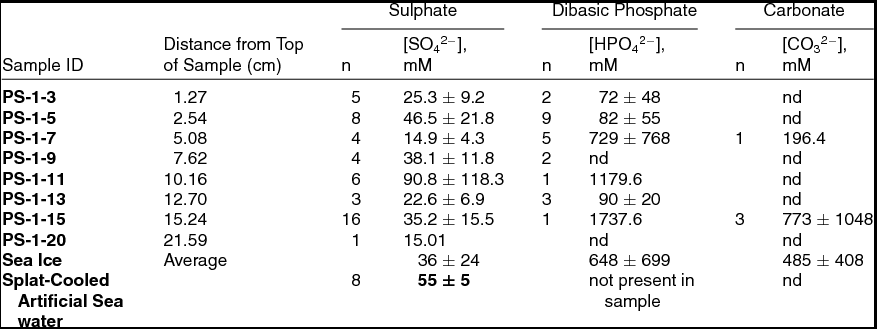
In addition to qualitative characterization, it is possible to obtain a quantitative measure of the species observed in the Raman spectrum (Barletta and Roe Reference Barletta and Roe2012). Peak intensities for bands of interest were obtained by Gaussian peak fitting using Grams AI. The intensity thus determined was scaled by the corresponding peak intensity of the bending mode of water in the spectrum. Using a calibration curve derived from a plot of concentration vs. this intensity ratio for a series of aqueous standards, the concentration of the species of interest could be calculated. Localised melting due to laser irradiation was not observed, as had been for glacial ice similarly analysed. Table 2 gives the calculated concentrations for each of the three species found in the PS-1 sample, along with the corresponding concentration of sulphate in the splat-cooled artificial seawater.
Table 2. Quantitative results for the Raman-microscopic analysis of the PS-1 sample along with splat-cooled artificial seawater. Values reported are mean ion concentration in mM ± 1 standard deviation. ‘n’ = number of measurements upon which the average is based; nd = below detection limit.

Spatial variability in vein concentrations
The vein-to-vein variability may be seen by a comparison of the 1σ values given for each analyte at a given depth in the ice sample. In general, this variation is much higher than the analytical uncertainty of the measurement. For example, for sulphate at PS-1-5 depth interval based on 8 measurements, the measured variation in vein concentration was 22 mM (48%), while analytical uncertainty is on the order of 1.3 mM (3.2%). While the analytical uncertainties were much larger for dibasic phosphate and carbonate, the vein-to-vein variation was larger still. For sulphate, this large variation in concentration was much more evident in sea ice than in the splat-cooled samples, where the vein-to-vein variation was around 10%, that is, approximately the analytical uncertainty at that concentration. This lower variation is probably due to the uniformity of both the starting solution concentration and the process of vein formation.
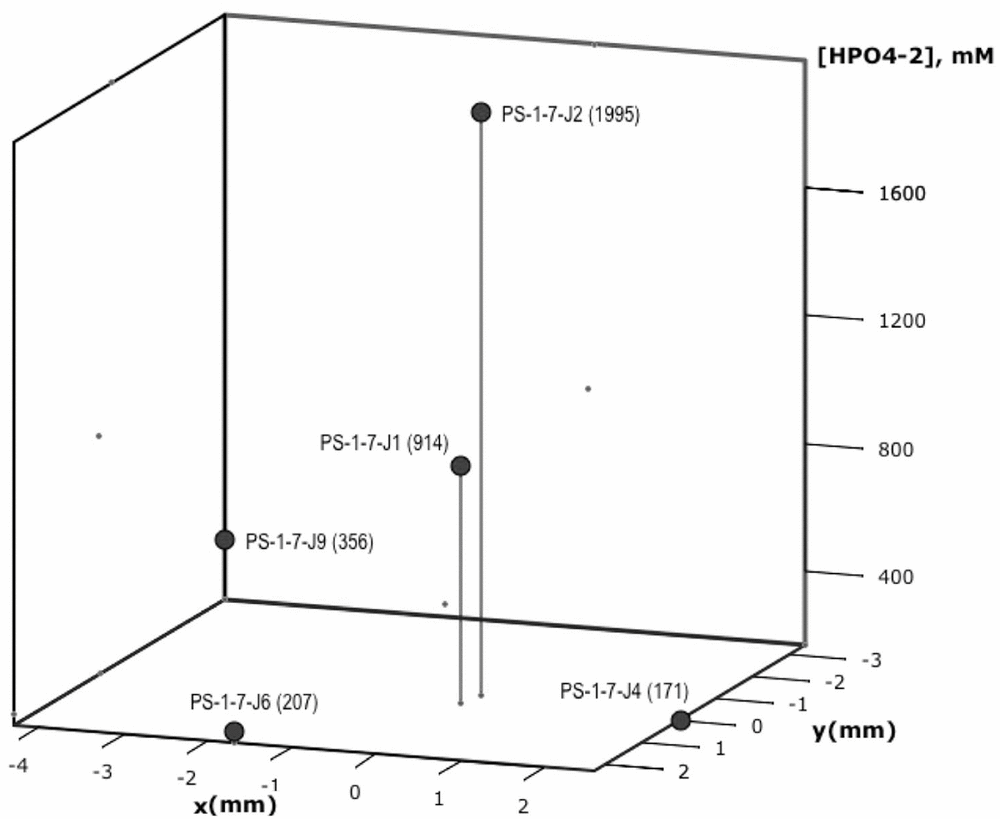
This vein-to-vein variation is particularly evident in dibasic phosphate measurements. For example, Fig. 4 shows a plot of the phosphate distribution for measurements taken at a single depth horizon, ~5–6 cm from the top of the sample (PS-1-7). For this section, a total of five measurements of vein anions were made. Of these five measurements, dibasic phosphate was found in each, sulphate in four and carbonate in one. Fig. 4 shows a plot of the dibasic phosphate as a function of relative position in the PS-1-7 slice. The area covered was 40 mm2. It can be seen from this figure that of the five vein concentrations measured in triple junctions at this depth horizon, the observed variability in dibasic phosphate concentration was roughly an order of magnitude, which is well outside the analytical uncertainty of these measurements. Based upon this high degree of variability in vein-to-vein concentrations, it is difficult to draw any firm conclusions concerning trends observed in concentration over the length of the sample. There appears to be a rough correlation, however, between the position of the maximum phosphate observed in the bulk measurements at approximately 10 cm from the top of the core, and that seen in the vein measurements at 5–6 cm from the top of the sea-ice sample.

Fig. 4. Dibasic phosphate concentration in mM shown as a function of relative position in the 5–6 cm depth horizon (PS-1-7). Sample identification number and dibasic phosphate (HPO42−) concentration in mM are given in parentheses next to each point.
Sources for molecular anions in sea ice veins
If one were to assume that sulphate is a suitable proxy for ions originating from the concentration of seawater in the veins, the data in Table 2 indicate a concentration factor of roughly 20–30% for sea ice, while it is nearly a factor of 2 for splat-cooled ice. As discussed above, these concentration factors would explain why neither nitrate nor ammonium was observed assuming their source were solely due to the concentration of bulk seawater. The minimal concentration factor for sulphate would imply that these ions, if present, are well below their Raman detection limits. It is a different story with both phosphate and carbonate. Neither of these anions were observed consistently throughout the PS-1 sample; when they were seen at a given depth horizon, their concentration were highly variable. Using the average values for observed phosphate and carbonate, enrichment factors of ~106 and ~103 with respect to typical seawater values were seen. Such high variability in concentration and high enrichment factors indicate the possibility of a different source and/or highly localised biogeochemical processes effecting the observed vein concentrations of carbonate and phosphate.
Carbonate and phosphate speciation and vein pH
Both phosphate and carbonate can exist as a variety of anions. The dominance of a particular species is dependent on temperature, pH and salinity. The phosphate speciation in a variety of media including high concentration NaCl solutions (0.6M) and artificial seawater (salinity = 35) has been determined (Kester and Pytkowicz Reference Kester and Pytkowicz1969). For both these situations, it was found that dibasic phosphate was the dominant species at a pH of 7.5 to 8. Millero and others (2006) have investigated the temperature and salinity dependence of the dissociation constants of carbonic acid in seawater. Using their measured values for the second dissociation constant at 1°C (the lowest temperature for which data were available), a salinity of 41 (an estimate of vein salinity with a concentration factor of ~1.25 applied) and the average concentration of carbonate measured in the veins, the observation of carbonate along with the absence of bicarbonate in the veins is consistent with an alkaline pH. Given the temperature dependence of the equilibrium constant, a drop in temperature would have the effect of further raising the pH within the veins relative to that calculated using the dissociation constants of Milero and others (2006). This conclusion is consistent with pH measurements in sea ice itself. For example, Geilfus and others report pH in young arctic sea ice in the range of 8.5–9.5, with ice closer to the surface being increasingly alkaline (Geilfus and others 2013). Thus, both the phosphate and carbonate observed in the sea ice vein system using high-spatial resolution Raman measurements form a consistent picture implying a basic pH in the veins.
Conclusions
Although limited in scope to a single, early season sea-ice sample, this study shows the value of Raman microscopy in investigating an important ecological system within the cryosphere. Taken as a whole, this initial investigation of the sea-ice vein chemistry indicates the importance of understanding this environment at a scale of relevance to trapped organisms. Simple models that predict nutrient concentration based upon inferred brine concentration factors and simple physical processes such as gravity drainage appear to be inadequate to describe the variation observed in the brine veins of cold (–9°C) ice, although they may have some relevance to warmer, channelised sea ice with a higher brine fraction. It is also noteworthy that the concentrations of some anions, for example sulphate and nitrate, appear to correlate reasonably well with a modest concentration of their seawater values, while others, for example phosphate and carbonate, do not. The speciation observed in vein phosphate and carbonate concentrations are, however, consistent with a slightly alkaline pH in the veins, which is in sharp contrast to the highly acidic environment observed in veins present in glacial ice by Barletta and others (Barletta and others 2012).
With respect to carbonate, an important component of the seawater buffer system, no evidence of precipitation within the veins was observed. This lack of precipitation could be due in part to the presence of micro-crystals with diameters much less than 1 μm or, if precipitation of carbonate occurred in this sea ice, to the entrainment of solids in regions other than the veins themselves. Absence of carbonate precipitates in triple junctions is consistent with the findings of Gleitz and others (1995) on sea ice brines, as well as more recent work by Rysgaard and others (2013) on Arctic ice. Micrographs in the latter work clearly show ikaite crystals in regions outside both the ice-crystal edges and triple junctions. This result is probably due to the relatively large size of ikaite crystals in sea ice. Nomura and others recently report measurement of ikaite size distribution in first year Arctic sea ice, finding a mean ikaite crystal size of 210 ± 116 μm and range of 36 to 812 μm (Nomura and others 2013). No large crystals were observed in any of the PS-1 samples, although it should be stressed that an exhaustive microscopic survey of each section was not performed.
The high (and variable) concentrations of carbonate are also an important consideration in modeling of sea ice at the micro-scale, because carbonate, like phosphate, could have an impact on primary production and drawdown of carbon dioxide within the ice itself. This is an area of inquiry lies outside of the scope of the present study. We did not directly observe any algae or bacteria in the samples studied. Through imaging studies, Junge and others (2001) have concluded that, in sea ice, most bacteria concentrate within triple junctions, brine veins and brine pockets rather than within the ice crystals, themselves. They have also observed that there is a paucity of data on the small-scale distribution of bacteria in sea ice. Attempts to measure algal primary production in situ are even more limited ((Mock and Gradinger Reference Mock and Gradinger1999; Mock Reference Mock2002) and, to our knowledge, have not been reported at the scale of our experiments. In Antarctic sea ice, Mock found, for example, carbon assimilation varied across the core, as well as seasonally, even in the autumn (Mock Reference Mock2002). Seasonal measurements of ice core chemistry at the micrometer scale could be useful in this regard.
With respect to the carbon cycle, in general, understanding of the role of sea ice is limited and in need of experimental measurements. A conceptual model describing the impact of sea ice on the carbon flux in which, during winter, sea-ice brine rejection acts as a pump for carbon dioxide into the intermediate and deep waters has been proposed (Rysgaard and others 2011). As the ice melts in spring, they conclude in agreement with other estimates of carbon fluxes that the resulting carbon- and salt-poor meltwater should become a sink for atmospheric carbon dioxide. They also conclude that, in winter, there is essentially no net transport of carbon dioxide to the atmosphere. This last conclusion conflicts with recent work by Miller and others (2011) who measured downward carbon dioxide fluxes of up to 0.7 μmol m−2 s−1 from February to May over Arctic sea ice. These authors conceded that the measured flux is too high to be explained by sea-ice permeability alone and have postulated dissolution in brine at the snow-ice interface. They also measured pCO2 values within the ice and concluded that, even during the winter, carbon dioxide is transported to the atmosphere and thus coupled with upward transport of carbonate-depleted brines. This work clearly demonstrates the need for more extensive measurement of the chemistry occurring within the ice before the processes can be completely understood and detailed modeling of carbon transport in the sea-ice system can be performed. Additional measurements of the vein chemistry of the sea-ice system that address seasonal variation could contribute to this understanding. Obviously, factors affecting the large spatial variation observed in this limited investigation will have to be better understood if such a temporal investigation would be worthwhile. It may be that statistical trends will be revealed with measurements of a larger number veins within a set of core samples that will contribute to this understanding.
In addition to the need for additional studies of this sort on sea-ice cores to explore the seasonal variation of the micro-chemistry of sea ice, an important limitation of this work is the inability of Raman spectroscopy to provide information on monatomic ions such as chloride and dissolved iron. Methodology such as synchrotron-based X-ray fluorescence microscopy could provide this information on sea ice veins on both qualitative and quantitative levels. Such data, when combined with Raman microscopy would provide valuable insights into the sea-ice vein micro-environment.
Acknowledgements
This work was supported by the NSF Office of Polar Programs, award numbers 0939628 and 0828786. We would also like to acknowledge Dr. Hugh Duclklow (Lamont-Doherty Earth Observatory) and Stian Alesandrini and Robert Kluckhohn of Raytheon Polar Services for their assistance in sample collection, L. Lynn and B. Wilson (Dauphin Island Sea Lab) for bulk chemical analysis, and A. Gandhakwala (Department of Chemistry, University of South Alabama) for preliminary data analysis.

