Introduction
Throughout the world, grass species are economically important both as the staple grain food for humans and as feedstock for animals. Of these species, sorghum is the fifth most common cereal globally (FAO, 1995, 1999) which is used in multiple ways worldwide. Unlike rice and other staple crops, which are widely used for food and industrial purposes, sorghum has so far remained a traditional food crop of subsistence farmers (Rai et al., Reference Rai, Murty, Andrews and Bramel-Cox1999). Sorghum is a major dryland cereal crop in environments with low and unpredictable rainfall and can also adapt well to various soil types and toxicities (Singh et al., Reference Singh, Oosterom, Jordan, Hunt and Hammer2001; Taylor and Dewar, Reference Taylor and Dewar2001; Vermerris et al., Reference Vermerris, Saballos, Ejeta, Mosier, Ladisch and Carpita2007).
Domestication of sorghum has been estimated to have occurred around 3000 BC in Africa, in particular, Ethiopia and part of the Congo region. The secondary centres of its domestication include India, Sudan and Nigeria (Ayana and Bekele, Reference Ayana and Bekele1998). Cultivated sorghum is classified into five main races (bicolor, guinea, caudatum, durra and kafir) (Harlan and de Wet, Reference Harlan and de Wet1972; Barnaud et al., Reference Barnaud, Deu, Garine, Chantereau, Bolteq, Koïda, McKey and Joly2008). These divisions are mostly based on panicle and grain characteristics as well as on the regions of Africa and India where the races are commonly found (Murray et al., Reference Murray, Rooney, Hamblin, Mitchell and Kresovich2009). Sorghum types can be identified according to their morphological traits (Kaitaniemi et al., Reference Kaitaniemi, Room and Hanan1999), especially the degree of expression of panicle and grain characteristics (Harlan and de Wet, Reference Harlan and de Wet1972; Abdi et al., Reference Abdi, Bekele, Asfaw and Teshome2002). The structure and type of panicles are not only important factors for identification of sorghum, but are also thought to contribute to the yield and quality of grain, as has been shown for rice and maize (Bommert et al., Reference Bommert, Satoh-Nagasawa, Jackson and Hirano2005; Yan et al., Reference Yan, Zhou, Yan and Yeboah2007; Ikeda, 2010). These characteristics are very helpful for breeding and botanical purposes and still remain of great interest to breeders (Futsuhara et al., 1979a, b; Bala et al., Reference Bala, Biswas and Ratnavathi1996; Kellogg, Reference Kellogg, Everett and Jacobs2000; Doust and Kellogg, Reference Doust and Kellogg2002; Doust et al., Reference Doust, Devos, Gadberry, Gale and Kellogg2005; Zhu et al., Reference Zhu, Tang, Yan, Chi, Yu, Chen, Liang, Gu and Cheng2010).
Only a few studies have been carried out on the morphological diversity of sorghum panicles. In sorghum, most of the yield-related traits are polygenic, but inflorescence architecture probably remains the most polygenic and complex trait (House, Reference House1985; Bello et al., Reference Bello, Kadams and Simon2001; Zou et al., Reference Zou, Yan, Zhai, Zhang, Zou and Tao2011). Sorghum panicles (inflorescence) have a large diversity of types, ranging from very open and loose types to a very compact type. In this study, we measured panicle dimensions, architecture and yield-related traits to capture the intraspecific variation in panicle-related traits across a large collection of 206 sorghum accessions from around the world and to examine the relationship that panicle type has on grain yield. The objectives of this study were (1) to investigate the diversity of panicle patterns across a worldwide collection of sorghum germplasm, (2) to identify the main components of variation in the inflorescence architecture of sorghum and (3) to clarify the association between panicle component traits and yield-related traits.
Materials and methods
Plant materials
In this study, we used 206 sorghum accessions collected from 27 countries in Asia (East, Southeast, South and Southwest Asia) and Africa. They were obtained from the germplasm collection at the National Institute of Agrobiological Sciences, Genebank, Japan. In this study, we divided the accessions into three geographical groups: East Asian group (66 accessions), Other Asian group (2 accessions from Southeast Asia, 60 accessions from South Asia and 2 accessions from Southwest Asia) and African group (76 accessions from Africa). A complete list of the accessions and groups is provided in Table S1 (available online).
Experimental design and field procedure
The study was conducted in 2010 and 2011 during the main growing seasons of sorghum in the experimental field at Agricultural and Forestry Center, University of Tsukuba, Japan. The sowing dates for the two seasons were 22 May 2010 and 27 May 2011, respectively. Dried seeds were prepared with fungicide 1 week before sowing and then the seeds were sown manually by the dibbling method directly into the field plots. Four individual plants were grown for each of the 206 accessions, and plants from the different accessions were grown together in the same field in 60 m × 1 m plots. During the anthesis stage, all the panicles were covered by paper bags to prevent outcrossing. The bags were removed after complete flowering.
Trait measurements and methods
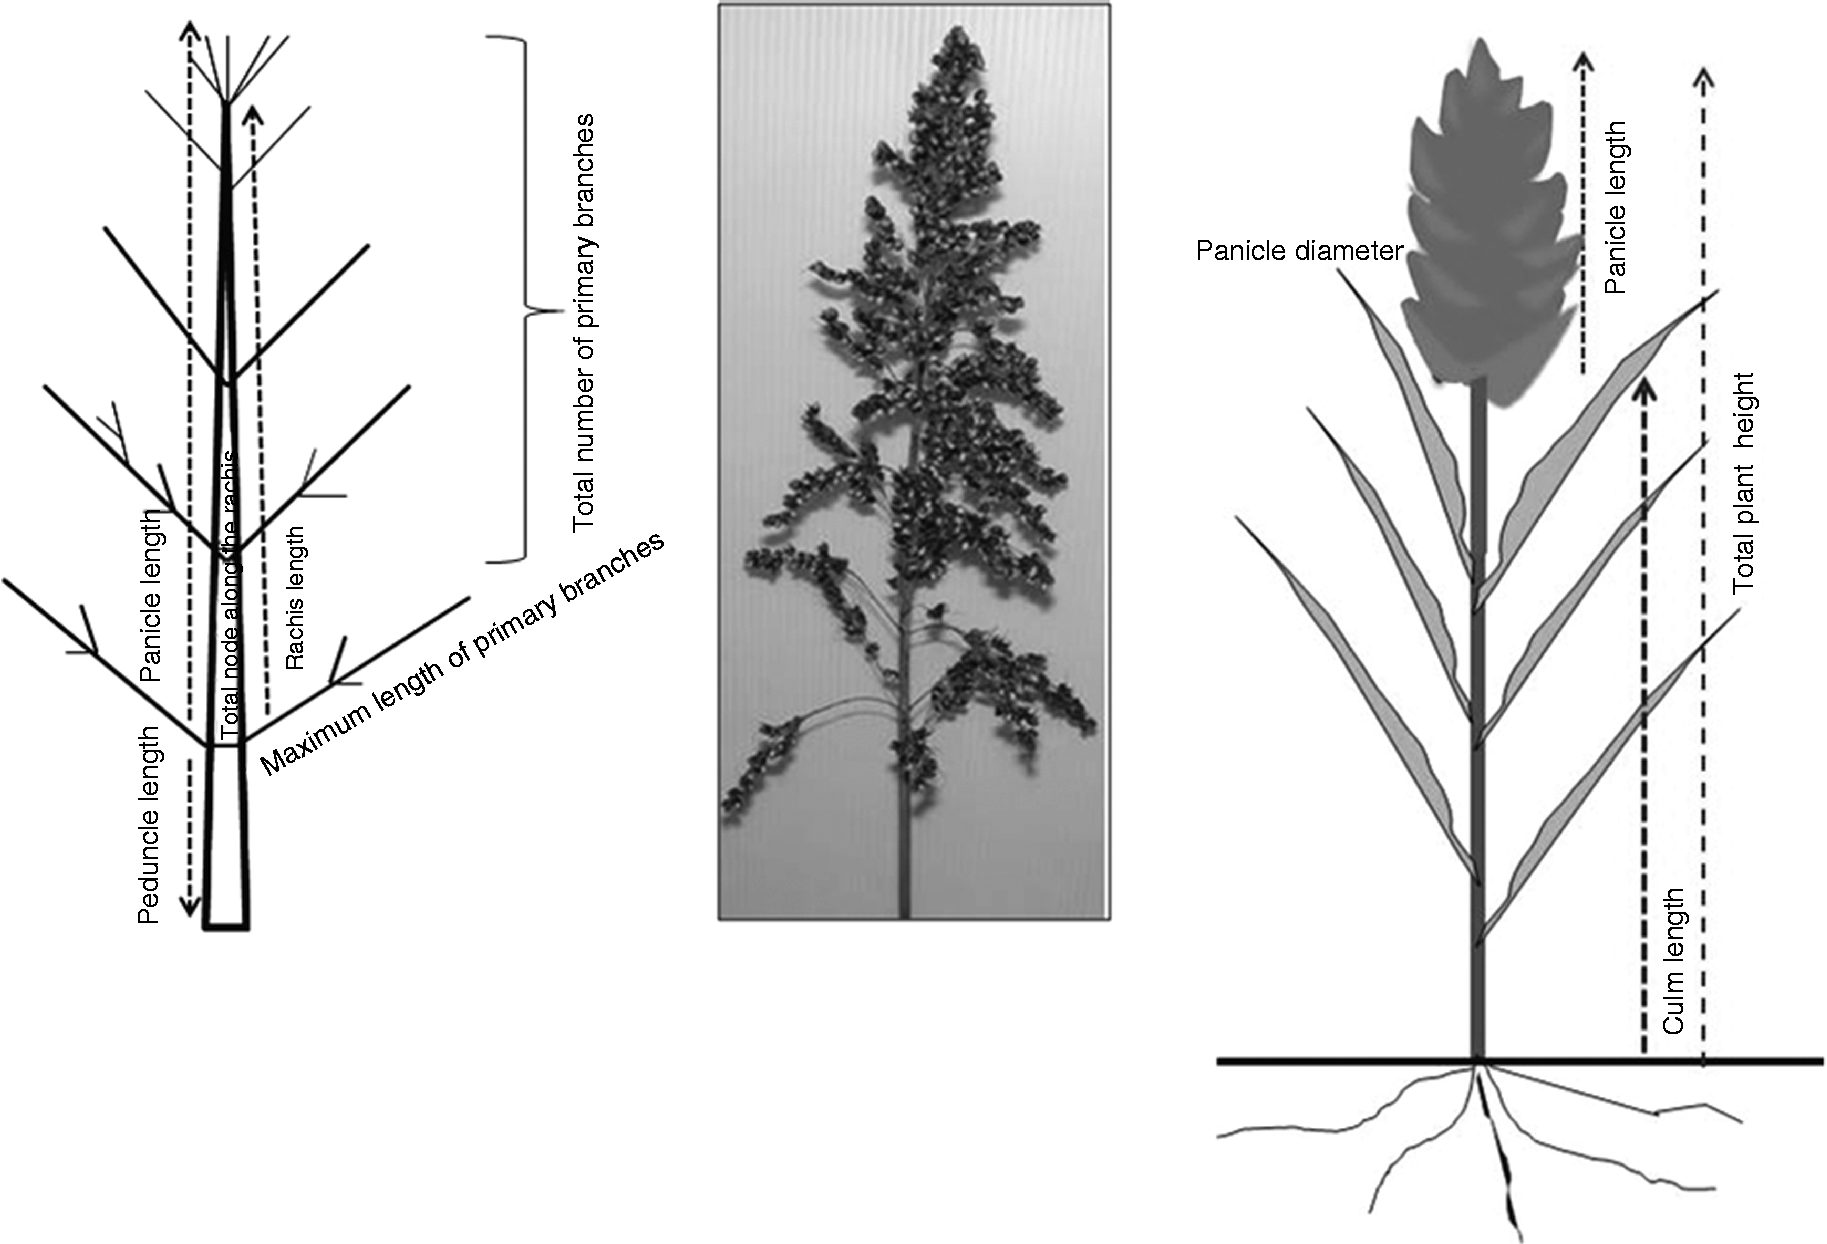
Data for 18 panicle-related traits were recorded according to the descriptors for sorghum obtained from the IBPGR, the ICRISAT and the NIAS Genebank detailed in Table S2 (available online). For each accession, panicle-related traits were measured using a single panicle from three separate plants and the results obtained were averaged. All measurements were made in metric units. At maturity, the main related traits to panicle components including rachis length (Rac), panicle length (PanL), peduncle length (Pend), panicle shape (PanS), panicle type (PanT), plant height (PanH) and culm length (CulmL) were evaluated (Fig. 1). Panicle diameter (PanD) and panicle width (PanW) were measured with a digital vernier caliper. Rac was measured as the distance from the bottom whorl to the topmost one. Pend was measured as the distance from the flag leaf to the lowest primary branch zone. After harvesting, all the labelled panicles were dried and cleaned before the measurement of traits. After cleaning the total number of nodes (TotN), total number of primary branches (TotBr) and the maximum length of the primary branch zone (MaxLBZ) were manually measured. TotBr was measured by removing the branches and counting them. TotN (total number on the rachis) was counted along the main axis. For the MaxLBZ, three random branches were selected from the longest branch zone in the bottom third whorl of the panicle. Thereafter, the grains were threshed, and the average number of grains per panicle (GNP) (average of three panicles per accession), grain weight per panicle (GWP) and 100-grain weight (GW) from each panicle were measured. The remaining traits, PanH, CulmL, panicle exsertion (PanEx), Pend and total number of panicles per plant (PanN), were measured using three plants per accession.

Fig. 1 Scheme of the sorghum inflorescence (panicle) traits investigated.
Statistical and general analyses
Analysis of variance (ANOVA) and principal component analysis (PCA) were performed using JMP statistical software version 5.0. For the analysis of the origin and inflorescence architecture of the sorghum accessions based on both country origin and panicle pattern, PCA was run on 14 quantitative traits. To understand the patterns of correlation among inflorescence architecture and their direct and indirect effects towards grain yield, path coefficient analysis with structural equation modelling methodology was carried out using WarpPLS software version 3.0 (Kock, Reference Kock2012).
Results
Phenotypic variations in panicle-related traits and other yield-related traits
We first examined the variation in the 14 quantitative traits related to the inflorescence architecture and yield components of sorghum accessions collected from the three geographical regions over 2 years. The means and ranges of these 14 quantitative traits are outlined in Table 1. East Asian, Other Asian and African sorghum accessions showed a broad range of variability for many of the traits that were measured. ANOVA indicated that half of the traits that were measured showed differences between the East Asian and the Other Asian groups. The African varieties had a reproducibly shorter Pend, more nodes (TotN) and a longer Rac.
Table 1 Analysis of variance (ANOVA) and values of the 14 quantitative traits in the 206 sorghum accessions across the three different regions

M, mean; Pend, peduncle length; Rac, rachis length; PanL, panicle length; PanH, plant height; CulmL, culm length; MaxLBZ, maximum length of the primary branch zone; TotN, total number of nodes along the rachis; TotBr, total number of primary branches per panicle; PanW, panicle width; PanD, panicle diameter; PanN, total number of panicles per plant; GNP, number of grains per panicle; GWP, total grain weight per panicle; GW, 100-grain weight.
*, **, *** Significantly different at P< 0.05, P< 0.01 and P< 0.001, respectively.
a Qualitative traits (such as panicle shape (PanS) and panicle type (PanT)) and quantitative traits (such as panicle broader (PanB) and panicle exsertion (PanEx)) were also recorded.
PCA of the 206 accessions of different origins
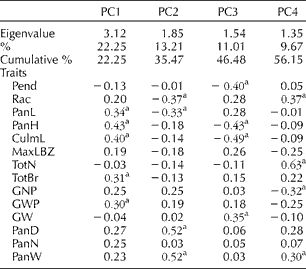
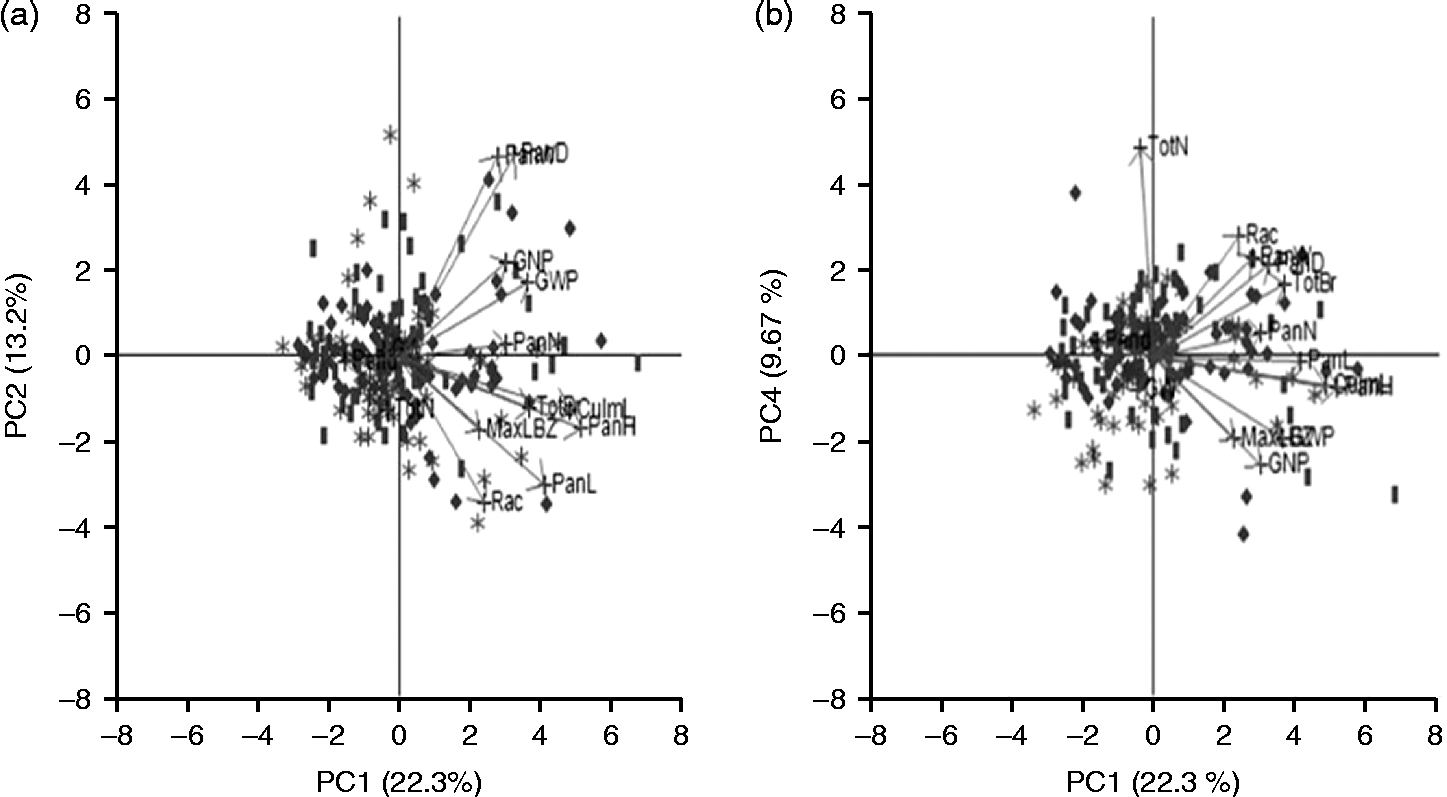
To explore the structure of the dataset, we carried out the PCA on the 14 quantitative traits (Fig. 2(a) and (b)). Examining PC1, 2 and 3 showed no significant separation based on regional origin; however, PC4 appeared to separate the East Asian varieties from the others. Eigenvector analysis (Table 2) suggested that the TotN is largely responsible for this separation. It is worth noting that we were unable to separate the African and Other Asian varieties in the PCA. This may be because there is still substantial diversity between countries within these two groupings.

Fig. 2 PCA of the 206 accessions (labelled by origin). Plots of (a) PC1 versus PC2 and (b) PC1 versus PC4. Legend for accessions: (![]() ) East Asia; (
) East Asia; (![]() ) Africa; (
) Africa; (![]() ) Other regions of Asia (South Asia, Southeast Asia and Southwest Asia); arrows indicate eigenvectors for the traits.
) Other regions of Asia (South Asia, Southeast Asia and Southwest Asia); arrows indicate eigenvectors for the traits.
Table 2 Eigenvectors for the 14 quantitative traits in the principal component (PC) analysis of the 206 sorghum accessions across the three regions and across the five different panicle types

Pend, peduncle length; Rac, rachis length; PanL, panicle length; PanH, plant high; CulmL, culm length; MaxLBZ, maximum length of the primary branch zone; TotN, total number of nodes along the rachis; TotBr, total number of primary branches per panicle; GNP, number of grains per panicle; GWP, total grain weight per panicle; GW, 100-grain weight; PanD, panicle diameter; PanN, total number of panicles per plant; PanW, panicle width.
a PC loadings larger than 0.30 and smaller than − 0.30 were regarded as substantial.
PCA of the 206 accessions based on the five different panicle types
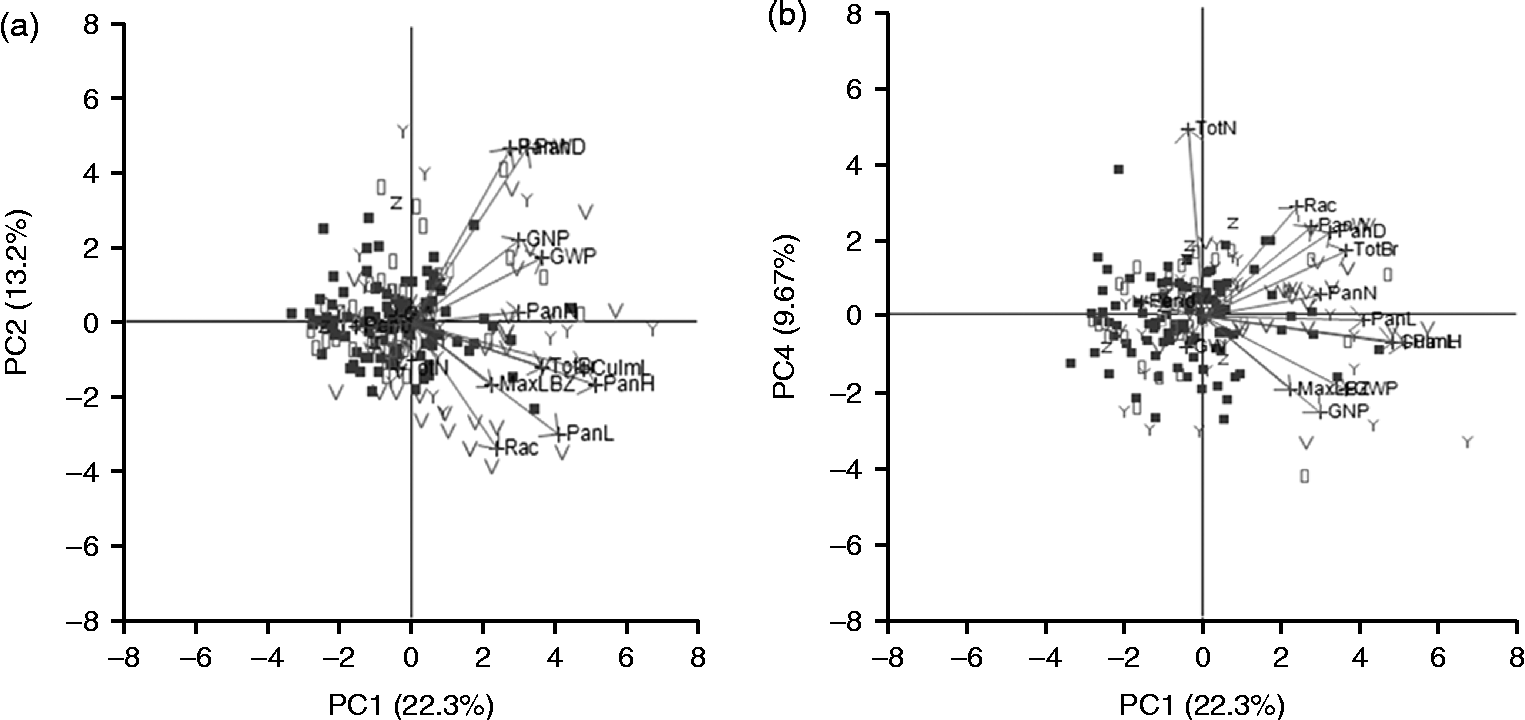
We determined whether the data separated were based on any of the panicle types (Fig. 3(a) and (b) and Table 2). We found that PC1 appeared to separate the open-panicle type and bloom-panicle type accessions from the others, but the remaining types were not separated by PC2, PC3 and PC4. Eigenvector analysis (Table 2) suggested that Rac, PanL, PanD, PanW and Pend were largely responsible for this separation and were key characteristics of inflorescence architecture. Together, this suggested that the panicle measurements used in this study can at least partially capture the diversity of panicle architecture in sorghum accessions.

Fig. 3 PCA of the 206 accessions (labelled by panicle type). Plots of (a) PC1 versus PC2 and (b) PC1 versus PC4. Legend for accessions: (![]() ) open type; (
) open type; (![]() ) intermediate type; (
) intermediate type; (![]() ) compact type; (
) compact type; (![]() ) bloom type; (
) bloom type; (![]() ) mix type; arrows indicate eigenvectors for the traits.
) mix type; arrows indicate eigenvectors for the traits.
Phenotypic correlation among the traits
We next examined whether there were significant correlations between the measured traits. Trait pairs with significant correlations (P< 0.001) are summarized in Table 3. A full set of pairwise correlations is provided in Table S3 (available online). Of the 14 quantitative traits, 12 showed at least one highly significant (P< 0.001) correlation with another (except for Pend and GW). In terms of panicle architecture, most of the length-based measurements showed a trend to be correlated. In particular, PanL positively correlated with most of the length-based measurements (Rac, MaxLBZ, PanW, PanH and CulmL), and PanN and TotBr. Additionally, the TotBr and PanN also correlated with PanL and PanH.
Table 3 Spearman's correlation coefficient among the quantitative traits of the 206 sorghum accessionsa

PanL, panicle length; PanW, panicle width; PanH, plant height; Rac, rachis length; CulmL, culm length; TotBr, total number of primary branches per panicle; PanD, panicle diameter; PanN, total number of panicles per plant; MaxLBZ, maximum length of the primary branch zone; TotN, total number of nodes along the rachis; Pend, peduncle length; GNP, number of grains per panicle; GWP, total grain weight per panicle.
*, **, *** Significantly different at P< 0.05, P< 0.01 and P< 0.001, respectively.
a Only traits with highly correlated pairs are shown. An extended version of this table with all pairwise comparisons of the 14 quantitative traits is given in Supplementary Table 4 (available online).
Importantly, grain yield-related traits were also positively correlated with most of the length-based measurements. In particular, GWP was correlated with PanW (0.29), PanD (0.27), PanH (0.23), PanL (0.22), CulmL (0.22) and the non-length measurements such as total branches on the rachis (TotBr; 0.21) and PanN (0.22). Also, GNP was correlated with PanW (0.23). As expected, GNP was highly correlated with GWP (0.60). Pend was negatively correlated with yield-related traits (GNP − 0.17 and GWP − 0.16).
Path coefficient analysis
Given the observed correlations between the various length measurements and grain yield-related traits, we carried out the path coefficient analysis to understand the interaction among all the measured traits. The analysis (Table S4, available online) showed that grain yield was directly influenced by PanL (0.255), PanW (0.343), TotBr (0.240), and PanD (0.281). As expected, GNP had the highest positive direct influence on grain yield (0.73). Grain yield was also indirectly affected by MaxBL via PanL (0.303), Rac via PanL (0.548) and TotN via Rac (0.409). In terms of the relationships between the panicle-related traits, direct relationships of PanL with Rac (0.548), MaxLBZ (0.303) and PanW (0.106) were identified.
Discussion
We examined the diversity of the panicle across 206 accessions from a collection that covers most of the diversity of geographical origins and panicle types known for sorghum. We used 14 measured traits to attempt to capture the diversity of panicle architecture. ANOVA identified significant differences between East Asian and Asian accessions for half of these traits, with the African accessions tending to have a shorter Pend, more nodes (TotN) and a longer Rac. Despite this, PCA was only able to partially separate the East Asian varieties from the African and other regions of the Asian varieties (Fig. 2(a) and (b)). This suggests that there is lower diversity in the East Asian varieties, which agrees with an African origin of sorghum, and that early domestication in Africa and Western Asia led to a higher diversity (House et al., 1985; Shehzad et al., Reference Shehzad, Okuizumi, Kawase and Okuno2009). This also supports the observation that most of the loose-panicle varieties are obtained from East Asia. The open-panicle types may have originated as an adaptive trait to allow quick drying of panicles in high-humidity environments and to minimize damage caused by fungal diseases. Thus, our results indicate that panicle types of sorghum distributed throughout the African and Asian regions most probably vary according to different adaptation levels, temperature, humidity and rainfall patterns. The diversity in shape and compactness are likely to influence the selection of varieties that can survive in different local environments, which is largely independent of grouping by continent.
When examining the separation of varieties based on panicle types, the first component of the PCA was able to partially separate the bloom-panicle and open-panicle types from the others (Fig. 3(a) and (b)). This suggests that the measurements used in this study can at least partially capture the diversity of panicle architecture. The traits responsible for this separation were mainly the length-based traits, such as Rac, PanL, PanD, PanW and Pend, suggesting that they are the key determinants for describing the diversity of the panicle. Additional traits such as TotBr and TotN are also important in further describing the structure of the panicle, and advanced methods that automatically capture the architecture of the panicle using image analysis will be useful in the future (Ikeda et al., Reference Ikeda, Hirose, Takashi, Shibata, Yamamura, Komura, Doi, Ashikari, Matsuoka and Kitano2010).
When examining the correlations between the measured traits, we observed that many of the length-based elongation measurements showed a positive correlation. In particular, PanW, PanH, Rac, CulmL and MaxLBZ were positively correlated with PanL (Table 3 and Table S3, available online). Interestingly, PanL also positively correlated with the PanN and the TotBr. This relationship between the patterns of branching traits and panicle characteristics is in agreement with another previous study by Vollbrecht et al., Reference Vollbrecht, Patricia, Lindee, Edward, Buckler and Robert2005 who reported that inflorescence architecture comprises the stereotypical number and arrangement of floral branches in grasses including domesticated cereals.
In terms of the relationship between yield and panicle architecture, we found that PanW, PanD and PanH correlated with grain yield per panicle (GWP). In addition, the PanN was correlated with PanW (Table 3 and Table S3, available online). Our results agree with previous studies by Maman et al. (Reference Maman, Mason, Lyon and Dhungana2004) and Saeed and Francis (Reference Saeed and Francis1983) who reported that yield per plant and head length were highly correlated. Path coefficient analysis indicated that PanL had a positive effect on yield-related traits. Moreover, PanW, TotBr, PanD and GNP were also shown to have a strong effect on yield (Table S4, available online). This result revealed that the selection of varieties based on PanL, Rac, TotBr, PanD and PanW may improve grain yield.
We set out to measure the intraspecific variation in panicle-related traits across a large collection of 206 sorghum accessions to identify the relationship between these traits and yield components. To do this, we used a set of measurements to approximate panicle architecture, including length and branching measurements. We showed that many of these length-based measurements were correlated, which may suggest a common genetic regulation, and that several traits were likely to influence yield. These results can be used as preliminary findings for quantitative trait loci studies to find genetic markers for panicle-related traits in sorghum, with the aim to improve the yield of this crop.
Supplementary material
To view supplementary material for this article, please visit http://dx.doi.org/10.1017/S1479262113000154
Acknowledgements
We thank Dr Alistair Forrest, RIKEN, Omics Science Center for correcting the English language and for helpful comments on the manuscript.


