Introduction
The identification and characterization of plant breeding material is important for the documentation and utilization of genetic resources. Several morphological, physiological and molecular methods have been developed for this purpose (Liu et al., Reference Liu, Ikeda and Tsunewaki1992). Marker systems that show high levels of DNA polymorphism are a prerequisite for distinguishing closely related genotypes of self-pollinating crops such as bread wheat (Triticum aestivum L.).
Retrotransposons are among the most prevalent class of eukaryotic transposable elements, characterized by their ability to transpose via an RNA intermediate, which they convert to DNA by reverse transcription prior to insertion (Waugh et al., Reference Waugh, McLean, Flavell, Pearce, Kumar, Thomas and Powell1997). Monocot retrotransposons expressed sequence tags (ESTs) tend to match across multiple genera (Vicient et al., Reference Vicient, Jääskeläinen, Kalendar and Schulman2001), e.g. molecular markers derived from barley retrotransposons have been shown to reveal genetic diversity in wheat (Gribbon et al., Reference Gribbon, Pearce, Kalendar, Schulman, Paulin, Jack, Kumar and Flavell1999).
The long terminal repeat (LTR) retrotransposon superfamily, including the transpositionally active large retrotransposon derivative (LARD) Sukkula elements in barley (Kalendar et al., Reference Kalendar, Vicient, Peleg, Anamthawat-Jonsson, Bolshoy and Schulman2004), is the most abundant in crop species (Sabot et al., Reference Sabot, Simon and Bernard2004). LTRs do not excise as part of the retrotransposition mechanism, thus marker band polymorphisms represent the integration of new retrotransposon copies and irreversible biological events (Vicient et al., Reference Vicient, Jääskeläinen, Kalendar and Schulman2001). Retrotransposon markers are therefore highly suitable for studies of genetic diversity and have been applied to pea (Ellis et al., Reference Ellis, Poyser, Knox, Vershinin and Ambrose1998; Pearce et al., Reference Pearce, Knox, Ellis, Flavell and Kumar2000), the genera Aegilops and Triticum (Queen et al., Reference Queen, Gribbon, James, Jack and Flavell2004), tomato and pepper (Tam et al., Reference Tam, Mhiri, Vogelaar, Kerkveld, Pearce and Grandbastien2005).
Retrotransposon markers generate data that are more consistent with geographical and morphological criteria than amplified fragment length polymorphism (AFLP) based markers (Ellis et al., Reference Ellis, Poyser, Knox, Vershinin and Ambrose1998). In a comparative study of genetic diversity in tomato and pepper, the retrotransposon-based sequence-specific amplified polymorphism (S-SAP) method (Waugh et al., Reference Waugh, McLean, Flavell, Pearce, Kumar, Thomas and Powell1997; Gribbon et al., 1999) showed the highest number of polymorphic bands and marker index, and was thus found to be more informative than AFLP or simple sequence repeats (SSR), although estimates of genetic relationships were significantly correlated between datasets (Tam et al., Reference Tam, Mhiri, Vogelaar, Kerkveld, Pearce and Grandbastien2005).
Investigations of genetic diversity in wheat using molecular markers have demonstrated a set of different temporal and geographical scenarios. No significant decrease in overall genetic diversity but a qualitative temporal shift was detected among 55 UK wheat accessions from 1934 to 1995 using six AFLP and 14 SSR loci (Donini et al., Reference Donini, Law, Koebner and Reeves2000). A decrease in allelic diversity after the 1960s was demonstrated in a study of 559 French bread wheat accessions from 1800 to 2000 using 42 SSRs (Roussel et al., Reference Roussel, Koenig, Beckert and Balfourier2004) and in 480 European wheat cultivars from 1840 to 2000 using 39 SSRs (Roussel et al., Reference Roussel, Leisova, Exbrayat, Stehno and Balfourier2005). In contrast, allelic diversity in 75 Nordic spring wheat cultivars using 47 SSRs was found to have increased from 1900 to 1940 and again from the 1960s (Christiansen et al., Reference Christiansen, Andersen and Ortiz2002). Similarly, genetic diversity in 91 Bulgarian accessions from 1925 to 2003, using 19 SSRs, was found to increase after 1960 (Landjeva et al., Reference Landjeva, Korzun and Ganeva2005). Genetic diversity among 253 CIMMYT wheat cultivars, landraces and Aegilops tauschii Coss. accessions using 90 SSRs was found to decrease from 1950 to 1989 and increase from 1990 to 1997 through introgression of novel material (Reif et al., Reference Reif, Zhang, Dreisigacker, Warburton, van Ginkel, Hoisington, Bohn and Melchinger2005).
The aim of the present study was to use S-SAP to fingerprint 198 bread wheat accessions from the Nordic countries Sweden, Norway, Finland and Denmark and to: (1) estimate levels of genetic diversity within and between growth habit, countries and time periods; (2) assess the relationships among accessions; and (3) determine the number of accessions needed for an ex situ core collection of Nordic bread wheat.
Materials and methods
Plant materials and S-SAP reactions
The material comprised 32 landraces and 166 bread wheat cultivars of spring or winter type from the 19th to the 21th century and Sweden, Norway, Denmark or Finland. Seed was donated by the Nordic Gene Bank (NGB), the John Innes Centre (JIC) and plant breeding companies Svalöf-Weibull AB (SW), Pajbjerg Fonden and Abed Fonden (Table 1). Information on pedigrees and year of release was provided by Svalöf-Weibull AB, the Nordic Gene Bank or obtained from the internet at Wheat Pedigree and Identified Alleles of Genes On Line database (http://genbank.vurv.cz/wheat/pedigree/) (WPIAG 2007-01-10).
Table 1 Material used in sequence-specific amplification polymorphism (S-SAP) analysis of Nordic wheat landraces and cultivars

R, region of origin: D, Denmark; F, Finland; N, Norway; S, Sweden. G, growth habit: s, spring; w, winter. Year of release or approval.
† Accessions from: AF, Abed Fonden; NGB, Nordic Gene Bank; JIC, John Innes Centre; PF, Pajbjerg Fonden; SW, Svalöf-Weibull AB.
‡ /Primary cross, //secondary cross, raised number preceding number of backcrosses, (s) selection; n/a not available.
Genomic DNA was extracted from a bulk of 30 seeds of each accession using a DNeasy96 Plant Kit (Qiagen, Crawley, UK). The S-SAP method (Waugh et al., 1997; Leigh et al., 2003) was used with the following modifications. Genomic DNA (400 ng) was incubated with 5 U TaqI (New England BioLabs, Ipswich, UK) in 5 × RL buffer (50 mM TRIS-acetate pH 7.5, 50 mM magnesium acetate, 250 mM potassium acetate, 25 mM DTT and 25 ng/μl BSA) in a total volume of 40 μl per reaction at 65°C for 3 h. Template DNA was prepared by adding 10 μl of a ligation mixture [50 pmol TaqI (5′-ATG AGT CCT GAA-3′ plus 5′-CGT TCA GGA CTC AT-3′), 5 × RL buffer, 0.1 mM ATP, 1 U T4 DNA ligase (Invitrogen, Paisley, UK)] and incubating at 37°C overnight. The samples were then diluted with 100 μl T0.1E (10 mM TRIS–HCl pH 8.0, 0.1 mM EDTA) and stored at − 20°C.
The Sukkula-9900-LARD retrotransposon has been found to be highly polymorphic in wheat (Hysing, unpublished results 2004). The relative activity of Sukkula elements in barley has been estimated to be less than that of BARE-1, while the order of copy number is similar to that of BARE-1 (Leigh et al., Reference Leigh, Kalendar, Lea, Lee, Donini and Schulman2003), which is present in 14 000 full-length copies (Vicient et al., Reference Vicient, Suoniemi, Anamthawat-Jönsson, Tanskanen, Beharav, Nevo and Schulman1999) and more than 1 × 10− 5 solo LTRs (Shirasu et al., Reference Shirasu, Schulman, Lahaye and Schulze-Lefert2000). The Sukkula-9900-LARD oligonucleotide primer (5′-GAT AGG GTC GCA TCT TGG GCG TGA C-3′) was end-labelled by incubating 0.134 μl Sukkula-9900-LARD (50 ng/μl stock) with 0.1 μl γ-[33P]ATP (3000 Ci/mmol), 0.1 μl 10 × T4 buffer, 0.25 U T4 polynucleotide kinase (0.025 μl) (Invitrogen) in a total volume of 0.668 μl per subsequent reaction at 37°C for 2–3 h. Each selective amplification reaction contained 0.66 μl [33P]-labelled Sukkula-9900-LARD, 2 μl unlabelled Sukkula-9900-LARD adaptor primer (5′-ATG AGT CCT GAA CGA-3′) (50 ng/μl stock) with one of five different combinations of selective bases at the 3′ end (-AAT, -TAA, -ATT, -CAT, -CAA), 1 μl 10 × PCR buffer, 1 μl dNTP mix (2 mM stocks, Amersham Biosciences, Little Chalfont, UK), 3 μl digested template, 0.08 μl (0.4 U) Taq DNA polymerase (Qiagen) and 2.26 μl sterile distilled water. The touchdown polymerase chain reaction (PCR) protocol of Vos and co-workers (Reference Vos, Hogers, Bleeker, Reijans, van der Lee, Hornes, Frijters, Pot, Peteman, Kuiper and Zabeau1995) was followed.
The PCR products were mixed with an equal volume of loading buffer (94% de-ionized formamide, 10 mM EDTA, 0.5 mg/ml bromophenol-blue, 0.5 mg/ml xylene cyanol FF) and denatured at 95°C for 5 min. Amplification products were resolved by loading an aliquot of 4 μl from each sample onto 6% denaturing polyacrylamide gels (Sequa Gel 6, National Diagnostics (UK) Ltd-AGTC Bioproducts, Hessle, UK) and electrophoresed on Bio-Rad vertical gel apparatus for 2 h at 80 W constant power (Bio-Rad, Hemel Hempstead, UK). Gels were transferred to Whatman chromatography 3 mm paper (Fischer), dried and exposed to Kodak XO-Mat Imaging film for 3 d at room temperature. DNA fingerprints were evaluated and scored manually.
Statistical analyses
Each S-SAP band was treated as an independent locus with two alleles, presence or (1) or absence (0) of a band. Gene variation was quantified through 1 − p 2 − q 2, where p is the frequency of band-presence and q is the frequency of band-absence. This measure has been referred to as gene diversity (Weir, Reference Weir1996), expected heterozygosity H (Nei, Reference Nei1973), or polymorphic index content PIC (Ghislain et al., Reference Ghislain, Zhang, Fajardo, Huamán and Hijmans1999). The latter term is commonly used for comparisons of primers or markers, and it is customary to calculate the sum in the case of a multiplex marker, e.g. when several loci are scored for the same primer pair. It should be mentioned that originally PIC was defined as the probability to deduct which allele an offspring had received from a specific parent if the genotypes of both parents and the offspring are known (Botstein et al., Reference Botstein, White, Skolnick and Davies1980). In the following we will use the term ‘gene diversity’, and the symbol H when applied to categories of accessions and PIC when applied to primer extensions.
The first application of this measure was to evaluate the informativeness and genetic diversity of each S-SAP primer extension. The sum of PIC values for all bands generated by the same primer extension constituted the S-SAP primer extension index. Gene diversity (H) was then calculated for the entire material, and for categories based on growth habit (spring/winter), country of origin (Sweden, Norway, Denmark, Finland) and time period of release (decade).
Genetic differentiation among categories was calculated using Wright's fixation index (F ST). The significance values for differentiation among categories were obtained through a bootstrap randomization procedure using 10 000 simulations in the SAS statistical package (Statistical Analyses System, Version 9.1.3, SAS Institute, Cary, North Carolina, USA). The relationships between categories and accessions were then visualized by using principal coordinates analysis (PCoA) based on Eigen vector values of the primary matrix (Flury, Reference Flury1984). In addition, pairwise comparisons were calculated among all accessions using the Jaccard index (Weising et al., Reference Weising, Nybom, Wolf and Kahl2005). The resulting matrix was employed in a cluster analysis performed with the NTSYS-pc statistical package (Rohlf, Reference Rohlf1998) and using the unweighted pair/group method with arithmetic averages (UPGMA) (Sneath and Sokal, Reference Sneath and Sokal1973).
Suggestions for an ex situ core collection were generated by a program written in Dev-Pascal 1.9.2 based on the maximum genetic diversity algorithm (Marita et al., Reference Marita, Rodriguez and Nienhuis2000). The initial accession was chosen randomly. A mean index (I) describing the proportion of loci including both presence (1) and absence (0) of the alleles was calculated for core collections based on 10, 15, 20, 30, 50 and 100 accessions (20 replications each).
Results
S-SAP amplification
A binary matrix based on 142 polymorphic S-SAP bands was generated by scoring the presence (1) and absence (0) of bands. Values obtained for the S-SAP primer extension indices were PICTAA = 9.3, PICAAT = 8.6, PICATT = 6.2, PICCAA = 5.6 and PICCAT = 3.5, indicating that the TAA extension yielded the highest number of polymorphic bands.
Gene diversity within categories
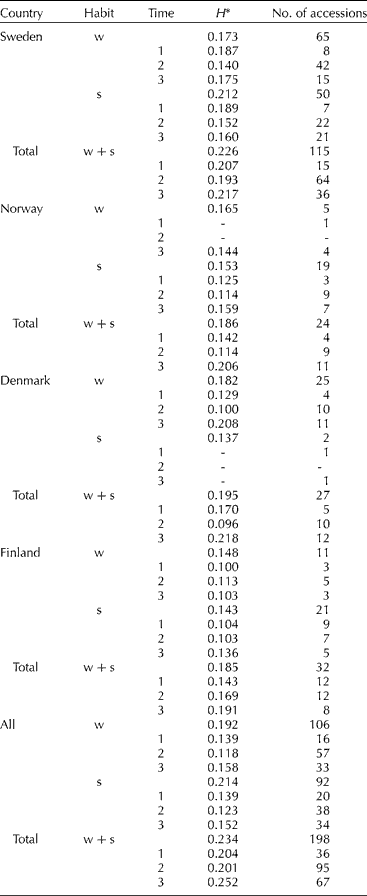
Comparisons of the amount of gene diversity (H) within categories (Table 2) revealed higher average gene diversity for the spring growth habit than winter habit in Sweden, and for the entire material in Sweden, in contrast to Norway, Denmark and Finland. Winter wheat is more common than spring wheat in Denmark and the majority of the Danish accessions were of winter habit. The results for Norway and Finland could not be explained except for the lower number of winter accessions compared to that in Sweden. Gene diversity partitioned between countries showed a decrease in H from Sweden > Denmark > Norway ≈ Finland, and with the highest figure (0.234) for the entire material. It is possible that the gene diversity estimates could have been biased by the disproportionate number of accessions in each category; however, the results indicate a slight difference in H between countries.
Table 2 Number of accessions, S-SAP bands and gene diversity (H) for different categories in Sweden, Norway, Denmark and Finland partitioned by habit (w= winter, s= spring) and time period (1= before 1910, 2=1910–1969, 3=1970–2003)
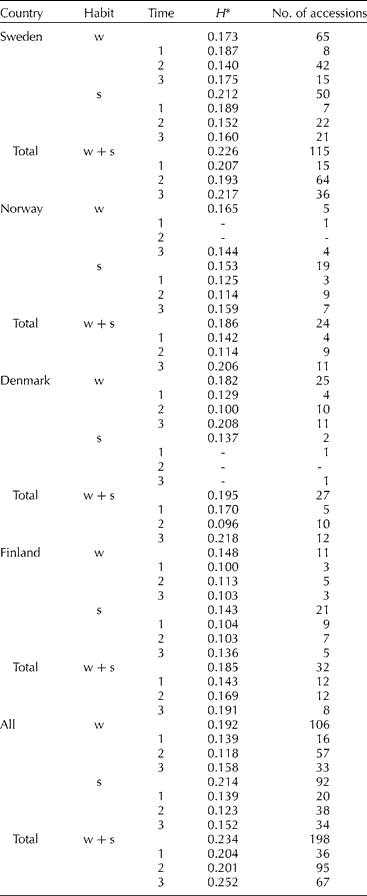
* Differences in allele frequencies between categories result in a higher H for total than the individual categories.
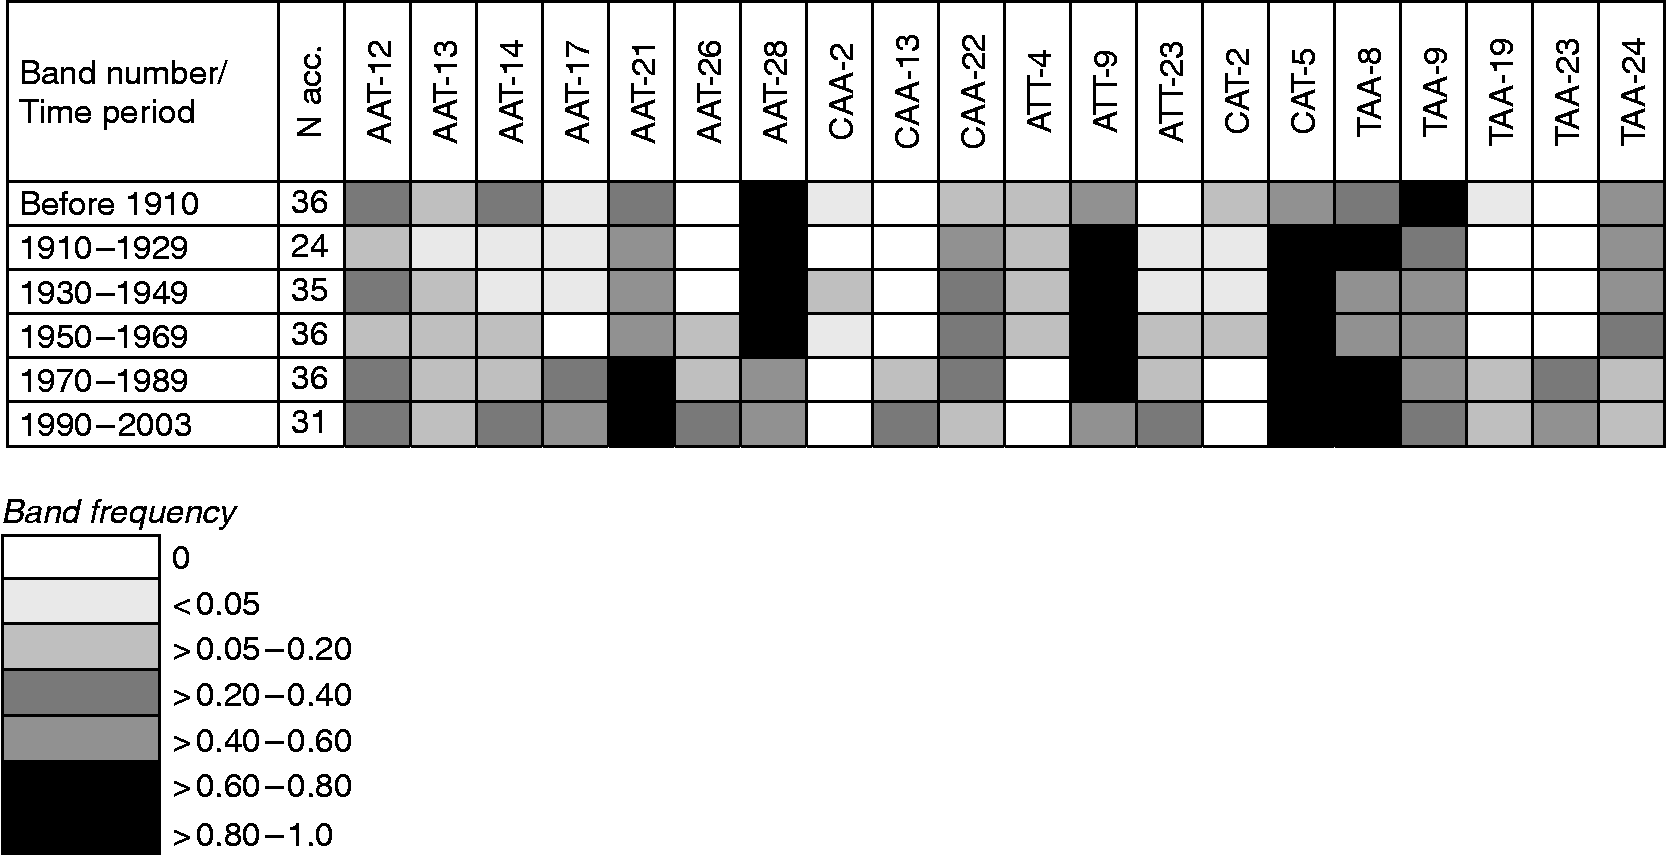
Gene diversity in winter and spring wheat (Table 2) appears to have declined from the turn of the 19th century until the late 1960s and subsequently increased to the original level and above. The net gain in gene diversity was 12% in winter wheat, 8% in spring wheat and 19% in total (Table 2). The changes in gene diversity were also apparent as changes in band frequencies over time, where some bands were lost and others gained (Fig. 1). In all, eight S-SAP bands present in the landraces and cultivars before 1910 were not found in the modern material released during 1989 to 2003; conversely, 11 bands not found among the landraces were present in the modern material. These results seem to reflect the impact of plant breeding on gene diversity where pure line selections in the early 1900s led to a decrease in diversity, similar to a bottleneck, while the incorporation of exotic material beginning in the 1950s has contributed to an increase in diversity.
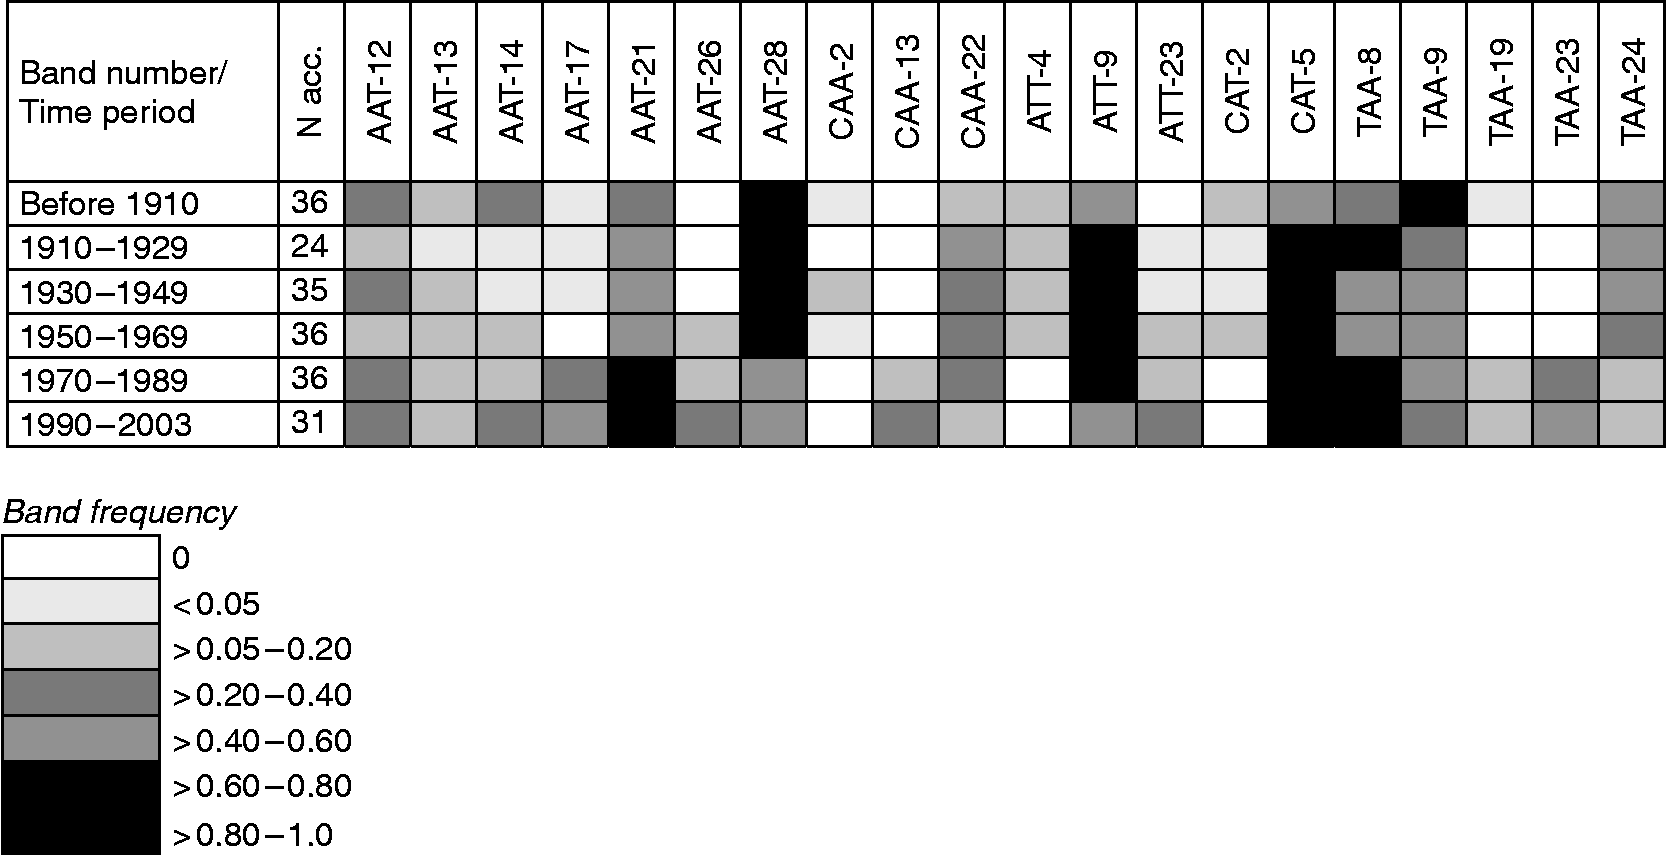
Fig. 1 Examples of changes in band frequencies of S-SAP marker extensions (AAT, CAA, ATT, CAT and TAA) across time (all countries) in Nordic wheat.
Gene diversity between categories
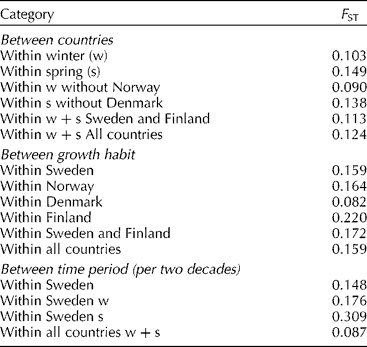
Comparisons of the amount of genetic differentiation (F ST) between categories (Table 3) showed that the values were significantly higher for growth habit than for countries (P = 0.012). The means were adjusted according to the number of accessions in each population (Norway had only five winter wheat accessions and Denmark two spring wheat accessions). The genetic differentiation was highest between growth habits in Finland, followed by Norway, Sweden and Denmark, indicating a greater separation between spring and winter germplasm in Finland than in other Nordic countries. Comparisons of F ST between time periods in Sweden were higher for spring than winter wheat. In all, the differentiation between time period categories was lower than differentiation due to growth habit or country.
Table 3 Pairwise comparison of genetic differentiation (F ST, averaged over pairs of population categories)*
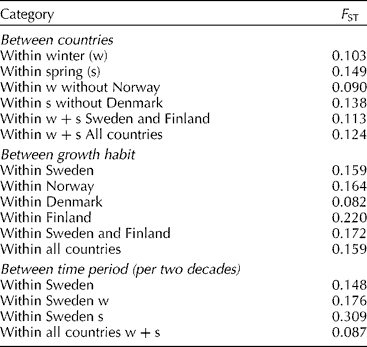
* Figures were also calculated without Norway or Denmark as Norway had only five winter wheat accessions and Denmark two spring wheat accessions.
Genetic relationships among categories and accessions
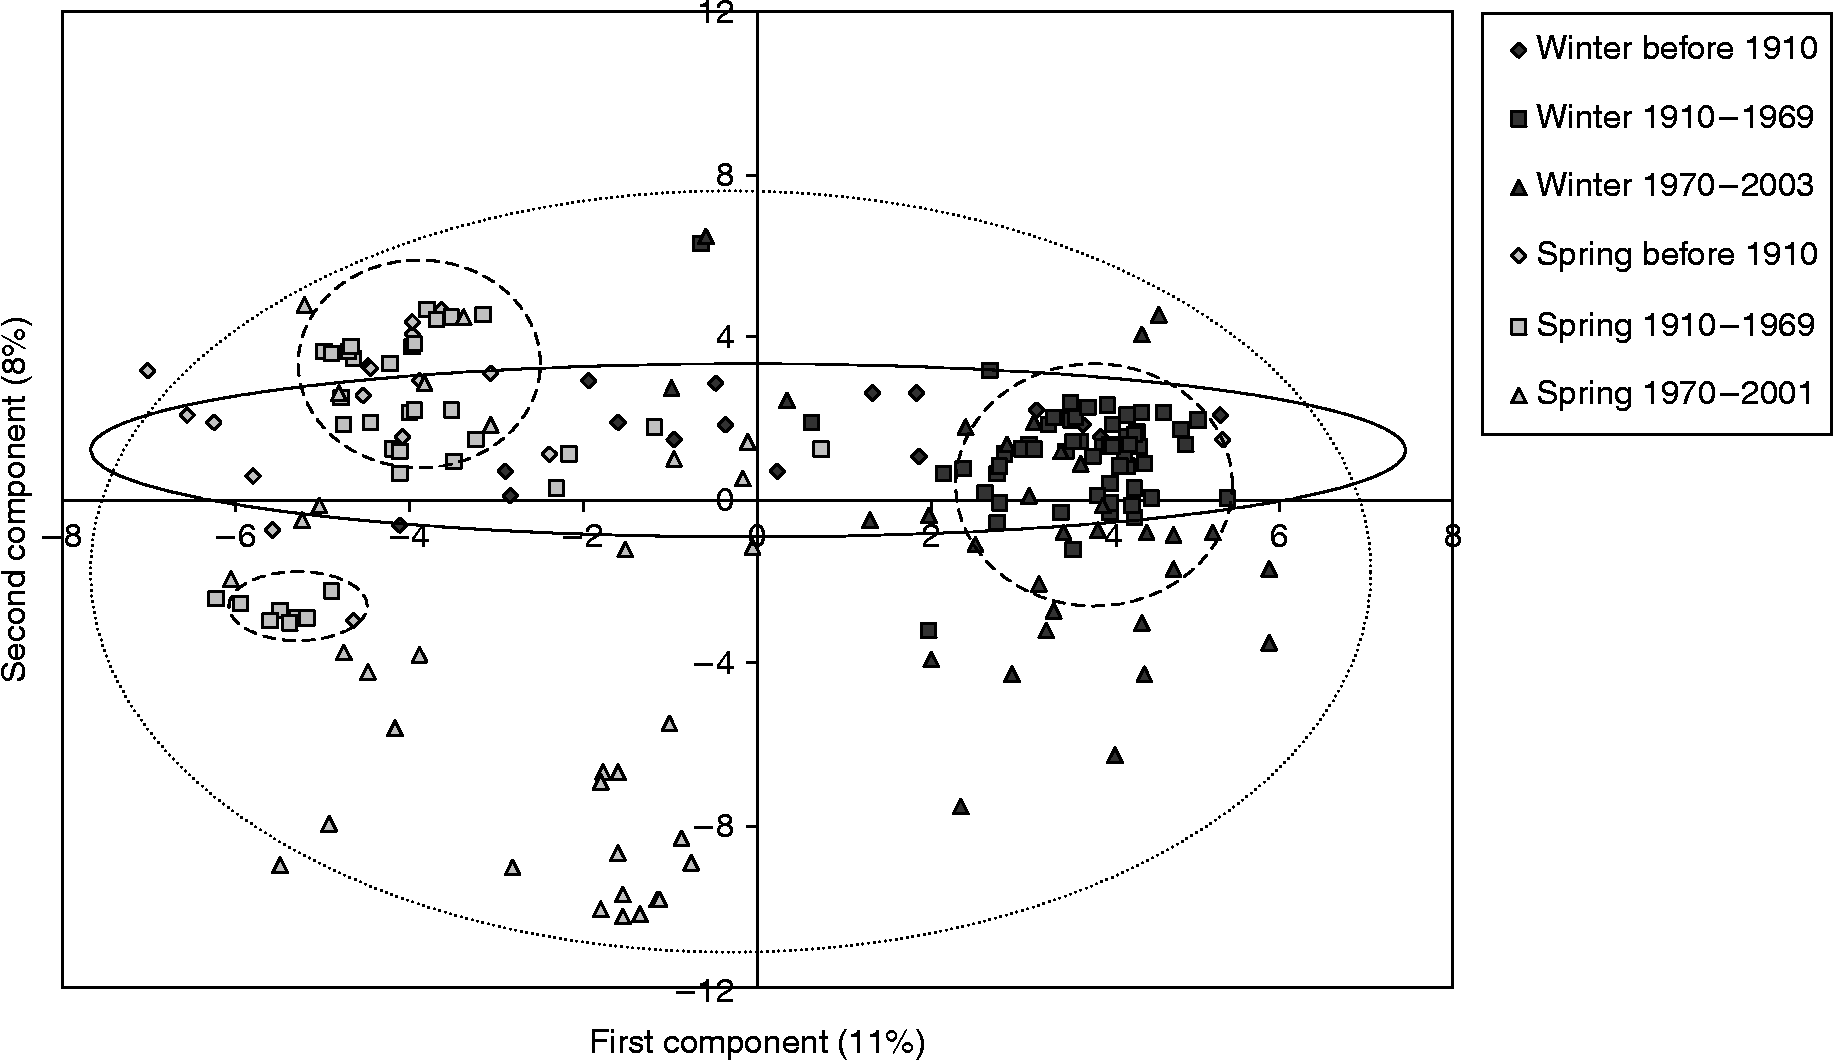
The principal coordinates analysis (PCoA) showed a clear separation between growth habits but not countries (Fig. 2). The first component explained only 11% of the variation and the second component 8% of the variation. Such a low explanatory power indicates that there has been a high turnover within the material. Observation of the PCoA diagram suggests that changes in the wheat germplasm can be grouped into three different time periods (before 1910, 1910–1969 and 1970–2003) for both winter and spring wheat (Fig. 2). The time periods seem to reflect a genetic shift from a horizontal distribution of genetic variation during the first time period, to a narrowing and clustering during the second period, and a subsequent horizontal and vertical broadening during the third period. These results are in agreement with the UPGMA dendrogram and the breeding history of wheat in the Nordic countries.
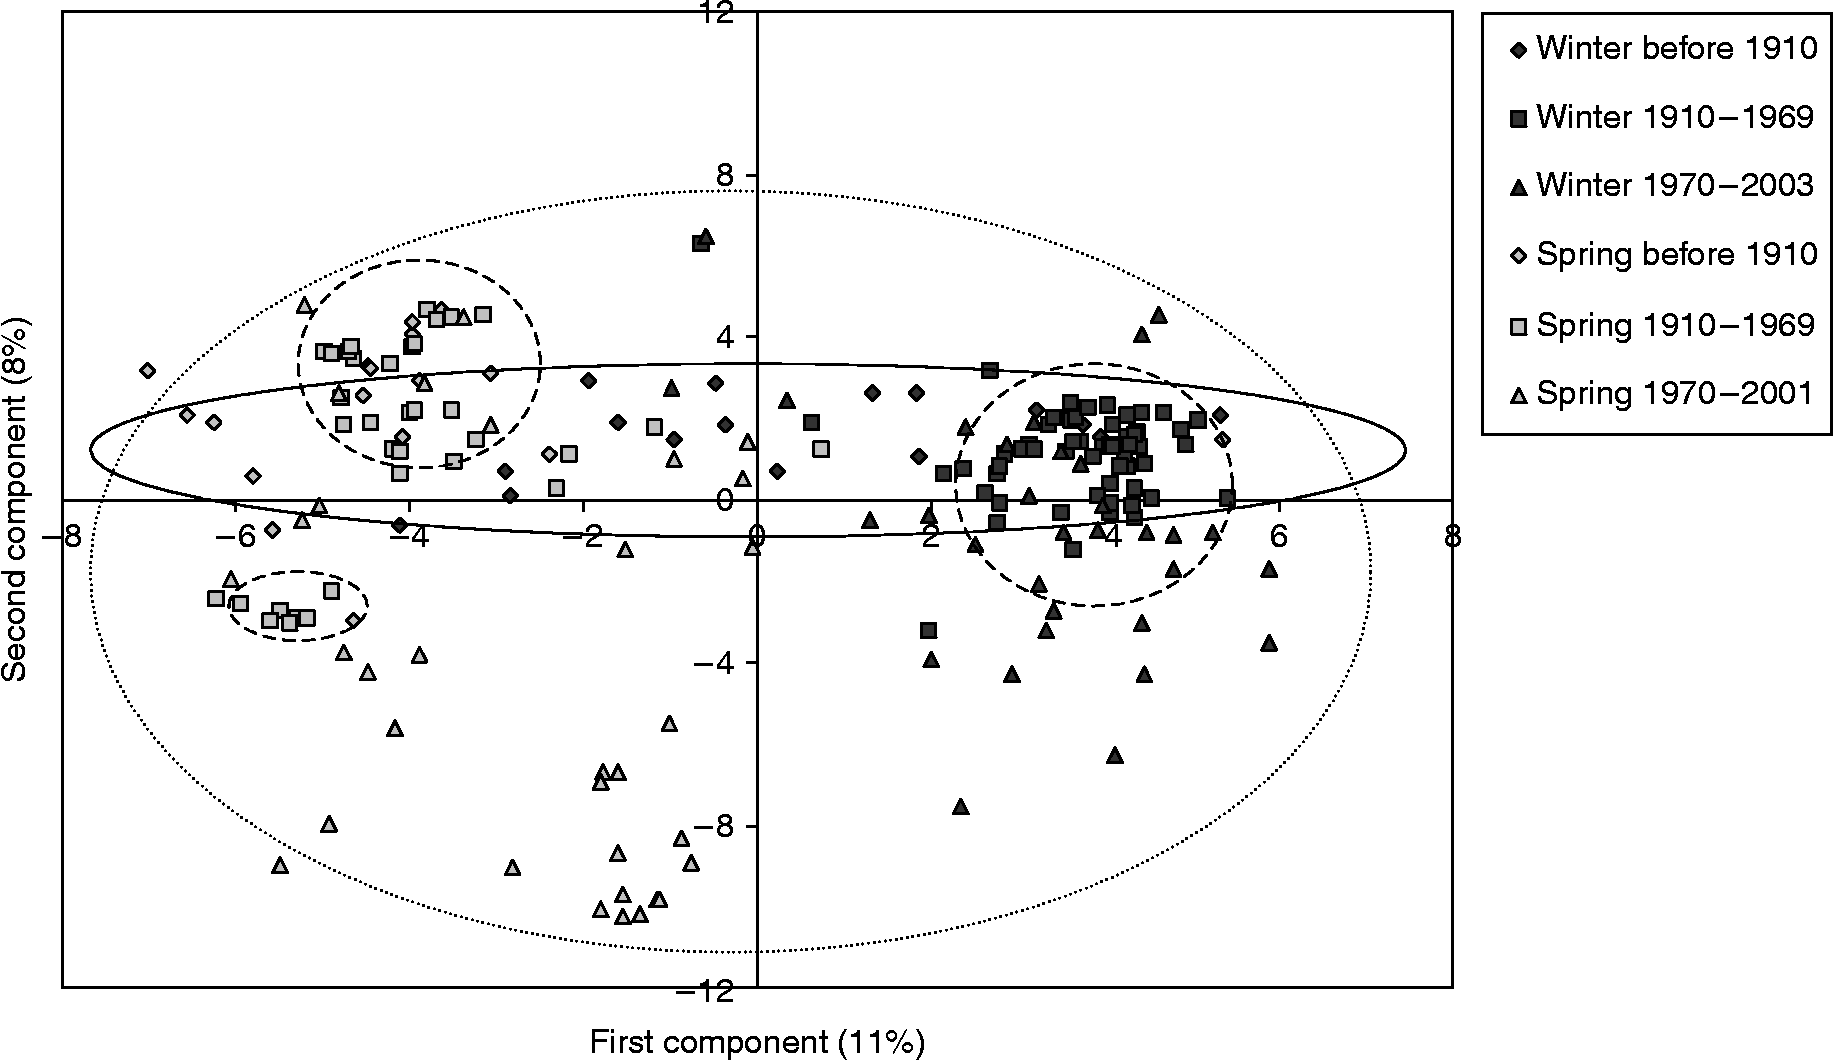
Fig. 2 PCoA of Nordic bread wheat showing the separation by growth habit and three time periods. Temporal groups are indicated by (1) solid line = before 1910, (2) dashed line = 1910–1969, (3) dotted line = 1970–2003.
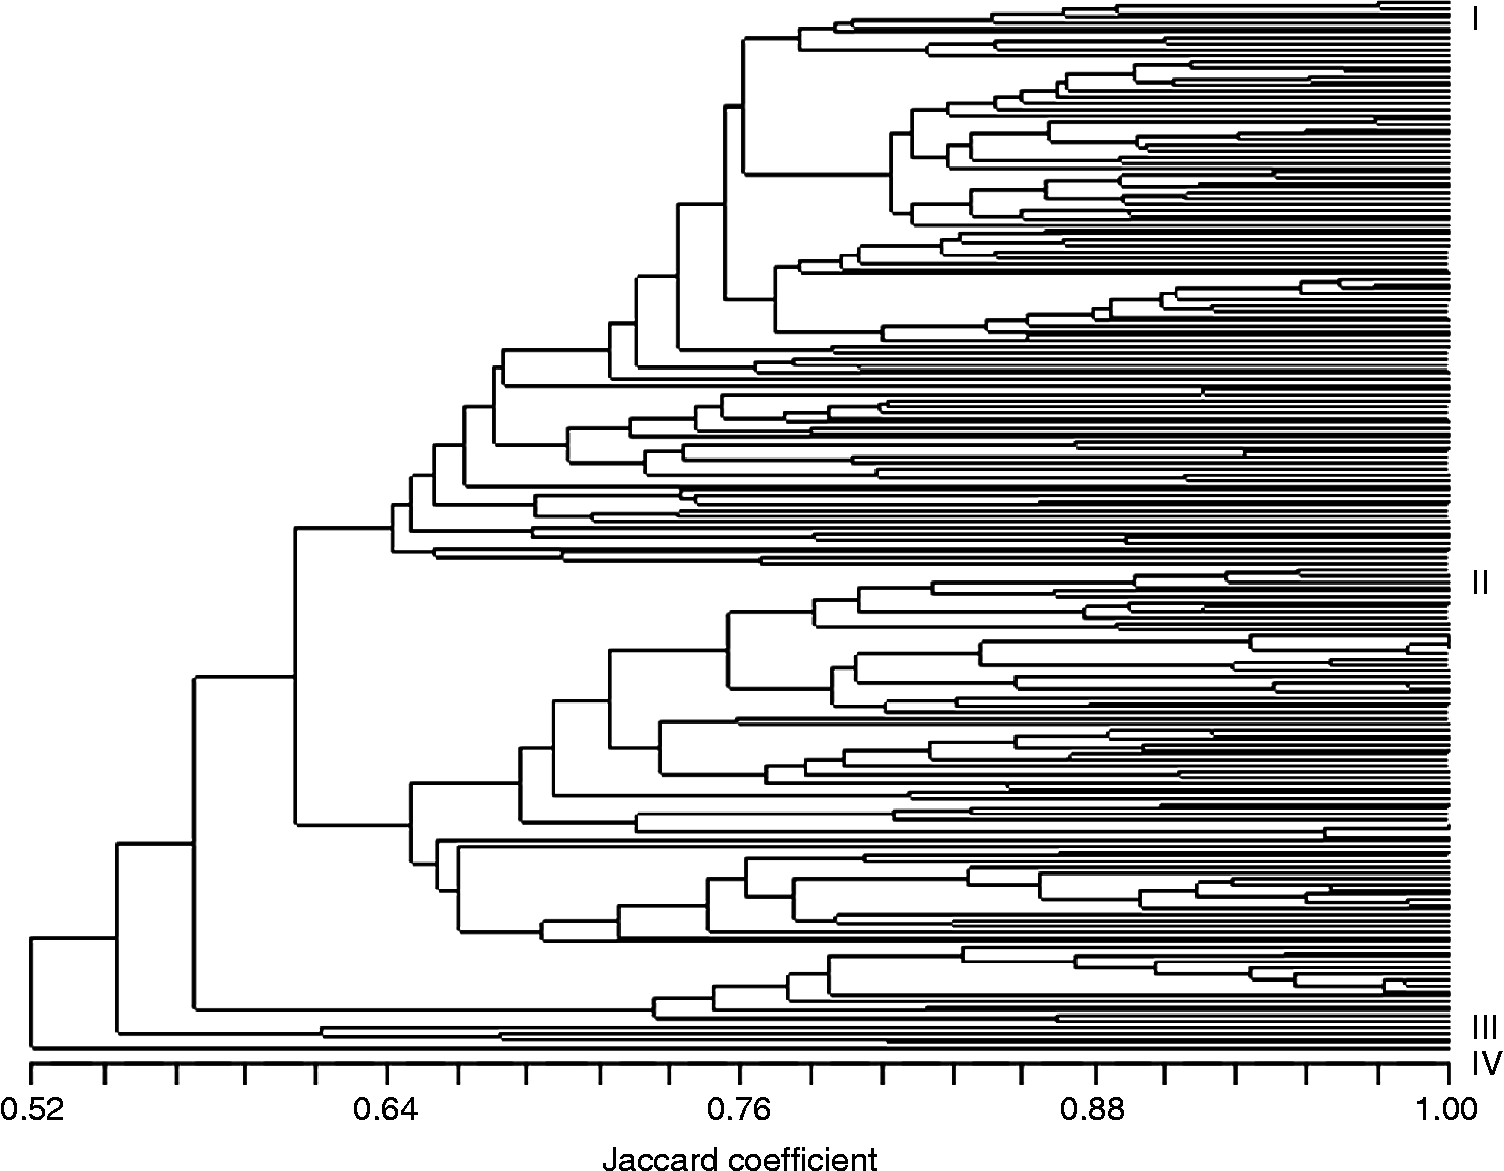
The dendrogram from the UPGMA cluster analysis (Fig. 3) also clearly showed an association between genetic relatedness and growth habit with few exceptions, namely the spring accessions ‘Hallandshvete’, ‘Brons’, ‘Safir’, ‘Lavett’-NGB and ‘Lavett’-SW that were located among the winter accessions. There was no clear clustering of accessions based on geographic origin and the results therefore likely reflect a frequent exchange of germplasm between the Nordic countries. A separate cluster consisted of the four winter cultivars ‘Sleipner’, ‘Tjelvar’, ‘Galicia’ and ‘Abika’, carrying the T1BL.1RS wheat–rye chromosome translocation. The presence of the translocation was verified by C-banding (Hysing, unpublished results 2005). One or several of 17 rare bands (present in less than 5% of the population) were observed in 27% of the material. Two bands were present only in the four cultivars that possess the T1BL.1RS translocation, and presumably correlated with the 1RS chromosome segment. The cultivars ‘Abika’, ‘Diamant II’ and landrace NGB-4496 possessed one unique band each.
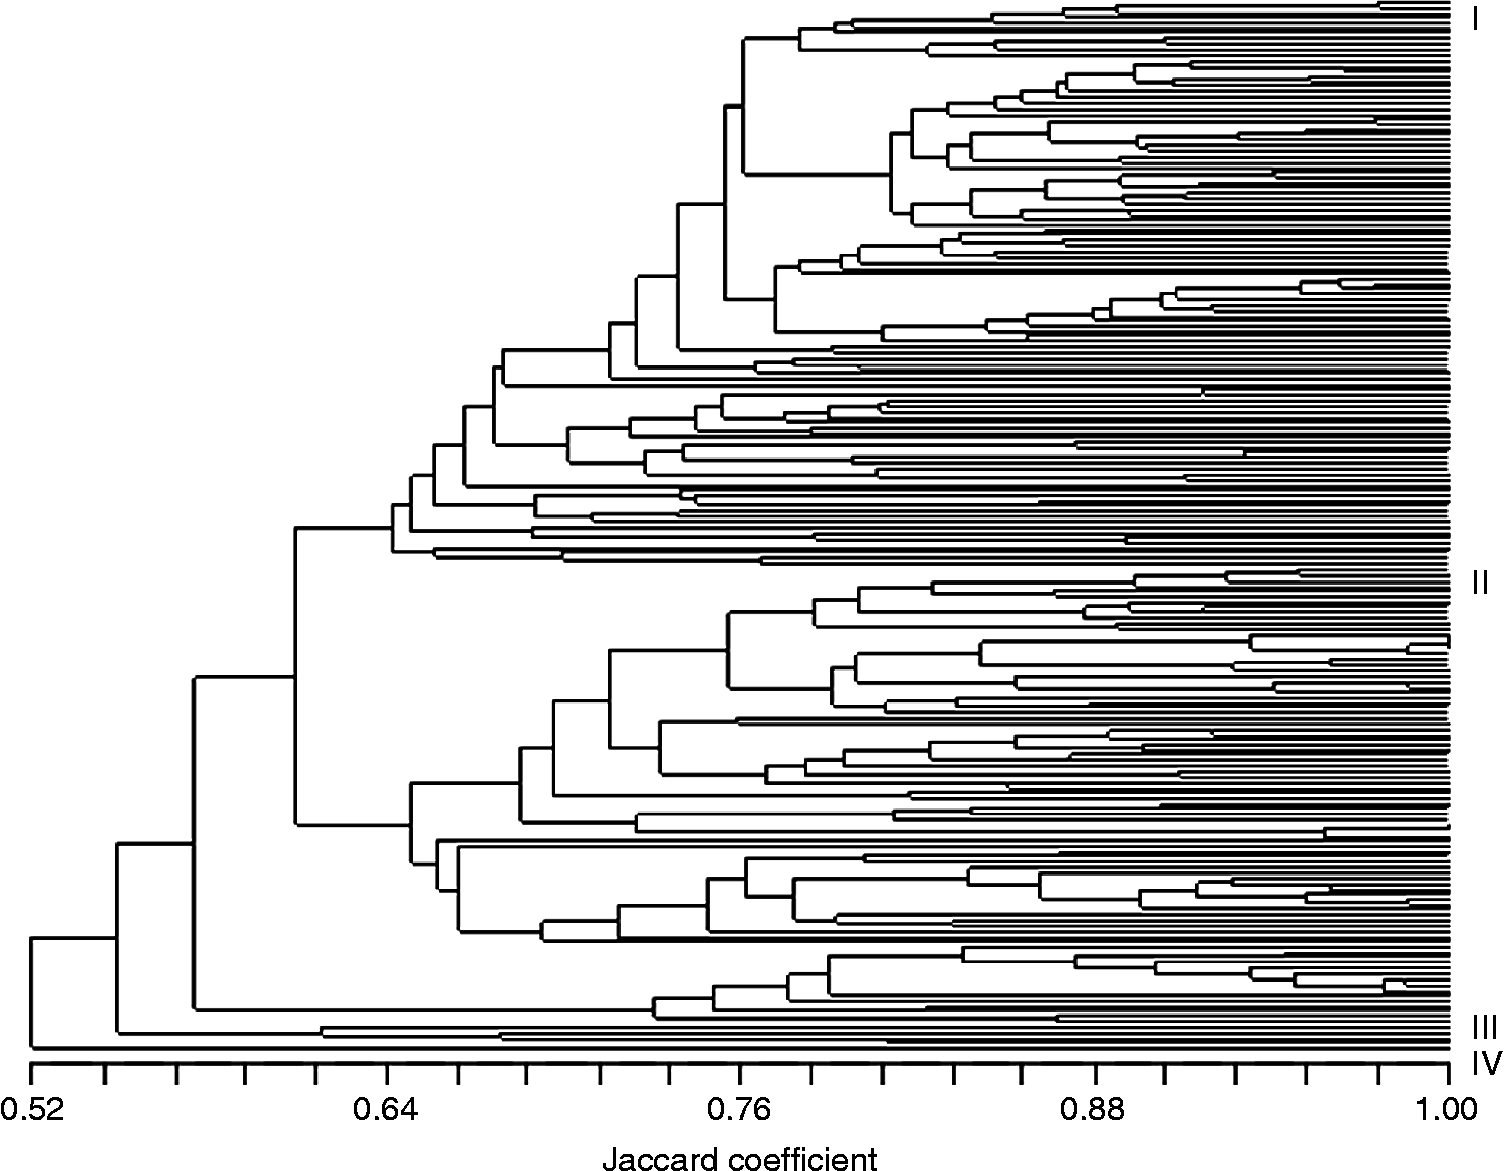
Fig. 3 UPGMA dendrogram based on S-SAP markers in Nordic bread wheat. I = winter wheat and spring wheat acc. ‘Hallandshvete’, ‘Brons’, ‘Safir’, ‘Lavett’-NGB, ‘Lavett’-SW; II = spring wheat; III = T1BL.1RS cvs ‘Sleipner’, ‘Tjelvar’, ‘Galicia’, ‘Abika’; IV = acc. NGB-4496 Landrace from Gotland.
The dendrogram was largely in agreement with available pedigree information (Table 1). Fingerprints generated by combinations of primer extensions could distinguish all accessions except two clusters of Finnish landraces (Horsmanaho, Tiimantii-Paavo and Järvenkylä; Jokikylä and Larinsaari). Presumably these accessions are very closely related or even genetically identical. This is in contrast to the two pairs of accessions from different germplasm collections: ‘Lavett’-NGB and ‘Lavett’-SW, and ‘Kimmo’-NGB and ‘Kimmo’-JIC that could be separated in spite of being supposedly the same cultivar. The accessions ‘Kimmo’-NGB and ‘Kimmo’-JIC clustered closer with other cultivars than with one another, and it could be questioned if these are indeed the same cultivar.
Selection of samples for ex situ core collection
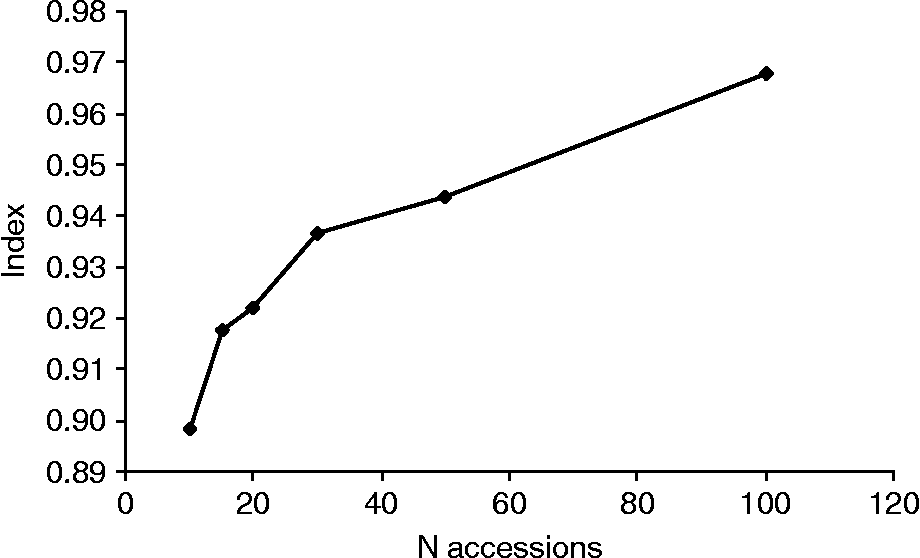
Potential core collections comprising 10–100 accessions (5–50%) were sampled from the material using the maximum diversity algorithm. The results showed that the mean index (I) describing the proportion of loci with both presence and absence of the allele, increased with increasing number of accessions in the collection. Based on the maximum diversity algorithm, a core collection comprising 15 accessions had an index of about 0.9. Thus 90% of the loci showed both presence and absence of alleles while 10% of the loci showed either presence or absence (Fig. 4).
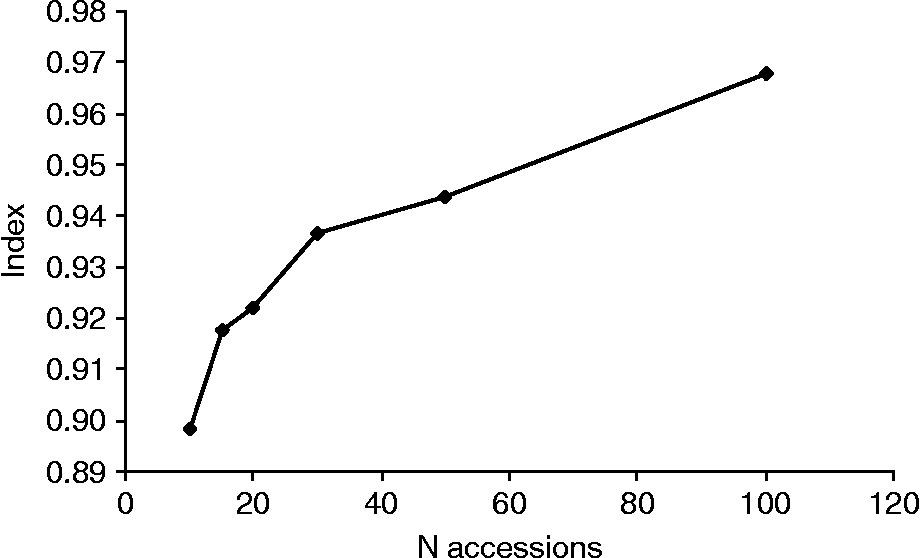
Fig. 4 Proportion of loci with both presence and absence of alleles in core collections of Nordic wheat based on N accessions.
Discussion
The present study utilized polymorphisms from the Sukkula-9900-LARD retrotransposon to study genetic diversity and relationships in wheat. Retrotransposon integration sites are stably inherited, and therefore integration sites shared between accessions are likely to have been present in their common ancestor(s). S-SAP based polymorphism may be the result of transpositional activity of retroelements, a restriction site polymorphism, or both (Soleimani et al., Reference Soleimani, Baum and Johnson2005).
This S-SAP-based retrotransposon study in 198 Nordic bread wheat accessions revealed several findings regarding the genetic relationships and diversity. The polymorphism patterns generated by the Sukkula-9900-LARD retrotransposon primer and four primer extensions allowed the discrimination of 97% of the accessions, showing that the primer was highly suitable for resolving closely related accessions. The five accessions that could not be separated based on the S-SAP polymorphisms may be identical. Soleimani et al. (Reference Soleimani, Baum and Johnson2005) detected intra-cultivar retrotransposon genetic heterogeneity (biotypes) in 84% of modern Canadian barley cultivars, and concluded that selection in inbreeding crops results in a heterogeneous population of homozygous plants. An analysis of banding patterns in families showed that the source of variation was likely due to residual variation from the parents and retrotransposon activity. In the present study, bulked samples from 30 seeds per accession were used to capture the intra-cultivar diversity. However, the UPGMA dendrogram (Fig. 3) showed that seven landrace accessions could not be separated, while duplicate accessions were placed in different clusters. Missing or incomplete passport data, and imprecise characterization have been identified as limiting factors in the use of landrace and cultivar ex situ collections (Dreisigacker et al., Reference Dreisigacker, Zhang, Warburton, Skovmand, Hoisington and Melchinger2005). In this respect, the retrotransposon S-SAP method could provide useful information for the description, optimization and use of accessions in seed-bank collections. However, as wheat is particularly suitable for seed storage, the conservation of accessions in perpetuity is currently more cost-effective than DNA fingerprinting and thus the identification and removal of suspected duplicates should not be a priority (Dreisigacker et al., Reference Dreisigacker, Zhang, Warburton, Skovmand, Hoisington and Melchinger2005).
During the evolution, domestication and breeding of wheat, genetic variation created by mutation has been reduced by genetic drift and selection, natural and that of early farmers, which eventually resulted in landraces adapted to specific conditions of their habitats (Reif et al., Reference Reif, Zhang, Dreisigacker, Warburton, van Ginkel, Hoisington, Bohn and Melchinger2005). It has been postulated that modern wheat cultivars, bred with a limited number of landraces in their pedigree, contain less genetic diversity than landraces (Frankel, Reference Frankel1970). Reduction in diversity caused by intensive selection could be counterbalanced by introgression of novel germplasm. An allelic reduction and genetic shift was detected by SSR markers in Canadian hard red spring wheat germplasm from 1845 to 2004 and partially related to different breeding efforts for stem rust resistance (Fu et al., Reference Fu, Peterson, Richards, Somers, DePauw and Clarke2005), for example. Reif et al. (Reference Reif, Zhang, Dreisigacker, Warburton, van Ginkel, Hoisington, Bohn and Melchinger2005) found a significant decrease in relative SSR gene diversity from Ae. tauschii accessions to landraces and modern wheat cultivars. The decrease in genetic diversity from 1950 to the late 1970s was ascribed to the ‘Early Green Revolution’ where breeding was characterized by the production of high-yielding semi-dwarf wheats that were based on a limited number of parents. There was also an increase in diversity after the late 1970s, explained by a change in breeding strategy aimed at increasing genetic diversity through the use of landraces, spring and winter wheat from different regions, and wild relatives of wheat.
In the present study, estimates of gene diversity, the PCoA results, and changes in band frequencies across time, together indicate that plant breeding has led to substantial genetic shifts in Nordic wheat. Genetic variation was reduced during the early 20th century, followed by a period of relatively lower genetic diversity, and a subsequent increase and net gain in diversity from the late 1960s onwards. These results are supported by the history of wheat breeding in the region. Plant breeding was initiated during the late 19th century in the Nordic countries and practised through mass and pure line selection in landraces. This was followed by pedigree selection until around the 1950s to 1960s, when breeding objectives and choice of germplasm changed to include exotic material. In Sweden around 1915, landraces were substituted by cultivars produced through pedigree selection that combined high-yielding Squarehead wheat with good winter hardiness from Swedish landraces. This breeding work was expanded to include quality aspects and continued until the 1950s, when there was an increased focus on, for example, resistance breeding against cereal rust diseases and powdery mildew, the use of distant relatives of wheat and mutation breeding (Lundin, Reference Lundin and Olsson1997; Olsson, Reference Olsson and Olsson1997; Svensson, Reference Svensson and Olsson1997). The decrease in gene diversity in Norway (Table 2) coincides with the period 1945 to 1965 when wheat production decreased because the old varieties were unsuitable for combine harvesting. The gene diversity increased after 1970, which is consistent with the initiation of a breeding programme in 1959 emphasizing resistance to sprouting, shattering, lodging and various diseases in combination with earliness and high yield and the introduction of semi-dwarf wheats during the late 1960s (Donner and Mesdag, Reference Donner and Mesdag2000). In a study of SSR genetic diversity in 75 Nordic spring wheat cultivars, Christiansen et al. (Reference Christiansen, Andersen and Ortiz2002) found a general distinction between accessions from different countries and time periods. There was an increase in genetic diversity from 1900 to 1940 followed by a period of genetic loss from 1940 to 1960, and a subsequent increase from 1960 onwards. Our results are in agreement with those of other marker-based studies of diversity changes in wheat, where a general loss of genetic diversity has been found to be negligible, but narrowing has been observed during some periods of time and significant allele loss has occurred at specific loci (Donini et al., Reference Donini, Law, Koebner and Reeves2000; Christiansen et al., Reference Christiansen, Andersen and Ortiz2002; Koebner et al., Reference Koebner, Donini, Reeves, Cooke and Law2003; Roussel et al., Reference Roussel, Koenig, Beckert and Balfourier2004, Reference Roussel, Leisova, Exbrayat, Stehno and Balfourier2005; Landjeva et al., Reference Landjeva, Korzun and Ganeva2005).
To facilitate the conservation, evaluation, management and efficient utilization of plant genetic collections, Frankel (Reference Frankel, Arber, Illmensee, Peacock and Starlinger1984) put forward the concept of the ‘core collection’ with a limited size, maximized genetic diversity and a minimum of repetitions. Opinions regarding the relative sizes of the total and core collections differ. Brown and co-workers (Reference Brown, Grace and Speer1987) recommended that the number of accessions in the core collection should account for 5–10% of the accessions and at least 70% of the genetic variation in the base collection, while van Hintum et al. (Reference van Hintum, Brown, Spillane and Hodgkin2000) suggested 10–20% of accessions to represent 70–90% of the genetic diversity in the base collection, depending on the objective of the core collection. Hao et al. (Reference Hao, Zhang, Wang, Dong, Shang and Jia2006) found that sampling 13% of a wheat base collection was sufficient for retaining 98.5% of the SSR alleles. In the present study, it was found that a core collection comprising only 15 accessions selected by a maximum diversity algorithm program (Marita et al., Reference Marita, Rodriguez and Nienhuis2000) would have both presence and absence of alleles at 90% of the loci, but all alleles would not be represented at the remaining 10% of the loci.
Different retrotransposons in wheat and barley have been shown to have different transpositional activity (Gribbon et al., 1999; Shirasu et al., Reference Shirasu, Schulman, Lahaye and Schulze-Lefert2000; Leigh et al., Reference Leigh, Kalendar, Lea, Lee, Donini and Schulman2003; Queen et al., Reference Queen, Gribbon, James, Jack and Flavell2004). The overall resolution of the genetic structure revealed by the Sukkula-9900-LARD retrotransposon could be improved further by analysing the population with a variety of retrotransposons that show differing transposition histories or a combination of different molecular markers. Association studies using the combination of molecular marker data and phenotypic data could yield potentially useful information on alleles at loci of interest (Dreisigacker et al., Reference Dreisigacker, Zhang, Warburton, Skovmand, Hoisington and Melchinger2005). S-SAP markers based on BARE-1/Wis-2-1A barley retrotransposons were found to be broadly distributed among all wheat chromosomes and on a wheat restriction fragment length polymorphism (RFLP) linkage map (Queen et al., Reference Queen, Gribbon, James, Jack and Flavell2004) although a tendency for S-SAP markers to cluster has been observed for several retrotransposon primers, including Sukkula (Rodriguez et al., Reference Rodriguez, O'Sullivan, Donini, Papa, Chiapparino, Leigh and Attene2006). The S-SAP markers used in this study were not mapped and therefore no conclusions can be made regarding their genomic location and possible linkage to agronomically significant traits. However, the results of the PCoA and UPGMA dendrogram showed that at least some of these markers could potentially be linked to agronomic traits, e.g. growth habit and the presence of the rye chromosome segment 1RS. To maximize the utility of gene bank germplasm for breeding purposes, it is essential to characterize the material for agronomically important traits and resistance to abiotic and biotic stresses.
Wheat breeding aims to improve cultivars through crossings and selections of the genetic diversity available in the gene pools of wheat and ultimately the production of new useful allele combinations. In conclusion, the results of the present study show that the retrotransposon Sukkula-9900-LARD is highly suitable for S-SAP diversity studies in wheat; and that the extent and nature of genetic variation in Nordic bread wheat is heavily affected by plant breeding strategies, which may have implications for future wheat breeding and for the conservation of wheat genetic resources.
Acknowledgements
Financial support from The Swedish Research Council for Environment, Agricultural Sciences and Spatial Planning (FORMAS), and The European Commission Marie Curie Training Site Fellowship is gratefully acknowledged. Seed was kindly donated by the Nordic Gene Bank, the John Innes Centre, Svalöf-Weibull AB, Abed Fonden and Pajbjerg Fonden.


