


Introduction
Groundnut (Arachis hypogaea L.), also known as peanut, is one of the most important oilseed crops in the world. It is grown extensively in the Americas, Africa and Asia with a total annual global area of nearly 24 million hectares yielding 33.5 million tonnes. Around 53% of the global production is crushed for edible oil, 32% for confectionery consumption and the remaining 15% is used for feed and seed production. Cultivated groundnut consists of two subspecies, hypogaea and fastigiata, which are further classified into six botanical varieties largely based on growth habit, flowering and branching patterns, presence of hairs on leaf surfaces and numbers of seeds per pod (Krapovickas and Gregory, Reference Krapovickas and Gregory1994) and with lesser support by protein and genomic analysis (Smartt and Simmonds, Reference Smartt and Simmonds1995), with a number of recent genomic studies refuting this classification (He and Prakash, Reference He and Prakash2001; Raina et al., Reference Raina, Kojima, Ogihara, Singh and Devarumath2001; Ferguson et al., Reference Ferguson, Bramel and Chandra2004a; He et al., Reference He, Meng, Gao, Guo, Gao, Newman, Pittman and Prakash2005; Tallury et al., Reference Tallury, Hilu, Milla, Friend, Alsaghir, Stalker and Quandt2005). Botanical varieties hypogaea (Virginia) and hirsuta (Peruvian) are currently classified under subsp. hypogaea while varieties fastigiata (Valencia), peruviana, aequatoriana and vulgaris (Spanish) are assigned within subsp. fastigiata.
Bacterial wilt (BW), caused by Ralstonia solanacearum E. F. Smith, is a major biotic factor affecting groundnut production particularly in South-East Asia and East Africa (Hayward, Reference Hayward1990). It also infects many other crop plants including potato (Solanum tuberosum L.), tomato (Lycopersicon esculentum Mill), tobacco (Nicotiana spp.), pepper (Capsicum spp.), eggplant (Solanum melongina L.) and ginger (Zingiber officinale Rosc.). The bacterial species have been isolated and classified into five races based on host range (Buddenhagen and Kelman, Reference Buddenhagen and Kelman1964; He et al., Reference He, Sequeria and Kelman1983) and five biovars based on biochemical characteristics (Hayward, Reference Hayward1964; He et al., Reference He, Sequeria and Kelman1983). Race 1 causes wilt in groundnut, in addition to many other leguminous and solanaceous plants. Biovar 1 causes wilt in groundnut and predominantly occurs in America, whereas Biovars 3 and 4 cause wilt of groundnut in Asia and Africa (Hayward, Reference Hayward1991).
Extensive screening of groundnut germplasm, largely based on field evaluations at disease ‘hot-spots’ in Indonesia and China, has resulted in the identification of many BW-resistant lines. Most of these sources of BW resistance originate from China or Indonesia. Up to a quarter of germplasm accessions have shown some level of resistance to BW (Singh et al., Reference Singh, Mehan and Nigam1997; Pande et al., Reference Pande, Liao, Hong, Johansen and Gowda1998); resistance has been identified across different botanical types and also in some wild species. Despite the broad range of BW-resistant donor genotypes, only a few of the resistant landraces have been successfully used in breeding in China and Indonesia (Liao et al., Reference Liao, Duan, Jiang, Liang, Gao, Pande, Liao, Hong, Johansen and Gowda1998). The majority of BW-resistant cultivars released in China were derived from just three sources (Xiekangqing, Taishan Sanlirou or Taishan Zhenzhu) (Liang, Reference Liang, Pande, Liao, Hong, Johansen and Gowda1998; Liao et al., Reference Liao, Duan, Jiang, Liang, Gao, Pande, Liao, Hong, Johansen and Gowda1998), while a single resistance donor source (Schwartz 21) has been the basis of the majority of cultivars released in Indonesia. Thus, there is a progressive narrowing of genetic diversity in BW-resistant breeding programmes that creates a major risk for groundnut production should the pathogen overcome these sources of resistance. In addition, the currently available BW-resistant cultivars are low yielding and have poor tolerance to drought. Identification and utilization of a broad spectrum of genetically diverse sources of BW resistance is, therefore, critical for the development of a new generation of broad-based high-yielding BW-resistant groundnut cultivars. Limited knowledge about the genetic diversity of the BW-resistant germplasm and deleterious linkage drag have impeded the utilization of a wide spectrum of BW resistance donors.
Diversity studies in groundnut have generally revealed extensive phenotypic variation amongst varieties (Upadhyaya et al., Reference Upadhyaya, Ferguson and Bramel2001, Reference Upadhyaya, Ortiz, Bramel and Singh2003) yet limited variation at the molecular level (Halward et al., Reference Halward, Stalker, Larue and Kochert1991, Reference Halward, Stalker, Larue and Kochert1992; Kochert et al., Reference Kochert, Halward, Branch and Simpson1991, Paik-Rao et al., Reference Paik-Rao, Smith and Knauft1992; He and Prakash, Reference He and Prakash1997; Subramanian et al., Reference Subramanian, Gurtu, Nageswara Rao and Nigam2000; Moretzsohn et al., Reference Moretzsohn, Hopkins, Mitchell, Kresovich, Valls and Ferreira2004). It is hypothesized that this may be due to the selective neutrality of the molecular markers utilized, while phenotypic traits have been subjected to intense selection (He and Prakash, Reference He and Prakash1997). It has also been suggested that the lack of molecular polymorphism revealed to date within the cultivated groundnut gene pool could be due to the inadequacy of the material studied and the range of techniques used (Singh et al., Reference Singh, Smartt, Simpson and Raina1998).
Microsatellite markers, also known as simple sequence repeat (SSR) markers, have been reported to detect high levels of polymorphism even amongst closely related cultivated germplasm (Gianfranceschi et al., Reference Gianfranceschi, Seglias, Tarchini, Komjanc and Gessler1998). For this reason, considerable efforts have been recently made to develop a large number of SSR markers in groundnut (Hopkins et al., Reference Hopkins, Casa, Wang, Mitchell, Dean, Kochert and Kresovich1999; He et al., Reference He, Meng, Newman, Gao, Pittman and Prakash2003, Reference He, Meng, Gao, Guo, Gao, Newman, Pittman and Prakash2005; Ferguson et al., Reference Ferguson, Burow, Schultz, Bramel, Paterson, Kresovich and Mitchell2004b; Moretzsohn et al., Reference Moretzsohn, Hopkins, Mitchell, Kresovich, Valls and Ferreira2004, Reference Moretzsohn, Leoi, Proite, Guimãres, Leal-Bertioli, Gimenes, Martins, Valls, Grattapaglia and Bertoli2005). It has been demonstrated in previous studies that SSR markers are more variable within genomes than other marker types (e.g. Belaj et al., Reference Belaj, Satovic, Cipriani, Baldoni, Testolin, Rallo and Trujillo2003). Additionally, SSRs have the advantage of being co-dominant, only requiring very small amounts of DNA and hence have been widely applied in many plant genetics studies, e.g. for evaluating genetic diversity (Zhebentyayaeva et al., Reference Zhebentyayaeva, Reighard, Gorina and Abbott2003; Fahima et al., Reference Fahima, Röder, Grama and Nevo1998), genome mapping and gene tagging, e.g. in rice (Chen et al., Reference Chen, Temnykh, Xu, Cho and McCouch1997), wheat (Röder et al., Reference Röder, Korzun, Wendehake, Plaschke, Tixier, Leroy and Ganal1998), barley (e.g. Künzel and Waugh, Reference Künzel and Waugh2002) and tomato (Broun and Tanksley, Reference Broun and Tanksley1996). The recent development of groundnut-specific SSRs (Hopkins et al., Reference Hopkins, Casa, Wang, Mitchell, Dean, Kochert and Kresovich1999; He et al., Reference He, Meng, Newman, Gao, Pittman and Prakash2003, Reference He, Meng, Gao, Guo, Gao, Newman, Pittman and Prakash2005; Ferguson et al., Reference Ferguson, Burow, Schultz, Bramel, Paterson, Kresovich and Mitchell2004b; Moretzsohn et al., Reference Moretzsohn, Hopkins, Mitchell, Kresovich, Valls and Ferreira2004, Reference Moretzsohn, Leoi, Proite, Guimãres, Leal-Bertioli, Gimenes, Martins, Valls, Grattapaglia and Bertoli2005) now offers new and exciting opportunities for groundnut genomics.
In the present study we have used groundnut-specific SSRs to analyse a diverse range of cultivated groundnut accessions encompassing all six botanical varieties. The purpose of this study was to investigate the level of molecular polymorphism amongst BW-resistant accessions and to compare this with the genetic diversity across the cultivated A. hypogaea gene pool. This analysis is important for the selection of genetically diverse parental genotypes for mapping populations and BW resistance breeding programmes aimed at the development of broad-based cultivars with durable disease resistance.
Materials and methods
Plant material and DNA extraction
Thirty-one groundnut genotypes from the Oil Crops Research Institute (OCRI) of the Chinese Academy of Agricultural Sciences (CAAS) and 15 genotypes from the International Crops Research Institute for the Semi-Arid Tropics (ICRISAT), consisting of landraces, released cultivars and intraspecific derivatives representing all six varieties of A. hypogaea, were selected for the present study (Table 1).
Table 1 Groundnut genotypes included in the current study with different levels of resistance (R) and susceptibility (S) to bacterial wilt (BW) (botanical variety and geographic origin also indicated)

Total genomic DNA was extracted using a CTAB-based procedure reported previously, with 3% (v/v) β-mercaptoethanol in a 3% (w/v) CTAB buffer (Mace et al., Reference Mace, Buhariwalla and Crouch2003). The quantity and quality of DNA were determined electrophoretically through comparison with known concentrations of uncut λ DNA standards and spectrophotometric analysis at 260/280 nm, and subsequently diluted to 5 ng/μl.
SSR amplification
Thirty-two SSR markers were assayed for their ability to detect polymorphism among the 46 cultivated groundnut accessions selected (Table 2). The 32 SSRs were selected on the basis of prescreening approximately 200 groundnut SSRs, based on the level of polymorphism revealed between BW-resistant and -susceptible genotypes and the reliability and quality of amplicon detection.
Table 2 Details of SSRs used in the groundnut diversity analysis (SSRs were developed by Ferguson et al., Reference Ferguson, Bramel and Chandra2004a unless indicated otherwise)

a Microsatellites developed by Hopkins et al. (Reference Hopkins, Casa, Wang, Mitchell, Dean, Kochert and Kresovich1999).
b Microsatellites developed by Moretzsohn et al. (Reference Moretzsohn, Hopkins, Mitchell, Kresovich, Valls and Ferreira2004).
PCR reactions were conducted in 20 μl volumes using a GeneAmp PCR System 9700 (Applied Biosystems). The PCR reaction mixtures contained between 5 and 15 ng of genomic DNA, 10–30 pmol of each primer, 100–125 μM of dNTP, 0.6–1.2 U/μl of Taq DNA polymerase (Amersham), 1 × PCR buffer (10 mM Tris–HCl pH 8.3, 50 mM KCl) and 0.5–2.5 mM MgCl2.
The fixed-temperature PCR programmes consisted of an initial denaturation step for 2 min at 94°C, followed by 35 cycles of denaturation for 45 s (94°C), annealing for 1 min (57–64°C; see Table 2) and extension for 1 min 30 s (72°C). The PCR products were then incubated at 72°C for a further 10 min to ensure complete extension. A second PCR programme using the touchdown approach was also used for selected SSRs (see Table 2) with the following conditions: initial denaturation for 2 min at 94°C, followed by 10 cycles: 94°C for 45 s, 65°C ( − 1°C/cycle) for 1 min and 72°C for 1 min 30 s. This was then followed by 20 cycles of 94°C for 45 s, 55°C for 1 min and 72°C for 1 min 30 s, followed by a final extension step of 10 min (72°C).
Electrophoresis and data collection
PCR amplification products were separated on 6% non-denaturing polyacrylamide gels and revealed using a silver staining procedure based on ammoniacal solutions of silver, modified from Kolodny (Reference Kolodny1984). The size of the allele scored was determined through comparison with the 100 bp DNA ladder (Amersham) included on all gels. Estimates of similarity were based on two different measurements: (1) Nei and Li's (Reference Nei and Li1979) definition of similarity: Sij = 2a/(2a+b+c), where Sij is the similarity between two individuals, i and j, a is the number of bands present both in i and j, b is the number of bands present in i and absent in j, and c is the number of bands absent in i and present in j; (2) Jaccard's coefficient (Jaccard, Reference Jaccard1908): Sij = a/(a+b+c). The similarity matrices were then analysed using the clustering method UPGMA (unweighted pair group method; Sokal and Michener, Reference Sokal and Michener1958) using the NTSYS 2.1 software (Rohlf, Reference Rohlf2001). The dendrograms were created with the tree program of NTSYS, and the goodness of fit of the clustering to the data was calculated using the COPH and MXCOMP program. Multidimensional scaling (MDS) (Kruskal and Wish, Reference Kruskal and Wish1978) was also performed to confirm whether the observed molecular variation indicated evidence of clustering among accessions, as compared to the clustering by UPGMA.
An analysis of molecular variance (AMOVA) was undertaken to partition genetic variability using Arlequin software version 2.0 (Schneider et al., Reference Schneider, Roessli and Excoffier2000), and significance values assigned to variance components based on the random permutation (10,000 times) of individuals assuming no genetic structure. Additionally, the gene diversity (GD) of each SSR was determined as described by Weir (Reference Weir1990).  where P i is the frequency of the ith allele in the examined genotypes.
Results
All 32 SSRs successfully generated at least one allele in the region of the expected size in all 46 cultivated groundnut genotypes (Fig. 1; Table 2). A total of 107 alleles were observed following amplification of 29 polymorphic and three monomorphic (pPGPseq-13B06, pPGPseq-3D09 and A1-275) SSR loci, of which 101 (99.4%) were polymorphic. The total number of alleles revealed per polymorphic SSR locus ranged from two (pPGPseq-1B09) to 10 (pPGPseq-7H6) with an average of 3.34 alleles per locus. The observed allele sizes ranged from 131 bp (pPGPseq-8D9) to 531 bp (A1-193). The GD scores of the 29 polymorphic SSR loci ranged from 0.103 (pPGPseq-13E9) to 0.669 (pPGPseq-3A08) (Table 2).

Fig. 1 Polymorphism detected by SSR pPGPseq-8E12 across 46 cultivated groundnut genotypes.
Genetic diversity analysis of cultivated groundnut germplasm
Groundnut is a complex polyploid with two distinct genomes that largely segregate in isolation and is, therefore, termed an amphidiploid (Burow et al., Reference Burow, Simpson, Starr and Paterson2001). This has significant implications in the appropriate choice of biometric analysis. In particular, SSRs may not always retain their codominant nature as defining allelic relationships becomes difficult when three or more alleles are detected in a single individual, however, this does not occur in any of the polymorphic loci scored in this study, with the exception of A1-275. For this reason cluster analysis was undertaken based on two different similarity measures: Jaccard (for dominant datasets) and Dice/Nei and Li (for codominant datasets). The correlation coefficients were broadly similar from both Jaccard's similarity coefficient (r = 0.89) and Nei and Li's similarity coefficient (r = 0.87). Figure 2 shows the dendrogram produced by Jaccard's similarity coefficient using the UPGMA clustering method, with clear evidence of two separate clusters (A and B) at a level of approximately 36% similarity. The presence of two primary clusters within the data set was also confirmed through MDS (Fig. 3), where clusters A and B appear clearly separated on two axes. The 46 genotypes were all uniquely identified based on the 32 SSR loci, with the exception of Feilongxiang and Shitang Dahuashe, both botanical variety hirsuta, resistant to bacterial wilt. Of the 46 genotypes, seven exhibit susceptibility to bacterial wilt, 32 show resistance and the response of the remaining seven genotypes to bacterial wilt is unknown. The two subspecies of A. hypogaea are equally represented with 23 genotypes belonging to subsp. hypogaea (17 to variety hirsuta and six to variety hypogaea) and 23 genotypes belonging to subsp. fastigiata (17 to variety vulgaris and two representatives each of varieties fastigiata, peruviana and aequatoriana). The 46 genotypes group into two separate clusters; cluster A containing 19 genotypes, 18 of which belong to subsp. fastigiata, and cluster B containing 27 genotypes, 22 of which belong to subsp. hypogaea. The 19 genotypes in cluster A include 15 accessions of variety vulgaris, two of variety fastigiata and two germplasm lines (Chico and ICG15222-2). Three subclusters could be further identified within cluster A at a level of 45% similarity. The first subcluster, A(I), contained genotypes belonging to only variety vulgaris and the line ICG15222-2, which were all resistant to BW. The second subcluster, A(II), consisted predominately of variety vulgaris genotypes, with the exception of one accession belonging to variety fastigiata (Taishan Sanlirou) and one variety aequatoriana accession (ICG12722); of these, six were resistant and four susceptible to BW. The third subcluster, A(III), consisted of two accessions susceptible to BW; an accession belonging to variety fastigiata (Gangapuri) and a germplasm line.

Fig. 2 Dendrogram constructed using Jaccard's similarity coefficient and UPGMA clustering, for the 46 groundnut genotypes. Two main clusters (A and B) and subclusters are identified.

Fig. 3 Multidimensional scaling (MDS) analysis of SSR data across 46 cultivated groundnut genotypes with varying levels of resistance to bacterial wilt with two clusters of genotypes indicated as ‘A’ and ‘B’, corresponding to clusters identified in Fig. 2.
Cluster B contained 27 accessions representing five botanical varieties, with botanical variety fastigiata unrepresented. Three subclusters could be identified within cluster B, at the level of 42% similarity. The first subcluster, B(I), consisted of 21 genotypes in total, the majority (15) belonging to variety hirsuta, and all resistant to bacterial wilt with the exception of Zao 18 (variety vulgaris). The second subcluster, B(II), consisted of five landraces originating from South and Central America, including variety hirsuta, but surprisingly also including variety peruviana and variety aequatoriana. The third subcluster, B(III), consisted of only one genotype, Zhonghua No. 5, belonging to variety vulgaris which is susceptible to BW.
Overall there was a clear distinction between the BW-resistant lines belonging to subsp. fastigiata (cluster A) and the BW-resistant lines of subsp. hypogaea (cluster B). However, not all the accessions susceptible to BW followed this pattern; the two BW-susceptible variety vulgaris accessions belonging to A. hypogaea subsp. fastigiata clustered instead with the A. hypogaea subsp. hypogaea genotypes in cluster B.
AMOVA was performed on the data set in order to partition the total genetic variation within and between three parameters: (i) within and between resistant and susceptible types, (ii) within and between botanical variety, and (iii) within and between country of origin. The AMOVA revealed that only 15% of the total variation observed was accounted for between BW resistance and susceptible types, whereas the majority of variation (85%) was observed within each disease response group (Table 3A). In contrast, upon partitioning the total genetic variation between and within the botanical varieties (Table 3B), 50% of the total variation was accounted for between the different botanical varieties, indicating a clear differentiation based on botanical variety compared to BW response groups. Finally, 86% of the variation was accounted for within the 11 different countries of origin of the genotypes included in this study, rather than between the countries of origin.
Table 3 AMOVA (Excoffier et al., Reference Excoffier, Smouse and Quattro1992) for (A) 39 genotypes of two disease response types, bacterial wilt-resistant and -susceptible, employing 107 SSR alleles; and for (B) 46 genotypes in six botanical varieties employing 107 microsatellite alleles (nested analysis was carried out on populations grouped as above)
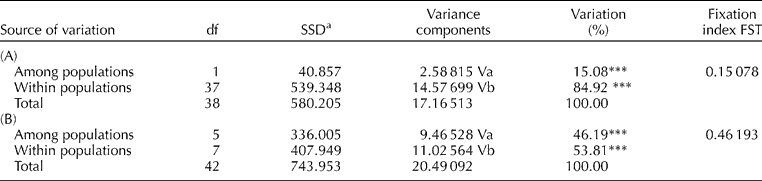
a Sum of squared deviations.
Putative association of SSR loci with BW resistance
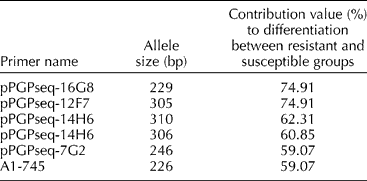
A locus-by-locus AMOVA was performed to calculate the contribution of each locus to the differentiation of resistant and susceptible groups within the germplasm tested. Six of the 107 alleles (Table 4) were found to contribute significantly to the differentiation between the BW-resistant and -susceptible genotypes. Furthermore, markers pPGPseq-16G8 (size: 229 bp) and pPGPseq-12F7 (size: 305 bp) contributed 74.91% of the total genetic difference between the two disease-response groups.
Table 4 List of alleles putatively linked with bacterial wilt resistance as determined through locus-by-locus AMOVA
Discussion
SSRs have proven to be powerful tools for the detection of molecular genetic diversity amongst the cultivated groundnut germplasm included in this study, representing all six botanical varieties within the A. hypogaea gene pool. A clear distinction was observed between the two subspecies, subsp. hypogaea and subsp. fastigiata. Accessions of var. hypogaea and hirsuta (subsp. hypogaea) grouped together in cluster B (Fig. 2), whereas var. vulgaris and fastigiata (subsp. fastigiata) grouped together in cluster A. However, accessions of var. peruviana and var. aequatoriana grouped together with the varieties from subsp. hypogaea in cluster B, rather than grouping with the other varieties of subsp. fastigiata in cluster A. These results support recent conclusions from amplified fragment length polymorphism (AFLP) analysis (He and Prakash, Reference He and Prakash2001) that var. aequatoriana and peruviana are much closer to subsp. hypogaea than to subsp. fastigiata.
Most previous reports of diversity analysis in cultivated groundnut have readily detected morphological variation but consistently failed to detect a parallel level of molecular genetic variability, however recent studies (Ferguson et al., Reference Ferguson, Bramel and Chandra2004a; Moretzsohn et al., Reference Moretzsohn, Hopkins, Mitchell, Kresovich, Valls and Ferreira2004, Reference Moretzsohn, Leoi, Proite, Guimãres, Leal-Bertioli, Gimenes, Martins, Valls, Grattapaglia and Bertoli2005) using more recently developed SSRs have found higher levels of genetic diversity in the six botanical varieties of A. hypogaea than reported previously. Significantly, the SSR screening reported in this study also detected a substantial level of molecular genetic variation between genotypes of all botanical varieties. However, AMOVA showed an equal level of diversity within and between botanical varieties. This may suggest that botanical variety designations (largely based on morphological traits) are not truly reflective of gross genetic diversity.
There was some degree of clustering of accessions from similar geographic origins within subspecies, e.g. four landraces and one breeding line from South and Central America grouped together at a level of approximately 50% similarity in cluster B and were clearly differentiated from accessions derived from other geographic regions. Additionally, the BW-resistant accessions Bobai Shiyaodou and Bobai Dahuasheng both originate from Bobai County in China and were observed to group together at a level of approximately 82% similarity in cluster B. However, AMOVA estimated 86% of the SSR variation is accounted for within countries. So although there may be some influence of geographic isolation on genetic polymorphism, as has been reported previously (e.g. He and Prakash, Reference He and Prakash2001), it is likely that breeding selection pressure has had greater impact. However, it should be noted that the groundnut accessions studied here were selected primarily based on their response to BW and thus may not be truly reflective of groundnut variability in each geographical region.
Regarding the genetic variation observed within and between the BW-resistant and -susceptible accessions, it was observed that the BW-resistant lines belonging to subsp. fastigiata and subsp. hypogaea were clearly differentiated, and clustered within subspecies. In contrast, two BW-susceptible accessions (Zao18 and Zhongua No. 5) did not fall in the expected cluster (subsp. fastigiata var. vulgaris), but were grouped in cluster B (predominately subsp. hypogaea). This anomaly may be largely explained by the pedigree of these two breeding lines which included accessions from subsp. hypogaea. It should be noted that the BW-susceptible var. vulgaris accessions within cluster B (subclusters B(II) and B(III)) grouped only at a level of approximately 60% similarity with the resistant accessions belonging to subsp. hypogaea. These results could indicate that the accessions susceptible to BW are more genetically diverse than their resistant counterparts, suggesting that the selection for adaptation to the bacterial wilt pathogen may have contributed to reduced genetic variation in the germplasm which may be due to a combination of pathogen pressure and breeder's selection pressure.
Pairwise dissimilarities of up to 64% were observed between cultivated groundnut genotypes screened in this study. This compares with 41% genetic differentiation revealed between cultivated groundnut genotypes as revealed by randomly amplified polymorphic DNA (RAPDs; Dwivedi et al., Reference Dwivedi, Gurtu, Chandra, Yuejin and Nigam2001) and 52% as revealed by AFLPs (He and Prakash, Reference He and Prakash2001). Thus, SSRs are clearly the most powerful tools for revealing genetic variation within the cultivated groundnut gene pool.
Several SSR alleles were also found to be significantly associated with BW resistance and these represent candidates for marker-assisted selection (MAS) following validation in traditional, segregating mapping populations. Molecular breeding offers the potential for improving the speed, precision and cost of groundnut disease resistance breeding programmes (Dwivedi et al., Reference Dwivedi, Crouch, Nigam, Ferguson and Paterson2003). In addition, MAS offers the potential for pyramiding different sources of resistance together with resistance to multiple diseases which is difficult or impossible to achieve through conventional approaches (Mohan et al., Reference Mohan, Nair, Bhagwat, Krishna, Yano, Bhatia and Sasaki1997). The paucity of molecular polymorphism previously revealed in cultivated groundnut posed a considerable obstacle to genetic mapping and MAS. The first and only currently available genetic linkage map of the tetraploid groundnut genome (Burow et al., Reference Burow, Simpson, Starr and Paterson2001) was only made possible through the use of a synthetic amphidiploid, TxAG-6, capturing a high level of genetic diversity from divergent diploid species (Simpson, Reference Simpson1991; Simpson et al., Reference Simpson, Nelson, Starr, Woodard and Smith1993). Although SSRs now offer a substantially higher level of detectable variation, it is still essential to base the selection of parental genotypes for mapping populations on detailed diversity analysis. It is hoped that the result of this study will help molecular breeders in selecting the most appropriate parental genotypes for mapping BW resistance.
It is now important to distinguish which genotypes possess different mechanisms of resistance and to search for additional novel sources of resistance to BW. Landraces and varieties from Indonesia, China and Vietnam (where BW disease pressures are highest) would appear to be the most likely targets for identifying new sources of resistance. On this basis, marker-assisted gene-pyramiding programmes can aim to develop high-yielding varieties with more durable resistance to this devastating disease.
Acknowledgements
The authors gratefully acknowledge Mr A. Gafoor for technical assistance, Mr S. Hari Krishna for biometrical advice and Dr M. Ferguson for early access to SSR markers. This research was undertaken as part of the Asian Development Bank-funded project ‘Rapid Crop Improvement for Poor Farmers in the Semi-Arid Tropics of Asia’ (RETA 5945). Biotechnology research at ICRISAT is grateful for unrestricted grants from the governments of Japan and the UK and from the European Union.


