Introduction
The genus Elymus L. (Triticeae, Poaceae) contains approximately 150 perennial species and is the largest, most morphologically diverse taxon in the Triticeae (Dewey, Reference Dewey and Gustafson1984; Wang and Jensen, Reference Wang, Jensen and Singh2009). Elymus is distributed across diverse environments from the Arctic to temperate and subtropical regions (Dewey, Reference Dewey and Gustafson1984; Jensen and Asay, Reference Jensen and Asay1996). The genus is found in both the northern and the southern hemispheres including North America, Europe, Asia, South America and Australia (Barkworth and Dewey, Reference Barkworth and Dewey1985; Wang, Reference Wang1992; Jensen and Asay, Reference Jensen and Asay1996; Lewis et al., Reference Lewis, Martinez and Dubcovsky1996). Asia is the origin for approximately 80 of the known Elymus species, while North America has the second largest number of endemic Elymus species (McMillan and Sun, Reference McMillan and Sun2004). North American Elymus is a polyploid genus containing the St and H genomes (Mason-Gamer et al., Reference Mason-Gamer, Orme and Anderson2002). The St genome is derived from Pseudoroegneria spicata (Pursh) A. Löve, a diploid perennial, while the H genome is derived from the genus Hordeum (Dewey, Reference Dewey1971). Pascopyrum smithii (Rydb.) A. Löve has the genomic constitution StHNsXn (Zhang and Dvorak, Reference Zhang and Dvorak1991).
Elymus grasses show adaptation to many abiotic stresses and are important sources of forage and habitat for wildlife and livestock (Asay and Jensen, Reference Asay, Jensen, Moser, Buxton and Casler1996) and are used in seeding and soil stabilization efforts on semi-arid wildlands (Jones and Larson, Reference Jones, Larson, Shaw, Pellant and Monson2005). Elymus lanceolatus, E. canadensis, E. virginicus and E. trachycaulus are all native North American forage grasses, while E. repens is widely viewed as a noxious weed. P. spicata and P. smithii are also important perennial Triticeae grasses native to the Western United States. Few molecular genetic resources are available for these species which have required the use of molecular markers from other genera, as was done by Saha et al. (Reference Saha, Young and Hopkins2009). We earlier reported (Bushman et al., Reference Bushman, Larson, Mott, Cliften, Wang, Chatterton, Hernandez, Ali, Kim, Thimmapuram, Gong, Liu and Mikel2008) the development of expressed sequence tags (ESTs) and simple sequence repeat (SSR) resources for several grasses in the Triticeae including E. wawawaiensis J.R. Carlson and Barkworth and E. lanceolatus (Scribn. & J.G. Sm.) Gould. A library of 10,368 ESTs, including 442 SSRs, was developed using hybrids of E. lanceolatus and E. wawawaiensis. Moreover, polymerase chain reaction (PCR) primers flanking these 442 SSRs yielded 133 polymorphic markers when tested on E. lanceolatus and E. wawawaiensis (Bushman et al., Reference Bushman, Larson, Mott, Cliften, Wang, Chatterton, Hernandez, Ali, Kim, Thimmapuram, Gong, Liu and Mikel2008). The objective in this study was to evaluate the polymorphic potential and transferability of 100 SSRs on Elymus, Pseudoroegneria and Pascopyrum species.
Materials and methods
DNA isolation
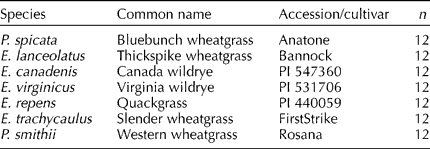
Plant materials for this study included E. lanceolatus, E. canadenis L., E. virginicus L., E. repens (L.) Gould, E. trachycaulus (Link) Gould ex Shinners, P. smithii and P. spicata (see Table 1). Fresh tissue from 12 individual plants from each accession/cultivar was collected from plants growing in containers (Stuewe and Sons Inc., Corvallis, OR, USA) in a greenhouse at Logan, UT. DNA was extracted using a DNeasy 96-well extraction kit, according to the manufacturer's protocol (Qiagen, Valencia, CA, USA). Adequate quantity and quality of DNA was assessed by spectrophotometry using a NanoDrop-1000 (Thermo Scientific, Wilmington, DE, USA), and agarose gel electrophoresis (data not shown).
Table 1 Plant materials included in Elymus SSR testing and analysis

Amplification, scoring and analysis of SSR's
A total of 100 Elymus EST-SSR primer pairs producing polymorphic bands in E. lanceolatus and E. wawawaiensis plants (Bushman et al., Reference Bushman, Larson, Mott, Cliften, Wang, Chatterton, Hernandez, Ali, Kim, Thimmapuram, Gong, Liu and Mikel2008) were characterized (see supplementary Table S1, available online only at http://journals.cambridge.org). Furthermore, SSR information including sequence accession numbers and primer Tm can be found at http://titan.biotec.uiuc.edu/cgi-bin/ESTWebsite/estima_start?seqSet = elymus. Standard hot-start PCR amplification procedures were used, except that 1 μmol/l R110-ddCTP (PerkinElmer, Waltham, MA, USA) was spiked into the reaction to allow direct fluorescent detection of DNA fragments by the DNA sequencer. Amplification products were multiplexed when possible followed by separation on a capillary ABI 3730 instrument with GS-500 LIZ size standard. Individual profiles were visualized with GeneScan software (Applied Biosystems, Foster City, CA, USA), and scored for the presence (1) or absence (0) of fragments with Genographer software (Benham, Reference Benham2001). Non-polymorphic bands were excluded from the analysis. The polymorphism information content (PIC) was calculated for each SSR markers as 1-Σpij2 where pij is the frequency of the jth allele of ith marker (Weir, Reference Weir1990).
Raw binary data from 84 individual plants and 432 bands generated from all 100 SSR's were used to construct a neighbour-joining (NJ) phylogram using PAUP* version 4.0b (Swofford, Reference Swofford2002). The NJ phylogram was modified to include bootstrap confidence levels recovered from the 50% majority rule consensus of 1000 NJ searches for the 84 individual genotypes using all 100 SSRs by PAUP* version 4.0b (Swofford, Reference Swofford2002). Figure 1 also shows additional bootstrap values (in parenthesis) for NJ trees based on the subset of 23 SSRs included in Table 1, and a subset of just the first five SSRs in Table 1.

Fig. 1 NJ phylogram based on pairwise comparisons of total differences among 84 individual plants from seven different grass species. The NJ tree is based on 100 SSRs (432 bands). Bootstrap confidence levels are shown for groups in the 50% confidence tree, with values shown in parenthesis for NJ trees based on a subset of 23 (142 bands) and five SSRs (40 bands), respectively.
The raw binary data was converted to a Euclidian distance matrix containing values ranging from 31 to 198. This distance matrix was the input file for analysis of molecular variance (AMOVA) using Arlequin 2.0 software (Schneider et al., Reference Schneider, Roessli and Excoffier2000).
Results
SSR amplification
The utility of 100 Elymus SSRs was demonstrated on five species of Elymus, P. spicata and P. smithii. All of the SSRs amplified polymorphic bands in at least one of the species tested (supplementary Table S1, available online only at http://journals.cambridge.org). Across all species, three SSRs (Elymus 2676, Elymus 4021 and Elymus 3264) produced 11 bands each while the rest of the SSRs produced from 1 to 10 bands. The average number of bands per plant within a species ranged from 0 to 8. Elymus 3163 was the most polymorphic SSR producing an average of five to eight bands per plant. Overall, a total of 432 polymorphic bands were produced from the 100 SSRs. Of the 100 SSRs, 57 produced an average of at least one polymorphic band for each of the seven species. A subset of the 23 most polymorphic SSRs (an average of two or more bands per species) is given in Table 2 and produced a total of 142 bands. The five most polymorphic SSRs (an average of three or more bands per species; the first five SSRs in Table 2) produced a total of 40 bands; 47 SSRs lacked polymorphic bands in at least one species.
Table 2 SSRs tested on Elymus, Pseudoroegneria and Pascopyrum species. The SSRs listed produced an average of at least one band from each of the species and were subsequently sorted by descending order based on the minimum average number of bands produced in any of the species

A summary showing the rice chromosome location, repeat motif, primer sequences, base pair size range, total number of bands produced across all seven species, the average number of bands per plant per species and PIC values can be found in supplementary Table S1 (available online only at http://journals.cambridge.org). The SSRs averaging at least one band per species, in descending order of the lowest average number of bands per plant for any of the seven species are shown in Table 2.
Diversity within and among Elymus species
AMOVA using the total SSR dataset showed that 29.9% of the total variation was within and 70.1% was among the accessions. E. lanceolatus and P. smithii had the most within accession variation, an average of 65 polymorphisms each, while E. virginicus had the least with only 14 (Table 3). The average total polymorphisms between species ranged from 119 for E. canadensis/E. virginicus to 181 for E. canadensis/E. repens. The average ΦST for all comparisons was 0.701.
Table 3 Pairwise comparisons of the average total number of polymorphisms between species (P XY, above diagonal), average number of polymorphisms within species (P X, diagonal), and the average number of polymorphisms among species, corrected by polymorphism within species (P XY−(P X+P Y)/2, below diagonal)a

a The relative apportionment of variation among species, ΦST (2P XY/(P X+P Y)), is shown in parentheses (below diagonal). All ΦST values were significant (P < 0.01).
A NJ tree (Fig. 1) shows that use of the complete set of 100 SSRs allowed grouping of individual plants with the appropriate accession with a 100% confidence. The subset of 23 SSRs grouped all Elymus accessions with ≥ 95% confidence, while the P. spicata group only had a confidence interval of 58. The subset of five SSRs successfully grouped all plants from only three of the six Elymus species and P. spicata ( ≥ 66% confidence).
Discussion
SSR microsatellite markers are useful for plant identification, functional diversity studies, taxonomy and comparative genetic mapping (Varshney et al., Reference Varshney, Graner and Sorrells2005). Few molecular resources are available for perennial Elymus. We earlier reported the sequencing of ESTs and identification of SSR resources for E. lanceolatus and E. wawawaiensis (Bushman et al., Reference Bushman, Larson, Mott, Cliften, Wang, Chatterton, Hernandez, Ali, Kim, Thimmapuram, Gong, Liu and Mikel2008). A total of 442 Elymus SSRs were initially screened on two species, E. wawawaiensis and E. lanceolatus. Of these only 133 were polymorphic (Bushman et al., Reference Bushman, Larson, Mott, Cliften, Wang, Chatterton, Hernandez, Ali, Kim, Thimmapuram, Gong, Liu and Mikel2008). In this current work, the usefulness of 100 SSRs was tested on seven different species to test transferability and information content. All of the Elymus SSRs were useful in generating polymorphic DNA fragments and 57% of them were transferable across all seven species, including the two non-Elymus species, P. spicata and P. smithii. PIC of each SSR can be found in Table S1. Each of the SSRs has homologous sequences located on one of the 12 rice chromosomes, allowing a selection of markers with distribution throughout the genome (Table 2 and supplementary Table S1, available online only at http://journals.cambridge.org). This will be particularly useful for genetic linkage map construction and genetic diversity studies, allowing selection of markers that provide genome-wide representation. A subset of 23 SSRs with the highest levels of polymorphisms across all species tested are presented in Table 2. Of the 100 SSRs, 57 produced at least one band in all five Elymus species as well as P. spicata and P. smithii. Since these SSRs showed transferability to several Elymus species, as well as two species from different genera, it is probable that they will have transferability to many of the approximately 150 Elymus species making these SSRs useful for studies of many grasses in the Triticeae.
Although the purpose of this work was not to conduct phylogenetic analysis of the Elymus genus, the data generated by these SSRs were useful in characterizing genetic diversity within and among accessions/cultivars, and in constructing a NJ phylogram (Fig. 1). A subset of 23 SSRs (shown in Table 2) generated 142 polymorphic bands. This dataset was sufficient to correctly group all Elymus and P. smithii plants to their respective accessions with ≥ 95% confidence level. This result suggests that these 23 primers would be a good starting panel of SSRs for genetic diversity studies.
E. canadensis, E. trachycaulus and E. virginicus are all self-pollinating species (Jensen et al., Reference Jensen, Zhang and Dewey1990) and this is reflected in the relatively small average number of polymorphisms within accessions with 21, 40 and 14 differences, respectively (Table 3 and Fig. 1). Conversely, P. spicata, E. lanceolatus, P. smithii and E. repens are highly self-sterile species (Jensen et al., Reference Jensen, Zhang and Dewey1990) which share higher levels of within accession diversity than the self-pollinators with 50, 65, 65 and 57 differences, respectively. The level of polymorphism within E. trachycaulus is about twice that in E. canadensis and E. virginicus suggesting that there may be a higher level of cross-pollination in E. trachycaulus. Since there is only one accession representing each species in this study, there are limitations on inferring specie relationships from this phylogram (Fig. 1). Nevertheless, the proximal grouping of P. smithii and E. lanceolatus coincide with the hypothesis that E. lanceolatus and Leymus triticoides (Buckley) Pilg. are the probable progenitors of P. smithii (Dewey, Reference Dewey1975). The diploid P. spicata separates out as the most unique species, while the noxious weed E. repens shows an intermediate relationship with P. spicata and the other Elymus species.
In conclusion, 100 Elymus SSRs were characterized and reliably generated polymorphic DNA bands across multiple species and genera of the Triticeae. These SSRs will be useful molecular tools for functional diversity studies, and comparative genetic mapping.