Introduction
Lepidium latifolium L. (Brassicaceae), commonly known as pepperweed or peppergrass, is an invasive plant (Reynolds and Boyer, Reference Reynolds and Boyer2010) native to Western Asia and Southeastern Europe. It is also prominent in Western Himalayas, especially in the high altitude and harsher climate of the cold desert Ladakh (minimally 9800 ft above sea level (asl); 86,904 km2), with temperature extremes ranging from − 35°C in winter to up to 35°C in summer. Similar to native flora and fauna of this region, L. latifolium also adapts well to a number of abiotic stresses, namely low temperature, drought, solar radiations, high altitude, etc. High mountain ranges in the north as well as in the south have proven geographical barriers for the biota of the region, thus isolating the species.
Most of the above-ground parts of this plant are edible, and in Ladakh, the spring leaves of this plant are consumed as vegetables. Lepidium may be found growing well with green leafy appearance surviving under snow even during winter in Ladakh, when most other plants shed their leaves (Gupta et al., Reference Gupta, Grover and Ahmed2012). Unfortunately, despite the immense potential of the plant from agronomic and ecological point of view, Lepidium has never been in the focus of the scientific community, and absolutely no efforts have been made to understand the molecular biology, genetics or genetic variability of this plant (Gupta et al., Reference Gupta, Grover and Ahmed2012). The objective of the present study is to estimate genetic diversity in Lepidium based on microsatellites as markers. The benefit of using microsatellites lies in their hypervariable nature that can successfully detect variability within a population distributed in a small geographical area.
Microsatellites or simple sequence repeats are abundant and ubiquitous entities in eukaryotic genomes (Grover et al., Reference Grover, Aishwarya and Sharma2012). Comparatively higher rates of mutations at these loci compared with other genomic regions constitute the source of variation between individuals of a species, and thus these can be employed as suitable molecular markers. Conventionally, these are isolated from size-selected or enriched genomic libraries of the species under investigation by screening several thousands of clones through hybridization with microsatellite probes (Zane et al., Reference Zane, Bargelloni and Patarnello2002). In recent years, in silico mining has been highly advocated for the identification of microsatellites and the development of microsatellite markers (Grover et al., Reference Grover, Aishwarya and Sharma2012). This is an excellent approach, while working with model species (Sharma et al., Reference Sharma, Grover and Kahl2007); however, its use is limited when working with non-model species (Grover et al., Reference Grover, Jain and Sharma2010).
As little information is available in the case of L. latifolium, we used an innovative strategy, wherein we extracted microsatellite regions from genome walker libraries and used them in DNA fingerprinting studies thereafter, thereby enhancing the success rate of developing microsatellites to 100%. We call this new technique as Random Scans at Microsatellite Regions (RaSMiR). The following sections detail the methodology followed for the development of RaSMiR markers, and their employment for the demonstration of genetic diversity in L. latifolium.
Materials and methods
Plant material
Seeds of Lepidium plants were strategically collected from different parts of the Leh city and its nearby vicinity. Lepidium plants growing in relatively different topographical conditions, i.e. in a valley, on a rocky surface, on the roadside, on a sun-facing slope and from the sunshade, were randomly selected. The seeds were germinated in our laboratory on half Murashige and Skoog (MS) medium (Murashige and Skoog, Reference Murashige and Skoog1962) jellified using agarose and the plants were maintained at 25°C under white light in 16/8 h light and dark cycles. In total, 30 plants from different sites were selected for the analysis (Table 1).
Table 1 Description of collection sites of the seeds, whose harvested plants were used in the present study

DIHAR, Defence Institute of High Altitude Research, Leh.
GPS coordinates of the above-mentioned sites: 1. Choglamsar: 34°06′38.89″N; 77°35′16.08″E; 10,620 ft asl. 2. DIHAR: 34°08′23″N; 77°34′26″E; 11,500 ft asl. 3. Leh: 34°08′43.43″N; 77°34′03.41″E; 11,500 ft asl. 4. Spituk: 34°07′31.8″N; 77°31′34.6″E; 10,852 ft asl. 5. Nimu: 34°11′38.90″N; 77°20′07.80″E; 10,320 ft asl. Based on the collection sites, genotypes were classified into eight groups: I, genotypes 1–8; II, genotypes 9–15 and 30; III, genotypes 16 and 17; IV, genotypes 18–20; V, genotypes 21–23; VI, genotypes 24 and 29; VII, genotypes 25–27; VIII, genotype 28.
Development of microsatellites for a random genomic scan
DNA was extracted from Lepidium plants using the N′, N′, N, N-Cetyl trimethyl ammonium bromide (CTAB) method of Saghai-Maroof et al. (Reference Saghai-Maroof, Biyaschev, Yang, Zhang and Allard1984). Genome walker libraries were prepared using a commercial kit, following the manufacturer's protocol (Clonetech, USA). Polymerase chain reaction (PCR) was carried out with the primer sequence 5′-GCGCGAAATTAACCCTCACTAAAG-3′ (T3), which is complementary to the adaptor used in the kit and either of the microsatellite primers 5′-GAAGAAGAAGAAGAAGAA-3′ (AG001) or 5′-CTCTCTCTCTCTCTCTCTCT-3′ (AG002). The PCR was carried out in a total volume of 25 μl, which was constituted of 10 pmol of T3 primer and 30 pmol of either AG001 or AG002 primer, 20 μM of deoxyribonucleotides (dNTP) mix, 1.5 mM MgCl2, 1 × Taq polymerase buffer and 1U Taq polymerase. Thermal cycling conditions consisted of an initial denaturation of 5 min at 94°C, followed by 35 cycles of denaturation at 94°C for 30 s, reannealing for 30 s at 43°C when AG001 and T3 primers were used, and at 55°C when AG002 and T3 primers were used, followed by elongation at 72°C for 30 s. A final elongation for 10 min was carried out at 72°C. Amplicons were cloned in a pDrive cloning vector (QIAGEN, Germany) using the QIAGEN PCR Cloning Kit (QIAGEN, Germany), following the manufacturer's protocol. Recombinant vectors were transformed in competent cells of E. coli strain DH5α using heat shock at 42°C for 90 s followed by incubation on ice for 5 min. Cells were initially grown in Luria Bertani (LB) medium for 1 h, and later plated on LB Agar plates supplemented with 100 mg/ml of ampicillin, 50 μg/ml 5-Bromo-4-CHloro-3-Indolyl-β-D-galactopyranoside (X-Gal) and 0.5 mM Isopropyl-β-D-thiogalactoside (IPTG). Colony PCR was carried out to determine the size of the insert. Colonies with insert sizes 300–500 bp were sent for sequencing to commercial service providers.
DNA sequencing, preliminary sequence analysis and primer design
Clones and amplicons were sent for sequencing to three different commercial DNA sequencing centres in India: first, at the DNA Sequencing Facility in the Department of Biochemistry, University of Delhi South Campus, New Delhi; second, at Vimta Labs, Hyderabad; third, at Eurofins, Bangaluru. Sequences were obtained in FASTA format. Microsatellites were screened visually in sequences, and ‘sense primers’ (or reverse primers) were designed using Primer3 (frodo.wi.mit.edu/cgi_bin/primer3/primer3_www.cgi). Primers were designed at least 30 bp away from the microsatellite. An effort was made to keep the annealing temperature (T m − 5)°C of primers as about 55°C and %GC close to 60. T m was calculated following the formula: (2(A or T)+4(G or C))°C.
PCR assay and allele detection
Amplification was carried out in a 25 μl reaction mixture containing 200 μM dNTP, 1 × Taq polymerase buffer (Bangalore Genei, India), 1.5 mM MgCl2, 50 ng genomic DNA, 1U Taq polymerase (Bangalore Genei, India) and 10 pmol each of standard length forward and reverse primers. Reactions were carried out using standard PCR conditions of denaturation, reannealing and extension. The PCR-amplified products were run on 2.0% agarose gels and stained using ethidium bromide. Polymorphic bands were scored based on the presence or absence of bands for each of the genotype. Only clear and unambiguous bands were scored. The sizes of the bands were determined based on their migration relative to molecular weight size markers (1 kb ladder plus; Fermentas, Lithuania).
Data analysis
The frequency of polymorphism was calculated based on the presence or absence of common bands between different genotypes for each type of markers. Popgene (version 1.32) was used for the calculation of heterozygosity (h; Nei, Reference Nei1973) and Shannon's diversity index (I; Lewontin, Reference Lewontin1972), and a neighbour-joining (N-J) tree based on Nei's (Reference Nei1978) genetic distance method and the unweighted pair group method with arithmetic means (UPGMA) (Sneath and Sokal, Reference Sneath and Sokal1973) was constructed.
Results
Mining microsatellite regions
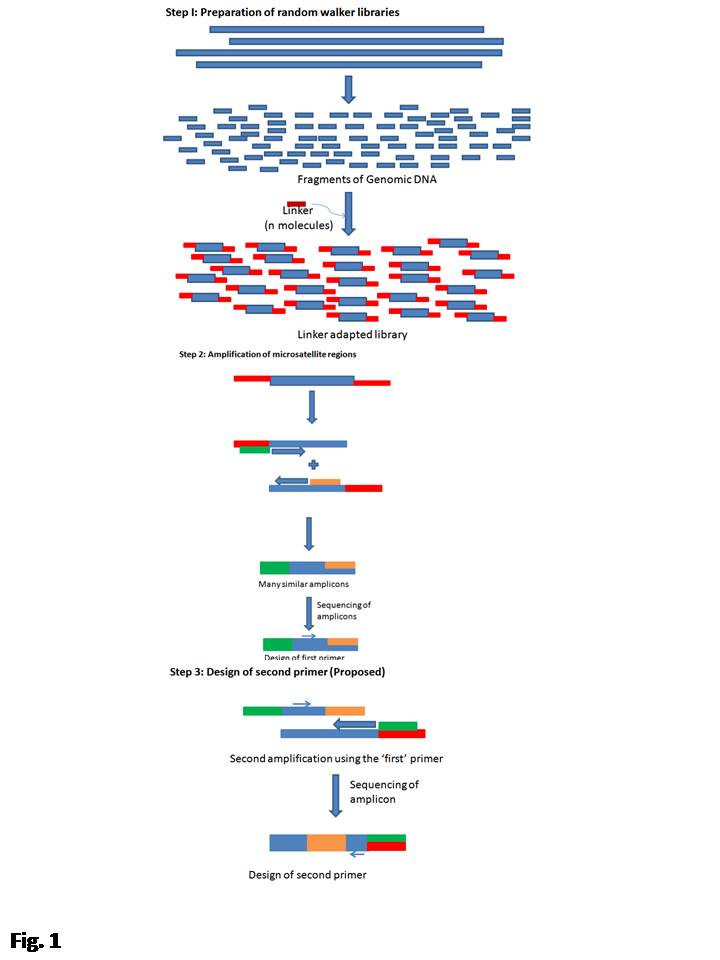
In the first phase of the experiment, we amplified a region lying between a microsatellite and the ligated anchors (see Supplementary Fig. S1, available online only at http://journals.cambridge.org) using the anchor-specific primers and a microsatellite oligonucleotide primer from the genome walker library template. The amplified region was sequenced and on sequencing, a 100% success rate of isolating a microsatellite was observed. A primer was designed from the region lying between the anchor and the microsatellite (see Supplementary Fig. S1, available online only at http://journals.cambridge.org). In the second phase, this primer was used to amplify the microsatellite region again with the anchor primer from the other end, using the same genome walker library as the template (see Supplementary Fig. S1, available online only at http://journals.cambridge.org). However, as we were interested in the random genome scans at the microsatellite regions, we designed only one primer after sequencing the cloned regions for each of the microsatellite-containing inserts (Table 2). To induce randomness during the genome scan, the microsatellite by itself was used as the second primer. We named the marker system thus developed as RaSMiR. To ensure that the observed amplicons are different from the ones that could have been obtained using only microsatellite primers (inter-simple sequence repeats; ISSR), single primer amplifications were also carried out (Fig. 1).
Table 2 Data on microsatellite discovery and PCR primers for each of the new markers developed


Fig. 1 (a) Representative photograph of electrophoretic mobilities shown by amplicons obtained using primers AG001 and B8. (b) Representative photograph of electrophoretic mobilities shown by amplicons obtained using primer AG001. In both (a) and (b), lanes 1–19 are loaded with amplicons obtained from genotypes 1–19, as listed in Table 1. Lane L is loaded with a 1 kb ladder (Fermentas, USA).
Analysis of diversity at repeat regions
The number of scorable bands for each primer varied from 15 in the case of B28 to 27 in the case of B8 (Table 3). Both ISSR markers produced 16 bands each in the range of 225–3000 bp (Fig. 1). Thirteen specific microsatellite primers in combination with one ISSR primer produced 230 bands (Table 3) with an average 17 bands per primer. The mean h or Nei's (Reference Nei1973) gene diversity of RaSMiR markers was computed as 0.2793 and mean Shannon's information index (I) (Lewontin, Reference Lewontin1972) was 0.4295. These values changed only marginally (0.2786 and 0.4289, respectively), when combined mean of RaSMiR and ISSR markers for the values of h and I were calculated.
Table 3 Polymorphism displayed by RaSMiR markers in L. latifolium genotypes

h- Heterozygosity
I- Shannon diversity Index
LlaCIPKF and LlaCIPKMR are specific primers for amplification of upstream sequence of CIPK gene from Lepidium latifolium, with following sequence-
LlaCIPKF- 5′-GTC GCA GCT TTA GCT TTT GC-3′
LlaCIPKMR- 5′-GGA GCT CCA CGA TGT TCG-3′
Based on the site of collection, we had tentatively classified all the genotypes into eight different groups, and most of the members in groups I and II were clustered together and these two groups were also placed closer to each other, as expected (Fig. 2).

Fig. 2 N-J tree constructed based on Nei' (Reference Nei1973) genetic distance and UPGMA algorithm. The digits at the end of the branches correspond to genotypes mentioned in Table 1.
Discussion
We have demonstrated an innovative method for mining of microsatellites from a non-model plant species. Conventionally, genomic microsatellites are isolated from the size-selected genomic libraries (Zane et al., Reference Zane, Bargelloni and Patarnello2002). This approach requires screening of several thousands of clones through colony hybridization with microsatellite repeat containing probes (Rassmann et al., Reference Rassmann, Schlotterer and Tautz1991). However, the portion of the genome screened using this method is very small ( < 1%), and the success of finding a microsatellite is even lesser (~0.001%) as estimated by Ashkenazi et al. (Reference Ashkenazi, Chani, Lavi, Levy, Hillel and Veilleux2001) and Grover et al. (Reference Grover, Ramesh and Sharma2009) for potato. To overcome this disadvantage, most workers have switched over to the construction of enriched libraries for the isolation of microsatellites, which improves the success rate by 50% (Grover et al., Reference Grover, Jain and Sharma2010). There have also been reports of isolating microsatellite sequences using other approaches such as fast isolation by amplified fragment length polymorphism (AFLP) of sequences containing repeats (FIASCO) (Zane et al., Reference Zane, Bargelloni and Patarnello2002) and a highly successful data mining from sequence databases (Aishwarya et al., Reference Aishwarya, Grover and Sharma2007; Sharma et al., Reference Sharma, Grover and Kahl2007). However, FIASCO suffers from the disadvantage that it relies on AFLP, which includes either the use of radioactivity or fluorescence, and data mining from sequence databases, at present, is possible only for a handful of species. Enrichment methodology that we have adopted here interestingly overcomes most of the disadvantages discussed above. While the success rate of following the procedure is 100%, it does not require the use of any labelling technique and can be adopted for any species.
The strategy used in this study may be grouped with PCR amplification-based molecular marker techniques that attempt to scan the genomes. The most popular among these techniques are random amplified polymorphic DNA (RAPD, Williams et al., Reference Williams, Kubelik, Livak, Rafalski and Tingey1990) and AFLP (Vos et al., Reference Vos, Hogers, Blecker, Reijans, van de Lee, Hornes, Fritjers, Pot, Paleman, Kuiper and Zabeau1995). Several modifications and derivatives of both RAPD and AFLP combining advantages of high polymorphism levels of microsatellites have been demonstrated in the past, and the most popular among them is ISSR (Meyer et al., Reference Meyer, Mitchell, Freedman and Vilgalys1993). In a relatively complicated technique called anchored microsatellite-primed PCR, amplification products are run on polyacrylamide gel in place of agarose gel (Zietkiewicz et al., Reference Zietkiewicz, Rafalski and Labuda1994). Siebert et al. (Reference Siebert, Chenchik, Kellogg, Lukyanov and Lukyanov1995) cloned ISSR products and sequenced them for designing nested primers from one flanking region, calling the modified technique as dual-suppression PCR. Using the methods similar to ours, a second primer could be designed. Further modifications of RAPD and ISSR include random amplified microsatellite polymorphism (RAMP, Wu et al., Reference Wu, Jones, Danneberger and Scolnik1994), double-stringency PCR, a variant of RAMP (Matioli and de Brito, Reference Matioli and de Brito1995), PCR isolation of microsatellite arrays (PIMA) depending on the cloning of RAPD products in a T-vector and screening as well as the amplification of microsatellites using colony PCR (Lunt et al., Reference Lunt, Hutchinson and Carvalho1999) and random amplified hybridization microsatellites (RAHM) involving arbitrarily or microsatellite-primed PCR with microsatellite hybridization (Cifaraelli et al., Reference Cifaraelli, Gallitelli and Cellini1995). RAHM is also variously known as RAMP (Richardson et al., Reference Richardson, Cato, Ramser, Kahl and Weising1995) or randomly amplified microsatellites (Hantula et al., Reference Hantula, Dusabenyagasani and Hamelin2007).
Selective amplification of microsatellite polymorphic loci (SAMPL), introduced by Morgante and Vogel (Reference Morgante and Vogel1994), is similar to AFLP with one of the primers being compound microsatellite specific in second amplification. Microsatellite–AFLP is a further deviation of SAMPL, in which a 5′-anchored microsatellite primer is used, resulting in about 100 bands on a sequencing gel (Yang et al., Reference Yang, Sweetingham, Cowling and Smith2001). Selectively amplified microsatellite (SAM) analysis, described by Hayden and Sharp (Reference Hayden and Sharp2001), is comparable to the methods employed by us in terms of success of mining microsatellite sequences, and the reliance on a single locus-specific primer. However, our protocol is shorter than the SAM, for the development of microsatellite markers. Acquadro et al. (Reference Acquadro, Portis, Lee, Donini and Lanteri2005) modified the SAM protocol (called the microsatellite amplified library) to generate both the primers for the development of microsatellites, which is similar to our method that is open for exploitation for the development of the second primer.
Microsatellites thus developed have been implemented for the demonstration of genetic diversity in a representative sample of the Lepidium population distributed in a small geographical area (Table 1). The plants were collected from topographically distinct places in the Leh region. Lepidium easily grows in all kinds of terrains including on the rocky surfaces. We expected the genotypes collected from nearby places to be clustered together (null hypothesis), i.e. we expected groups I, II and VII to be clustered together, and groups IV, V and VI to be clustered together. However, on drawing the N-J tree, we found that the clustering of genotypes deviated from our expectations, and thus the null hypothesis was proved to be wrong (Fig. 2). As trees are the outcome of mapping and clustering the microsatellite alleles together, first in the form of a matrix and then in a phylogenetic tree (carried out using some software), the distribution of microsatellite alleles thus appeared random and did not show any association with the genotypes collected from a particular site. However, it is very difficult to ascertain whether microsatellite alleles provide any selective advantage, or microsatellite mutations are simply following a neutral mode of evolution. Proving the evolutionary and ecological significance of microsatellites is a difficult task. If a microsatellite occurs within a gene sequence or is conserved in its regulatory region, its functionality can be studied (Vasemagi et al., Reference Vasemagi, Nilsson and Primmer2005; Edelist et al., Reference Edelist, Lexer, Dillmann, Sicard and Riserberg2006; Olafsdottir et al., Reference Olafsdottir, Snorrason and Ritchie2007; Makinen et al., Reference Makinen, Shikano, Cano and Merila2008).
Generally, microsatellite loci showing no polymorphism are considered to be of recent origin. From the evolutionary point of view, this could be the result of several bottlenecks, which might be further regulated either by the environment or by the vitality of the molecular or meiotic function of the locus involved (Grover and Sharma, Reference Grover and Sharma2011). Such loci apparently do not play any role in the evolution of the species (Grover and Sharma, Reference Grover and Sharma2011). However, such conclusions must be drawn with caution, as a microsatellite associated with an important region of the genome (from the evolutionary point of view) can significantly display lower variability during genetic drift and selective sweeps (Sclotterer, Reference Sclotterer2003), leading to allele excess.
In the present study, both hypervariable and non-mutable loci were observed (Fig. 2(a)). Functional vitality might be the determinant of their differential mutabilities. Genome scan methods, as studied here, have a high potential to identify the loci involved in adaptations as well as the ones that drive genome divergence. However, an experimental validation using selection experiments is recommended.
Acknowledgements
Logistic support received from DIHAR and DRDO HQ as well as financial assistance to P.P. and S.S. by DRDO is duly acknowledged.