


Introduction
In developing countries, 50% of the area under wheat cultivation is rainfed, which could be the main reason for severe drought stress (Gupta et al., Reference Gupta, Balyan and Gahlaut2017). Grain yield is a complex trait with strong genotype by environment interactions. Grain yield is significantly correlated with seedling traits such as root length (RL), shoot length (SL) and dry root weight (DRW) (El-Rawy and Hassan, Reference El-Rawy and Hassan2014). Therefore, adaptive traits less influenced by environment like physiological and seedling emergence traits are targeted to understand the genetics of drought adaptability (Acuna- Galindo et al., Reference Acuna-Galindo, Mason, Subrahmanyam and Hays2015). For example, smaller leaf area and low dry weight of flag leave in soft red winter wheat lead to higher yield (Balota et al., Reference Balota, Green, Griffey, Pitman and Thomason2017).
Recent advancement in genotyping technologies has facilitated the identification of underlying mechanisms of important agronomic traits and candidate gene discovery in many crops (Michelbart et al., Reference Michelbart, Hasegawa and Bailey-Serres2015; Rasheed et al., Reference Rasheed, Hao, Xia, Khan, Xu, Varshney and He2017). Acuna-Galindo et al. (Reference Acuna-Galindo, Mason, Subrahmanyam and Hays2015) reported 502 quantitative trait loci (QTL) associated with drought tolerance using meta-analysis approach based on the positions and confidence interval of QTL regions reported in the literature. Similarly, about 800 QTL have been reported in wheat related to drought stress (Gupta et al., Reference Gupta, Balyan and Gahlaut2017). For drought adaptive traits at the seedling stage, thirty QTL were identified for root growth angle in a recombinant inbred lines (RILs) population and association mapping panel, and only six were co-localized to previously reported QTL (Maccaferri et al., Reference Maccaferri, El-Feki, Nazemi, Salvi, Cane, Colalongo, Stefanelli and Tuberosa2016). Eighteen QTL were identified in RILs of 168 lines (‘Iran #49’ × ‘Yecora Rojo’) for root traits, out of which two QTL were on chromosome 4B for deep root weight, three were for shallow root, total root biomass and deep root weight on 2D and 4A chromosomes (Ehdaie et al., Reference Ehdaie, Mohammadi and Nouraein2016). Eleven QTL have been reported in previous studies for RL on nine chromosomes (Gupta et al., Reference Gupta, Balyan and Gahlaut2017). Acuna-Galindo et al. (Reference Acuna-Galindo, Mason, Subrahmanyam and Hays2015) reported one meta-QTL for DRW on chromosome 1B, three for RL on chromosome 1AL, 6DL and 7DL, and two QTL for SL on chromosome 2DS and 5BL (Fig. 1).
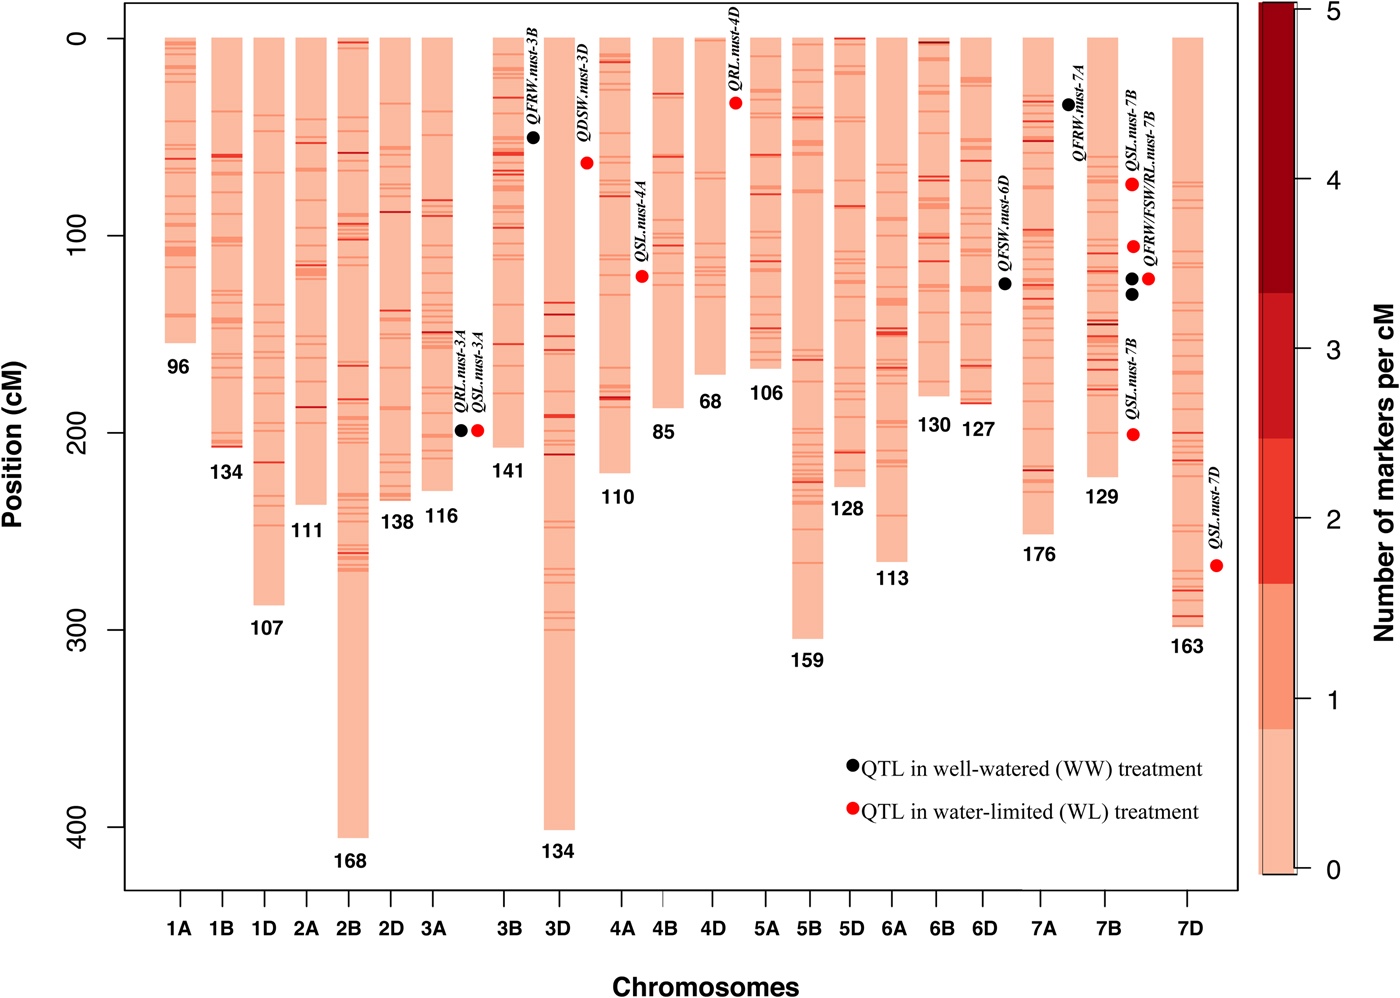
Fig. 1. Linkage map of Synthetic (W7984) × Opata RILs population (SynOpRIL) consisting of 21 chromosomes using 2639 GBS markers. Numbers below each chromosome are the number of markers, Y-axis represents the length of linkage group and scale on the right side represent the density of markers at a given position.
International Triticeae Mapping Initiative (ITMI) mapping population is a useful resource derived from synthetic hexaploid wheat ‘W7984’ and bread wheat cultivar ‘Opata’. This population facilitated the development of the first RFLP (van Deynze et al., Reference van Deynze, Dubcovsky, Gill, Nelson, Sorrells, DvoÍák, Gill, Lagudah, McCouch and Appels1995) and SSR (Röder et al., Reference Röder, Korzun, Wendehake, Plaschke, Tixier, Leroy and Ganal1998) linkage maps in wheat (Rasheed et al., Reference Rasheed, Ogbonnaya, Lagudah, Appels and He2018). ‘W7984’ is a drought tolerant synthetic hexaploid wheat (Altar 84/Ae. tauschii 219), whereas ‘Opata M85’ is a drought susceptible bread wheat developed by International Maize and Wheat Improvement Center (CIMMYT), Mexico. Initially, ITMI population consisted of 150 RILs developed by the single seed descent method, but anomalies have been accumulated due to labelling errors and chromosomal instability. Therefore, reconstruction of the population was followed using same parents and with more precautions. A double haploid population from 250 F1 hybrids referred as ‘SynOpDH’ and a RIL population consisted of 2043 F6 lines referred as ‘SynOpRIL’ were constructed (Sorrells et al., Reference Sorrells, Gustafson, Somers, Chao, Benscher, Guedira-Brown, Huttner, Kilian, McGuire, Ross, Tanaka, Wenzl, Williams and Qualset2011). The objective of the present study is to identify QTL for seedling morphology in SynOpRIL under water-limited and well-watered conditions.
Materials and methods
Germplasm
Two hundred and nine RILs from ITMI (SynOpRIL) mapping population including both parents were used for this study. These lines constitute a subset of new ITMI population consisting of 2043 F6 RILs (Sorrells et al., Reference Sorrells, Gustafson, Somers, Chao, Benscher, Guedira-Brown, Huttner, Kilian, McGuire, Ross, Tanaka, Wenzl, Williams and Qualset2011).
Phenotyping
All lines were phenotyped at seedling stage under control and drought stress conditions using the cigar roll method (Zhu et al., Reference Zhu, Mickelson, Kaeppler and Lynch2006; Placido et al., Reference Placido, Campbell, Folsom, Cui, Kruger, Baenziger and Walia2013). Seeds were the first surface sterilized with 10% bleach followed by 70% ethanol and then rinsed three to five times with distilled water. Sterilized seeds were placed in Petri plates containing filter paper and germinated in dark. After 5 d, five uniformly germinated seeds were placed 1 cm below the top centre of germination paper which was then rolled to a final dimension of 2 cm in diameter and 35–38 cm in height supported vertically by a metal mesh with 2 × 2 cm2 holes. The rolled papers were placed in 1 litre beakers so that each beaker have a seedling from six accessions to ensure 30 seedlings in each beaker. For well-watered conditions, beakers were filled with 100 ml tap water. For water-limited conditions, 50 ml of tap water was supplied. Water levels were maintained until taking phenotype. Seedlings were grown in a controlled environment with temperature 25/27°C and 11.5/12.5 h day/night. After 7–10 d, RL, SL, fresh root weight (FRW), fresh shoot weight (FSW), DRW and dry shoot weight (DSW) were measured both in well-watered (WW) and water-limited (WL) conditions. All data for each trait in all replications and both treatments were collected in the same day. All trait abbreviations were suffixed by condition names, e.g. RL in WW and WL were expressed as RLWW and RLWL, respectively. For RL, roots were separated from the root–shoot junction without any breakage in root system and then laid down on flat surface and stretched to measure its length and weight using a sophisticated weighing balance. It was then dried in an incubator at 60°C for 24 h to measure DRW. The same procedure was done for shoots of all lines. Three technical replicates were performed. All data were collected and mean values were noted.
Genotyping
DNA extraction was done by the cetyl trimethyl ammonium bromide (CTAB) method (Doyle and Doyle, Reference Doyle and Doyle1987). A genotyping-by-sequencing (GBS) library was constructed according to protocol proposed by Poland et al. (Reference Poland, Brown, Sorrells and Jannink2012) with two restriction enzymes PstI (CTGCAG) and MspI (CCGG), and barcoded adapters were ligated to each sample. It was then pooled by plate into libraries and amplified by polymerase chain reaction. The library was constructed in 95-plex using P38-4A adapter set and was sequenced to 100 bp on a single lane of Illumini Hiseq 2000 at Kansas State University, KA, USA.
Statistical analysis
Genotypic and phenotypic variances were calculated by following formulas:
 $${\rm Phenotypic}\,{\rm variance (}\sigma ^{\rm 2}p{\rm )}:\quad \sigma ^{{\rm 2}\,}g + \sigma ^{\rm 2}{\rm err}$$
 $${\rm Genetic}\,{\rm variance (}\sigma ^{\rm 2}g{\rm )}:\quad ({\rm M}{\rm S}_{\rm f} - {\rm M}{\rm S}_{{\rm ft}}) \times (rt)$$
 $$\eqalign{&{\rm Genetic} \times {\rm treatment}\,{\rm interaction}\,{\rm variance (}\sigma ^{\rm 2}gt{\rm )}: \cr &\quad ({\rm M}{\rm S}_{{\rm ft}} - {\rm M}{\rm S}_{\rm e}) \times (r)}$$
where r is the number of replications; t, the number of treatments; MSf, genotype mean square; MSft, genotype × treatment interaction mean square; σ2error = MSe, Error mean square. All phenotypic data were analysed by SAS 9.2 software. Following are the formulas. Broad-sense heritability (H) were estimated by:
 $${\rm Broad}\,{\rm sense}\,{\rm heritability (}H{\rm )}:\quad \sigma ^{\rm 2}g$$
 $$[(\sigma ^{\rm 2}g + \sigma ^{\rm 2}gt + \sigma _\varepsilon ^{^{\rm 2} } ) \times (r{\rm )]} \times {\rm (}rt{\rm )}$$
where σ 2 g is the genetic variance; σ 2gt, genotype × treatment interaction; r, replication; t, treatments and σ 2p, phenotypic variance. Statistical differences were estimated by threshold probability of P < 0.05.
The raw GBS data were filtered to remove markers with distorted segregation (departure from the expected 1 : 1 segregation ratio). Such individuals were flagged as DISTORTED in the raw data file and, in general, conformed to markers with MAF <0.4. GBS markers were grouped using IciMapping 4.0 software (http://www.isbreeding.net). Linkage analysis was performed using JoinMap 4.0 (Stam, Reference Stam1993). The linkage map was then constructed using R package ‘synbreed’ (Wimmer et al., Reference Wimmer, Albert, Auinger and Schn2012). Map distances between markers were calculated with Kosambi mapping function. QTL analysis was performed using inclusive composite interval mapping (ICIM) with IciMapping 4.0 software (Li et al., Reference Li, Ye and Wang2007). Phenotypic values of all RILs in both WW and WL treatments were used for QTL detection. Missing phenotypic data was deleted using ‘Deletion’ command. The walking speed chosen for all QTL was 1.0 cM, with P = 0.001 in step-wise regression. Based on 2000 permutations at the probability level of 0.01, the LOD scores declare significant QTL for all traits ranged from 2.0 to 2.5. Thus, LOD threshold of 2.5 was chosen for a declaration of putative QTL. The phenotypic variance explained (PVE) was estimated using step-wise regression (Li et al., Reference Li, Ye and Wang2007). QTL were named according to the rules of International Rules of Genetic Nomenclature (http://wheat.pw.usda.gov/ggpages/wgc/98/Intro.htm).
Results
Phenotypic variation and coefficient of correlation
The average, maximum and minimum values of each trait varied among different lines in both treatments (Table 1). The bar plots showing variation in population for each trait are shown as online Supplementary Fig. S1. Estimate of variance components showed significant differences (P < 0.05) among genotypes, between treatments and genotype by treatment interaction (Table 2). Both RL and SL were least affected and were reduced by 18% in WL condition, followed by DSW (19.9%). DRW was most affected and reduced by 91% followed by FRW (37.7%) and FSW (23%) in WL treatment. Broad-sense heritability ranged from 0.51 (DSW) to 0.96 (FRW).
Table 1. Maximum, minimum and average values of agronomic traits at early seedling stage of RILs and their parents in well water and water-limited conditions
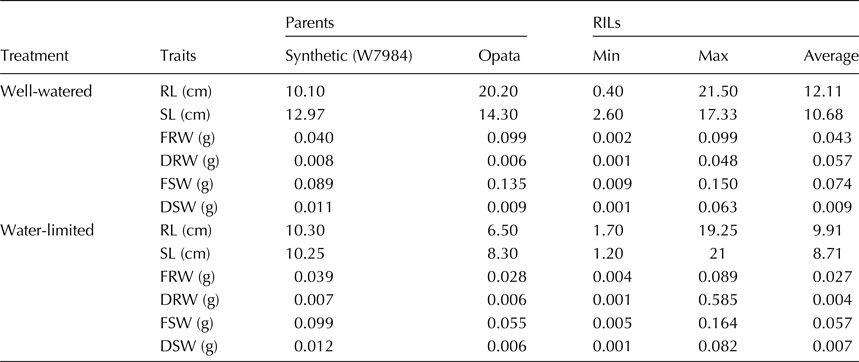
RL, root length; SL, shoot length; FRW, fresh root weight; DRW, dry root weight; FSW, fresh shoot weight; DSW, dry shoot weight.
Table 2. Mean square from combine analysis of variance (ANOVA) for agronomic traits at early seedling stage evaluated in glass house for well-watered and water-limited conditions
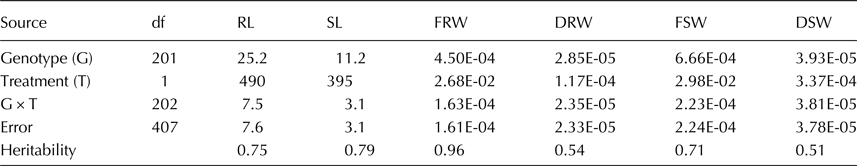
All mean square values are significant at P < 0.05; RL, root length; SL, shoot length; FRW, fresh root weight; DRW, dry root weight; FSW, fresh shoot weight; DSW, dry shoot weight.
All seedling traits showed moderate to strong positive correlation with each other in both treatments (Table 3). The highest positive correlation was observed between SL and FSW (r = 0.74) in WL treatment. In WW treatment, RL showed highly positive correlation with SL (r = 0.68). Similarly, FRW showed significant correlation with RL (r = 0.70). DRW was not strongly correlated with any of the traits. On the other hand, FSW showed high correlation with SL (r = 0.72).
Table 3. Pearson's coefficient of correlation for six seedling traits
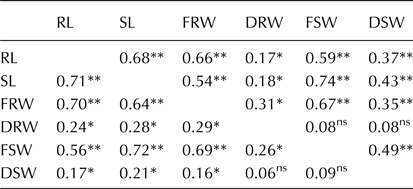
Upper diagonal represent values in water-limited treatment, and lower diagonal represent correlation in well-watered treatment.
*Significant at P < 0.05; **significant at P < 0.01; ns, non-significant; RL, root length; SL, shoot length; FRW, fresh root weight; DRW, dry root weight; FSW, fresh shoot weight; DSW, dry shoot weight.
Linkage mapping and QTL analysis
In the present study, 2639 SNPs from GBS platform were used for QTL study, which facilitated the development of a high-density map (online Supplementary Table S1). In total, 16 QTL for seedling morphology were identified explaining 4.7% (QSL.nust-7B) to 59% (QFSW.nust-7B) of phenotypic variation (Table 4). Ten QTL were identified in WL for RL, SL, DSW and six in WW treatment for FRW and FSW. No QTL was identified for DRW in both conditions. The LOD values ranged from 2.51 (QFSW.nust-6D) to 14.27 (QFSW.nust-7B) (Table 4). QTL were distributed on nine chromosomes, of which seven QTL were mapped to chromosome 7B, two were mapped on 3A and one on each of chromosomes 3B, 3D, 4A, 4D, 6D, 7A and 7D. The additive effects of 12 QTL were from synthetic allele and remaining 4 QTL were from ‘Opata’ allele.
Table 4. Summary of QTL detected in SynOpRIL ITMI population using GBS markers
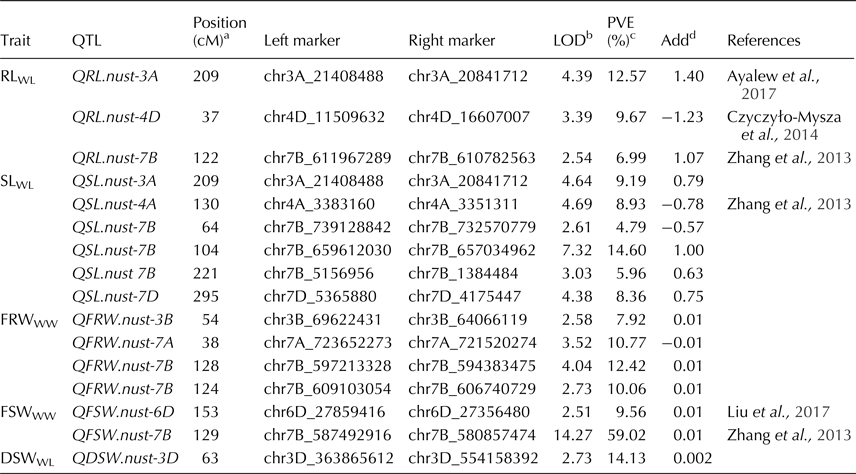
a Position of QTL located on chromosome: as cM distance from the top of each map.
b A LOD threshold of 2.5 was used for declaration of QTL, based on 2000 permutations at a significance level of 0.01.
c Phenotypic variance explained by QTL.
d Positive ‘additive effect’ indicates an increasing effect from Synthetic (W7984); negative ‘additive effect’ indicates an increasing effect from ‘Opata’.
Three QTL for RLWL were identified on chromosome 3A (209 cM), 4D (37 cM) and 7B (122 cM) (Table 4). The phenotypic variation ranged from 6.98% (QRL.nust-7B) to 12.57% (QRL.nust-3A) (Table 4). The positive additive effect for QRL.nust-3A and QRL.nust-7B were from synthetic allele and negative additive effect of QRL.nust-4D was from ‘Opata’ allele.
Six QTL for SLWL were detected on 3A, 4A, 7B (3) and 7D chromosomes. The phenotypic variation ranged from 4.7 (QSL.nust-7B) to 14.6% (QSL.nust-7B). Three QTL for SLWL viz. QSL.nust-7B, QSL.nust-7B and QSL.nust-7B were identified at 64, 104 and 221 cM, respectively. These are likely to be different QTL on the same chromosome due to the distance between them. The additive effect of four QTL, QSL.nust-3A, QSL.nust-7B, QSL.nust 7B and QSL.nust-7D were contributed by the synthetic allele.
Four QTL for FRWWW were mapped on chromosome 3B (at 54 cM), 7A (at 38 cM) and two QTL on 7B (at 124 and 128 cM). These QTL explained 7.92% (QFRW.nust-3B) to 10.06% (QFRW.nust-7B) of the phenotypic variation and the additive effect was contributed by synthetic allele. Two QTL for FSWWW were detected on chromosomes 6D and 7B. QFSW.nust-7B, is a major QTL and explained 59% of the phenotypic variance, while of QFSW.nust-6D explained 9.56% of the phenotypic variance. Both were contributed by a synthetic parent. A major QTL for DSWWL was also identified on chromosome 3D at 63 cM, explaining 14.1% of the phenotypic variance with additive effect from synthetic allele. QTL were not detected for RLWW, SLWW, FSWWL, FRWWL, DSWWW, DRWWW and DRWWL.
Two QTL were identified for RLWL and SLWL on chromosome 3A. These QTL were identified by the same markers at 209 cM (QRL.nust-3A, QSL.nust-3A). Seven QTL were identified on chromosome 7B; of which one was for RLWL (QRL.nust-7B), three for SLWL (QSL.nust-7B), two for FRWWW (QFRW.nust-7B) and one for FSWWW (QFSW.nust-7B) (Table 4).
Discussion
Phenotypic variation for seedling morphology
Numerous methods have been used for phenotypic evaluation of morphological traits under drought stress which is subsequently required for genetic analysis (Iannucci et al., Reference Iannucci, Marone, Russo, Vita, Miullo, Ferragonio, Blanco, Gadaleta and Mastrangelo2017; Afzal et al., Reference Afzal, Reddy, Gul, Subhani, Shazadi, Quraishi, Ibrahim and Rasheed2017). In the present study, RIL population showed transgressive segregation for DRW and RL as compared to other traits under both treatments. It is likely that transgressive segregation in root traits might be a consequence of small leaf size, loss of turgidity and minimized transpiration (Foito et al., Reference Foito, Byrne, Stewart and Barth2009). Our phenotypic results were in accordance with Ayalew et al. (Reference Ayalew, Liu and Yan2017) for DRW and RL. Comparatively lower heritability of all traits under WL might be due to the fact that the genetics of drought adaptability is complex as compared to optimal environment. It has been reported that water stress at seedling stage leads to higher DRW, which can be utilized as selection criteria for drought tolerance at seedling stage (Takele, Reference Takele2000). In addition, variation within RILs population indicated the presence of valuable alleles for these traits, which can be exploited in gene manipulation for drought adaptability.
QTL identified for seedling traits in ITMI mapping populations
Several association mapping and linkage mapping studies have been conducted for drought tolerance in bread wheat (Zhu et al., Reference Zhu, Kaeppler and Lynch2005; Liu et al., Reference Liu, Li, Chang and Jing2013; Ain et al., Reference Ain, Rasheed, Anwar, Mahmood, Imtiaz, Mahmood, Xia, He and Quraishi2015). These studies have been valuable in identifying chromosomal regions related to drought and have also led to notable phenotypic variability. Furthermore, these studies identified novel haplotypes, which can help in deploying genes for tolerance against drought stress (Iannucci et al., Reference Iannucci, Marone, Russo, Vita, Miullo, Ferragonio, Blanco, Gadaleta and Mastrangelo2017).
High marker density is crucial for gene mapping, and several GBS and SNP arrays have been introduced for gene discovery (Rasheed et al., Reference Rasheed, Hao, Xia, Khan, Xu, Varshney and He2017). Thus, ‘SynOpRIL’ population represents a valuable resource to identify novel genes for drought-related traits against drought. In the present study, 2639 SNPs from GBS platform were used for QTL study, which facilitated the development of a high-density map. A total of 16 QTL on nine different chromosomes were distributed for all traits except DRW. These QTL explained phenotypic variation ranging from 4.7 to 59%, out of which five QTL were considered as major QTL due to explaining more than 10% phenotypic variation. Among those, QFSW.nust-7B explained the highest phenotypic variation (59%) that may harbour an important gene.
Numerous QTL have been identified by utilizing various populations. Some new QTL are identified in the current study. Seven QTL from the present study were already reported in previous studies (Zhang et al., Reference Zhang, Cui, Wang, Li, Ding, Zhao, Bao, Yang and Wang2013; Czyczyło-Mysza et al., Reference Czyczyło-Mysza, Marcińska, Skrzypek, Cyganek, Juzoń and Karbarz2014; Kabir et al., Reference Kabir, Liu, Guan, Wang, Khan, Ni, Yao, Hu, Xin, Peng and Sun2015; Luo et al., Reference Luo, Ma, Zhou, Sun, Kong, Wei, Jiang, Qi, Jiang, Liu, Peng, Chen, Zheng, Liu and Lan2016; Ayalew et al., Reference Ayalew, Liu and Yan2017; Ma et al., Reference Ma, Luo, Zhang, Zhou, Qin, Wei, Liu, Jiang, Chen, Zheng and Lan2017) but the markers used for QTL mapping were different. The present study and Ayalew et al. (Reference Ayalew, Liu and Yan2017) identified QTL for RL on 3A under stress condition. In addition, QTL identified on chromosome 4D and 7B were previously reported as QRlengthPC.csdh-4D, QRL.WL.7B.1 and QRL.WL.7B.2 (Zhang et al., Reference Zhang, Cui, Wang, Li, Ding, Zhao, Bao, Yang and Wang2013; Czyczyło-Mysza et al., Reference Czyczyło-Mysza, Marcińska, Skrzypek, Cyganek, Juzoń and Karbarz2014). However, QRlengthPC.csdh-4D and QRL.WL.7B.2 were identified under controlled conditions whereas QRL.WL.7B.1 was found under both conditions. QTL on chromosome 4D was found within the confidence interval of Green-revolution gene (Rht-D1), but both were homozygous for Rht-D1 and contain wild-type Rht-D1a allele. Therefore, it is likely that some other genes within the vicinity of Rht-D1 are responsible for RL increase in the W7984 parent.
For SLWL, QSL.nust-4A identified in this study was previously reported as QSH.WY.4A2 under water stress condition on chromosome 4A (Zhang et al., Reference Zhang, Cui, Wang, Li, Ding, Zhao, Bao, Yang and Wang2013). To the best of our knowledge, the remaining QTL for SLWL detected in the current study have not been reported in wheat earlier. Similarly, QTL for DSWWL has also not been reported in wheat. Under control conditions, we identified four QTL on 3B, 7A and 7B (2) chromosomes for FRW. QTL on 3B may agree with QRFW.WL.3B reported by Zhang et al. (Reference Zhang, Cui, Wang, Li, Ding, Zhao, Bao, Yang and Wang2013). QTL for FSW were identified on chromosomes 6D and 7B. Liu et al. (Reference Liu, Zhang, Hu, Wang, Gao, Liang and Feng2017) reported similar QTL as QPFWR-WJ-6D on chromosome 6D and Zhang et al. (Reference Zhang, Cui, Wang, Li, Ding, Zhao, Bao, Yang and Wang2013) reported QSFW.WY.7B on chromosome 7B, which are likely to be the same QTL. On the other hand, QTL were not detected for some of the traits such as RLWW, SLWW, FSWWL, FRWWL, DSWWW, DRWWW probably due to the low abundance of markers results in a large gap in linkage map.
Many QTL clusters have been reported in previous studies (Kabir et al., Reference Kabir, Liu, Guan, Wang, Khan, Ni, Yao, Hu, Xin, Peng and Sun2015; Luo et al., Reference Luo, Ma, Zhou, Sun, Kong, Wei, Jiang, Qi, Jiang, Liu, Peng, Chen, Zheng, Liu and Lan2016; Ma et al., Reference Ma, Luo, Zhang, Zhou, Qin, Wei, Liu, Jiang, Chen, Zheng and Lan2017). This study also identified one co-located QTL cluster on chromosome 7B. These QTL were detected for SL (3), FRW (2), RL and FSW. Based on a very high phenotypic variance, QFSW.nust-7B is likely to harbour a major gene for shoot biomass (Zhang et al., Reference Zhang, Cui, Wang, Li, Ding, Zhao, Bao, Yang and Wang2013). Co-localization also indicated a closer association of highly correlated traits. These traits are most likely controlled by the same gene. The positive alleles of these traits are from W7984 parent and which could be traced back to its durum parent, i.e. ‘Altar 84’.
Conclusion
Conclusively, QTL mapping using GBS markers identified 16 QTL for seedling morphology. Seven QTL detected on chromosome 7B positioned from 64 to 221 cM, could harbour important genes for drought adaptability. These QTL might serve for fine mapping, gene discovery and MAS in wheat breeding.
Supplementary material
The supplementary material for this article can be found at https://doi.org/10.1017/S1479262118000023.
Acknowledgements
We are grateful to Dr Jesse Poland (Kansas State University, USA) for providing GBS data generated through funds provided by the U.S. Agency for International Development (USAID Cooperative Agreement no. AID-OAA-A-13-0005). We are also thankful to Zahid Mahmood and Abdul Aziz (National Agriculture Research Center, Pakistan) to multiply and provide the seeds of the ITMI population.


