


Introduction
In the high-altitude Andean region of Ecuador, maize diversity is associated with increased levels of food supply. In this region, maize is a product of family farming; in fact, almost three-quarters of the total production originates in peasant family units (INEC, 2012). There is a great need to prioritize the few economic and human resources available for maize germplasm conservation in this country due to its high phenotypic variability, as well as its contribution to the food security of the farmer communities who carry out this work (de la Torre and Balslev, Reference de la Torre, Balslev, de la Torre, Balslev, Navarrete, Muriel and Macía2008; Carrera, Reference Carrera and Cantero2013; INIAP, 2018). Most of the diversity of maize is distributed throughout the high altitude Andes region of Ecuador, with cultural importance translated in terms of uses, landscape, agrobiodiversity, languages and peoples (de la Torre and Balslev, Reference de la Torre, Balslev, de la Torre, Balslev, Navarrete, Muriel and Macía2008). Farmers consider the flavour, texture, cooking time of the grain, adaptation to adverse abiotic and biotic factors, productivity, etc., when choosing their varieties of maize.
For this reason, projects have been developed in the high Andean zone of Ecuador (O'Brien, Reference O'Brien2009; Tapia and Carrera, Reference Tapia and Carrera2011; Drucker and Ramirez, Reference Drucker and Ramirez2020) where maize diversity was the focus of the conservation activities. Those studies have provided important lessons about the performance of measures to maintain sustainability and diversity of maize races in Ecuador. From these initiatives, the identification of maize diversity hotspots has emerged as a key element for boosting effectiveness in conservation actions.
Inevitably, any approach to efficient on-farm conservation of maize diversity must consider any previous knowledge about the nature of that diversity and its distribution. Relevant in this context, the concept of races appeared with the first attempts to study maize, to classify and quantify the existing diversity. The concept of ‘race’ was defined by Sánchez and Goodman (Reference Sánchez and Goodman1992) as ‘a group of individuals with enough characteristics in common to permit their recognition as a group’. Therefore, any means to describe those widely recognized groups by local breeders and farmers is valid, but considering crop evolution makes ‘race’ a dynamic concept.
As early as the 1940s, the Rockefeller Foundation funded studies in several South American countries for the identification of maize races via morphological characterization of collected materials (Roberts et al., Reference Roberts, Grant, Ramírez, Hatheway and Smith1957; Grobman et al., Reference Grobman, Salhuana and Sevilla1961; Ramírez et al., Reference Ramírez, Timothy, Díaz and Grant1961; Timothy et al., Reference Timothy, Hatheway, Grant, Torregroza, Sarria and Varela1963). However, despite the abundance of studies carried out on the germplasm of maize in South America, there is no standard classification of the maize races in the Andean highlands (Bracco et al., Reference Bracco, Lia, Gottlieb, Cámara Hernández and Poggio2009). Ecuador is no exception, as the only characterization of Ecuadorian maize germplasm was undertaken by Timothy et al. (Reference Timothy, Hatheway, Grant, Torregroza, Sarria and Varela1963).
The spatial analysis of the data used to characterize genotypic, phenotypic and/or eco-geographical germplasm diversity can significantly contribute to the detection of distribution patterns and diversity hotspots (Parra-Quijano et al., Reference Parra-Quijano, Iriondo, Frese, Torres, Maxted, Dulloo, Ford-Lloyd, Frese, Iriondo and Pinheiro de Carvalho2012). Knowledge of the patterns and peaks of diversity in each geographic area is beneficial for assessing current conservation strategies and prioritizing future efforts (Lowe et al., Reference Lowe, Gillies, Wilson and Dawson2000; Kiambi et al., Reference Kiambi, Newbury, Maxted and Ford-Lloyd2007; Scheldeman and van Zonneveld, Reference Scheldeman and van Zonneveld2010; Thomas et al., Reference Thomas, van Zonneveld, Loo, Hodgkin, Galluzzi and van Etten2012).
A new approach to the analysis of spatial patterns of genetic diversity was published in 2012, using the case of cherimoya (Annona cherimola) samples collected in Ecuador, Peru and Bolivia as an example (van Zonneveld et al., Reference van Zonneveld, Scheldeman, Escribano, Viruel, Van Damme and Garcia2012). This approach introduces a methodology for determining the distribution of genotypic diversity. The DIVmaps tool, included in the CAPFITOGEN program (Parra-Quijano et al., Reference Parra-Quijano, Torres, Iriondo and López2016), allows generating diversity maps by using phenotypic or eco-geographical data. The ease of interpretation of the characterization data provided by these maps makes them powerful tools for ex-situ and in-situ conservation decision-making.
The present study had the following objectives: (1) identification of the phenotypic relationships between maize races in the high altitude Andes region of Ecuador; (2) evaluation of the current intra-racial morphological variability; (3) identification of the sites with a high richness of maize races within the study area; and (4) identification of the spatial patterns in the distribution of the phenotypic and eco-geographical diversity of maize across the high altitude Andes region of Ecuador. This new way of visualizing the characterization analyses of the material conserved by INIAP will give additional value to its national maize collection. This information is expected to enhance the knowledge of the agrobiodiversity of Ecuador and is vital for decision-making and future actions aimed at the conservation of these valuable genetic resources.
Materials and methods
Maize germplasm collections were carried out in 10 provinces of the high altitude Andes region of Ecuador (study area), at altitudes greater than 1600 masl. Farms (303 in total) were visited considering information on maize-producing areas and sites not represented in the maize collection of the INIAP Germplasm Bank. From each farm, a sample of 10 ears (one ear each from 10 randomly selected plants) per race was collected. The ears of maize were duly documented in a passport database, and their collecting sites were geo-referenced by GPS. Both the germplasm and the data collected are kept in the Banco de Germoplasma del Instituto Nacional de Investigaciones Agropecuarias (Germplasm Bank of the National Institute of Agricultural Research, INIAP, 2018), at the Santa Catalina Experimental Station, Mejía, Pichincha, Ecuador.
Morphological characterization
Collected germplasm samples were morphologically characterized using ear and kernel descriptors that had shown a high discriminatory capacity in previous studies (Abu-Alrub et al., Reference Abu-Alrub, Christiansen, Madsen, Sevilla and Ortiz2004; Fernández et al., Reference Fernández, Crossa, Fundora-Mayor, Gálvez, Acuña and Guevara2011). Specifically, six qualitative (shape of the uppermost ear, cob colour, kernel row arrangements, kernel, shape, kernel colour and kernel type) and eight quantitative descriptors (ear length, ear diameter, cob diameter, number of kernel rows, the total number of kernels, kernel length, kernel width and kernel thickness) were recorded (online Supplementary Table S1). These descriptors were used by Timothy et al. (Reference Timothy, Hatheway, Grant, Torregroza, Sarria and Varela1963) to define the races of Ecuador and included in the list of maize descriptors developed by the CIMMYT (2018) with minor modifications. As in other cases (Fernández-Granda et al., Reference Fernández-Granda, Crossa, Fundora-Mayor, Castiñeiras-Alfonso, Gálvez-Rodríguez, García-García and Giraudy-Bueno2013; Mejía et al., Reference Mejía, Muriel, Montoya and Reyes2013; Montes-Hernández et al., Reference Montes-Hernández, Hernández-Guzmán, López-Sánchez, Santacruz-Varela, Vaquera-Huerta and Valdivia-Bernal2014), the current study used in situ characterization as a valid method to determine inter and intra-racial phenotypic diversity and as the only possible way to evaluate 636 samples from 303 farms under the conditions farmers select them.
Observations on qualitative characters defined by Timothy et al. (Reference Timothy, Hatheway, Grant, Torregroza, Sarria and Varela1963) such as ear shape, cob colour and kernel row arrangement were carried out on two ears per sample; kernel shape, colour and endosperm type were measured in 20 kernels (10 kernels per ear).
On the other hand, data about quantitative traits such as ear length and diameter, cob diameter, number of kernel rows and total number of kernels were collected from 10 ears per sample; kernel length, width and thickness were measured in 20 kernels (10 per ear).
Analysis of morphological diversity
Morphological diversity was initially analysed at the race level. The absolute frequencies of categories from each qualitative variable and the index of deviation from the mode (DM) proposed by Wilcox (Reference Wilcox1973) were calculated for each of the qualitative descriptors. The formula used was as follows:
 $${\rm DM\ } = 1-\left({\mathop \sum \limits_{i = 1}^k ( {\,f_{\rm m}-f_i} ) /N( {k-1} ) } \right), \;$$
where f m is the frequency of the modal category, fi is the absolute frequency, k is the number of categories and N is the number of cases. Thus, DM ranges from 0 when all cases fall into the same category, to 1 when all cases are evenly distributed among the categories of each descriptor. Means were also calculated for each race ( $\overline {{\rm DM}} $).
The means and Pearson's coefficients of variation (CV) of quantitative variables were calculated to identify the variables and races showing the most significant relative dispersion of data and, therefore, the greatest variability.
Differences between races were evaluated using the Kruskal–Wallis test (Vargha and Deláney, Reference Vargha and Deláney1998). This test requires the size of the groups to be extensive (>7), so it was applied to races with an absolute frequency above this threshold.
Maps of race richness and abundance of maize
To identify the areas of high richness of races in the high-altitude Andean region of Ecuador, a 5 arc-minute resolution (~10 × 10 km grid cell at the Equator) map was created, in which each cell contained the number of different races present.
Additionally, a map of abundance or sampling intensity was also created to support the interpretation of the results of spatial analysis. Thus, the number of samples collected in each grid cell was calculated using the same resolution of the race richness map.
Morphological and eco-geographical diversity maps
The morphological diversity map was generated using both the information obtained in the morphological characterization and the collection coordinates for each sample. To achieve this, a grid of cells (10 × 10 km) was created, and a circular neighbourhood area (buffer) of 30 km in diameter was generated from the centroid of each cell. The samples occurring in each buffer area were identified; the mean value of morphological distances was calculated for those samples and was assigned to the central cell. Due to the mixed (i.e. quantitative–qualitative) nature of the morphological descriptors, Gower's general similarity coefficient was used to obtain morphological distances (Gower, Reference Gower1971). Finally, a map of the mean value of Gower's coefficient was obtained. This map, hereafter referred to as ‘morphological diversity map’, was obtained using ArcGIS v 10 (ESRI, 2011) and R v 3.1.3 software (R Core Team, 2017). The R script developed is part of the DIVmapas tool script (Parra-Quijano et al., Reference Parra-Quijano, Torres, Iriondo and López2016) and can be downloaded as a component of the set of CAPFITOGEN tools from http://www.capfitogen.net.
The eco-geographical diversity map was generated similarly to the morphological one, using the same cell size, extent and buffer areas. However, in this case, characterization data correspond to 12 environmental variables (five bioclimatic – seasonal mean temperature, annual mean temperature range, December minimum temperature, seasonal rainfall and October rainfall; two geophysical – elevation and slope; and five edaphic – main soil texture, rock depth, pH, fertility and soil organic matter) extracted from the coordinates of each collecting site (online Supplementary Table S2). These quantitative eco-geographical variables were prioritized in the description of abiotic adaptive characteristics of maize in Ecuador, in keeping with the study conducted by Tapia et al. (Reference Tapia, Torres and Parra-Quijano2015). At the end of the process, each cell of this map represents the mean value of the eco-geographic Euclidean distance among the accessions occurring in its buffer area.
Additionally, maps of administrative areas (see https://gadm.org/about.html) were used in the diversity analysis to locate the cells at the provincial and cantonal levels.
Results
Morphological variability
The analysis of the six qualitative descriptors for each race revealed differences in the degree of intra-racial variability, with the samples of Sabanero Ecuatoriano ( $\overline {{\rm DM}} $ = 0.201), Morochón (
 $\overline {{\rm DM}} $ = 0.228) and Mishca-Chillo complex (
 $\overline {{\rm DM}} $ = 0.235) showing the lowest variability; the highest levels of variability were observed in Patillo Ecuatoriano (
 $\overline {{\rm DM}} $ = 0.626) as well as races identified as ‘mixed’ (
 $\overline {{\rm DM}} $ = 0.572), Racimo de Uva (
 $\overline {{\rm DM}} $ = 0.549) and Uchima (
 $\overline {{\rm DM}} $ = 0.541) (Table 1).
Table 1. Wilcox variation index for the qualitative morphological variables in the high altitude Andes region of Ecuador

Shape of the uppermost ear (SE), cob colour (CC), kernel row arrangements (KR), kernel shape (KS), kernel colour (KC) and kernel type (KT).
As shown by the stacked histogram by race for the six variables (Fig. 1), the cylindrical and cylindrical–conical ear shape was observed in the samples of all races. In contrast, the spherical shape was only observed in specific samples of the races Chulpi Ecuatoriano, Cuzco Ecuatoriano, Mishca, Racimo de Uva and Uchima. The most common cob was white in all races, except for the races Chaucho, Mishca-Chillo complex, Mishca-Huandango complex, Racimo de Uva and Uchima, whose samples had mostly orange, red or purple cobs. In all races except Canguil, the majority of the samples (>70%) were concentrated in the regular and irregular categories.

Fig. 1. Morphological variability by race for six qualitative variables in 636 maize samples from the high altitude Andes region of Ecuador. Absolute frequency (AF).
In terms of kernel shape, half of the races with more than one sample showed a relative modal frequency between 80 and 100%, meaning that all or almost all their samples had identical kernel shapes. The samples of seven races had yellow kernels, whereas samples of the other seven races had white kernels (Fig. 1).
The analysis of the eight quantitative descriptors showed differences in the degree of variability (Table 2; Fig. 2). Based on the mean coefficient of variation ( $\overline {{\rm CV}} $), the races with the greatest variability were Montaña Ecuatoriana (21.6%) and Chulpi Ecuatoriano (20.0%) (Table 2). Additionally, the Kruskal–Wallis test showed significant inter-racial differences in the eight variables considered.

Fig. 2. Morphological variability by race of eight quantitative variables of the ear and kernel in 636 maize samples from the high altitude Andes region of Ecuador. Circles represent atypical values and asterisks represent extremes.
Table 2. Coefficient of variation by race of morphological variables in percentage in the high altitude Andes region of Ecuador

Ear length (EL), ear diameter (ED), number of kernel rows (NK), total number of kernels (TNK), cob diameter (CD), kernel length (KL), kernel width (KW) and kernel thickness (KT).
The greatest intra-racial variability in ear diameter, in terms of coefficient of variation, was observed in the samples of Cuzco Ecuatoriano (CV = 15.9%) and Zhima (CV = 14.9%) (Table 2). Similarly, inter-racial differences were observed, particularly between Kcello Ecuatoriano, whose samples had significantly thinner ears, and Blanco Harinoso Dentado, Chillo, Cónico Dentado and Guagal that were the races with the thickest ears. Out of the three variables related to ear size, cob diameter showed the greatest intra-racial variability ( $\overline {{\rm CV}} \;$ = 24.2%); the highest variability for this character was observed in the races Chulpi Ecuatoriano (CV = 34.7%), Kcello Ecuatoriano (CV = 32.2%) and Cuzco Ecuatoriano (CV = 28.1%).
Regarding the number of kernel rows, the races with the greatest intra-racial variability were Montaña Ecuatoriana and Patillo Ecuatoriano (CV > 23%) (Table 2). The total number of kernels was the variable with the highest intra-racial variability, particularly in Montaña Ecuatoriana (CV = 60.9%), Uchima (CV = 41.0%) and Guagal (CV = 38.5%) (Table 2).
In terms of inter-racial kernel variability, Kcello Ecuatoriano, Morochón and Modern Variety showed a significantly shorter kernel length than Blanco Blandito, Blanco Harinoso Dentado and Chillo. On the other hand, Chulpi Ecuatoriano and Modern Variety showed narrower kernels. Regarding kernel thickness, the race Chulpi Ecuatoriano stood out from the rest due to its thinner kernels (Fig. 2).
Maps of the richness of races and abundance of maize
In the map of abundance or sampling intensity (Fig. 3(a)), an outstanding single cell containing 32 samples was observed in Otavalo canton (Imbabura province). In terms of abundance per canton, a larger number of maize samples was observed in the northern area, mainly in the cantons of Otavalo (74 samples), Cotacachi (34 samples) and Urcuquí (28 samples) in Imbabura province, and in the southern area in Sevilla de Oro canton (25 samples), Azuay province.
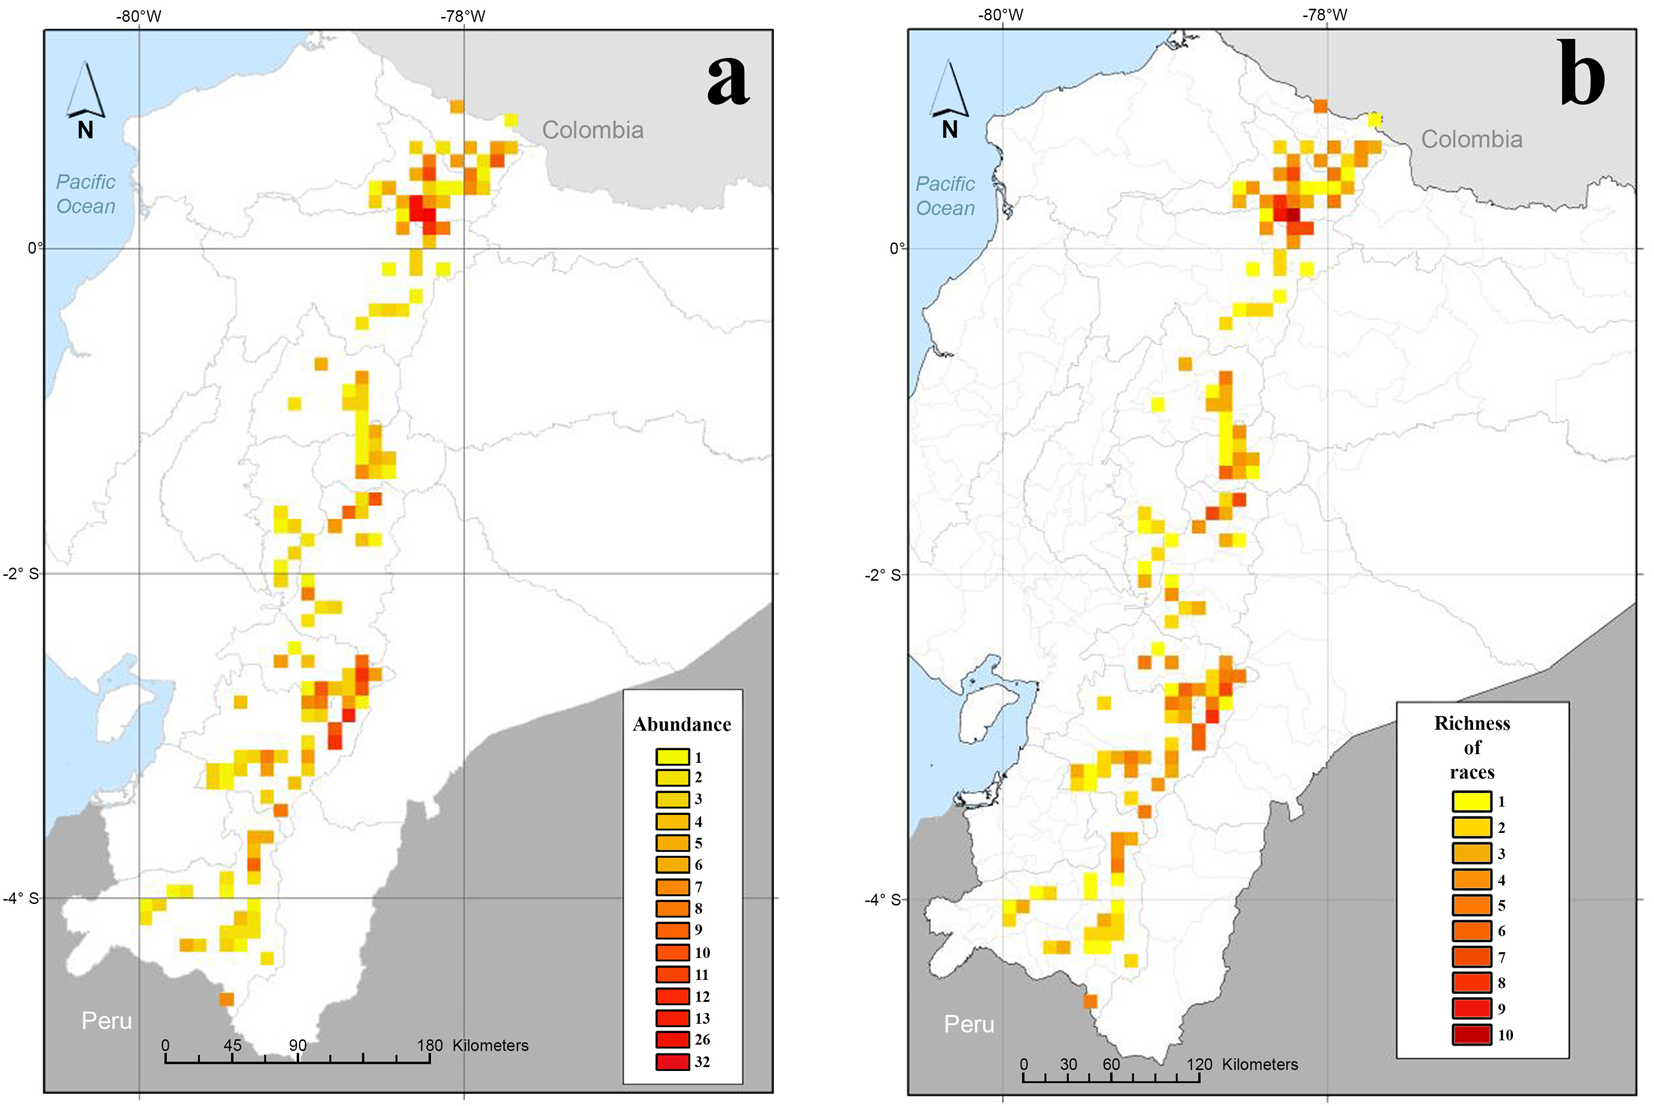
Fig. 3. Maps of sampling intensity and richness of maize in the high altitude Andes region of Ecuador. (a) Abundance and (b) richness of maize races.
Regarding the values of the richness of races at the cell level (Fig. 3(b)), between 9 and 10 different races were detected in two cells located in the province of Imbabura, in Otavalo canton. The following six cells in terms of richness of races (between 6 and 10 races each) were detected in the northern region, specifically in the provinces of Imbabura (five cells) and Pichincha (one cell). Three cells were observed in the central zone of the high-altitude Andean region (two in the province of Chimborazo and one in Tungurahua) with seven to nine races each, and five cells were detected in the southern region (four in Azuay and one in Cañar) with six to eight races each. In 115 cells, values ranged between one and four races each. Regarding richness at the province level, between 10 and 18 races were determined in all the studied provinces, except for Bolívar (four races). The highest richness of races was found in the provinces of Imbabura (18), Azuay (15) and Chimborazo (15).
Morphological and eco-geographical diversity maps
The map shown in Fig. 4(a) represents the morphological diversity (measured in spatial neighbourhoods) in the high-altitude Andean region of Ecuador. This morphological diversity is expressed as mean morphological dissimilarity coefficient, with values ranging from 0 (in which a single sample makes up the neighbourhood or there is no variability between samples) to 0.93, with a maximum possible value of 1. The highest morphological values (0.93) occurred in three cells in the following locations: Quito canton, province of Pichincha; Guano canton, province of Chimborazo; and Loja canton, province of Loja. In these areas, there were up to seven races with cylindrical to spherical ear shapes, mealy to crystalline endosperm and a range of kernel colours (white, yellow and black). Additionally, 48 cells showing values above 0.5 were detected in all 10 provinces, with the highest number (10 cells) located in the province of Azuay.
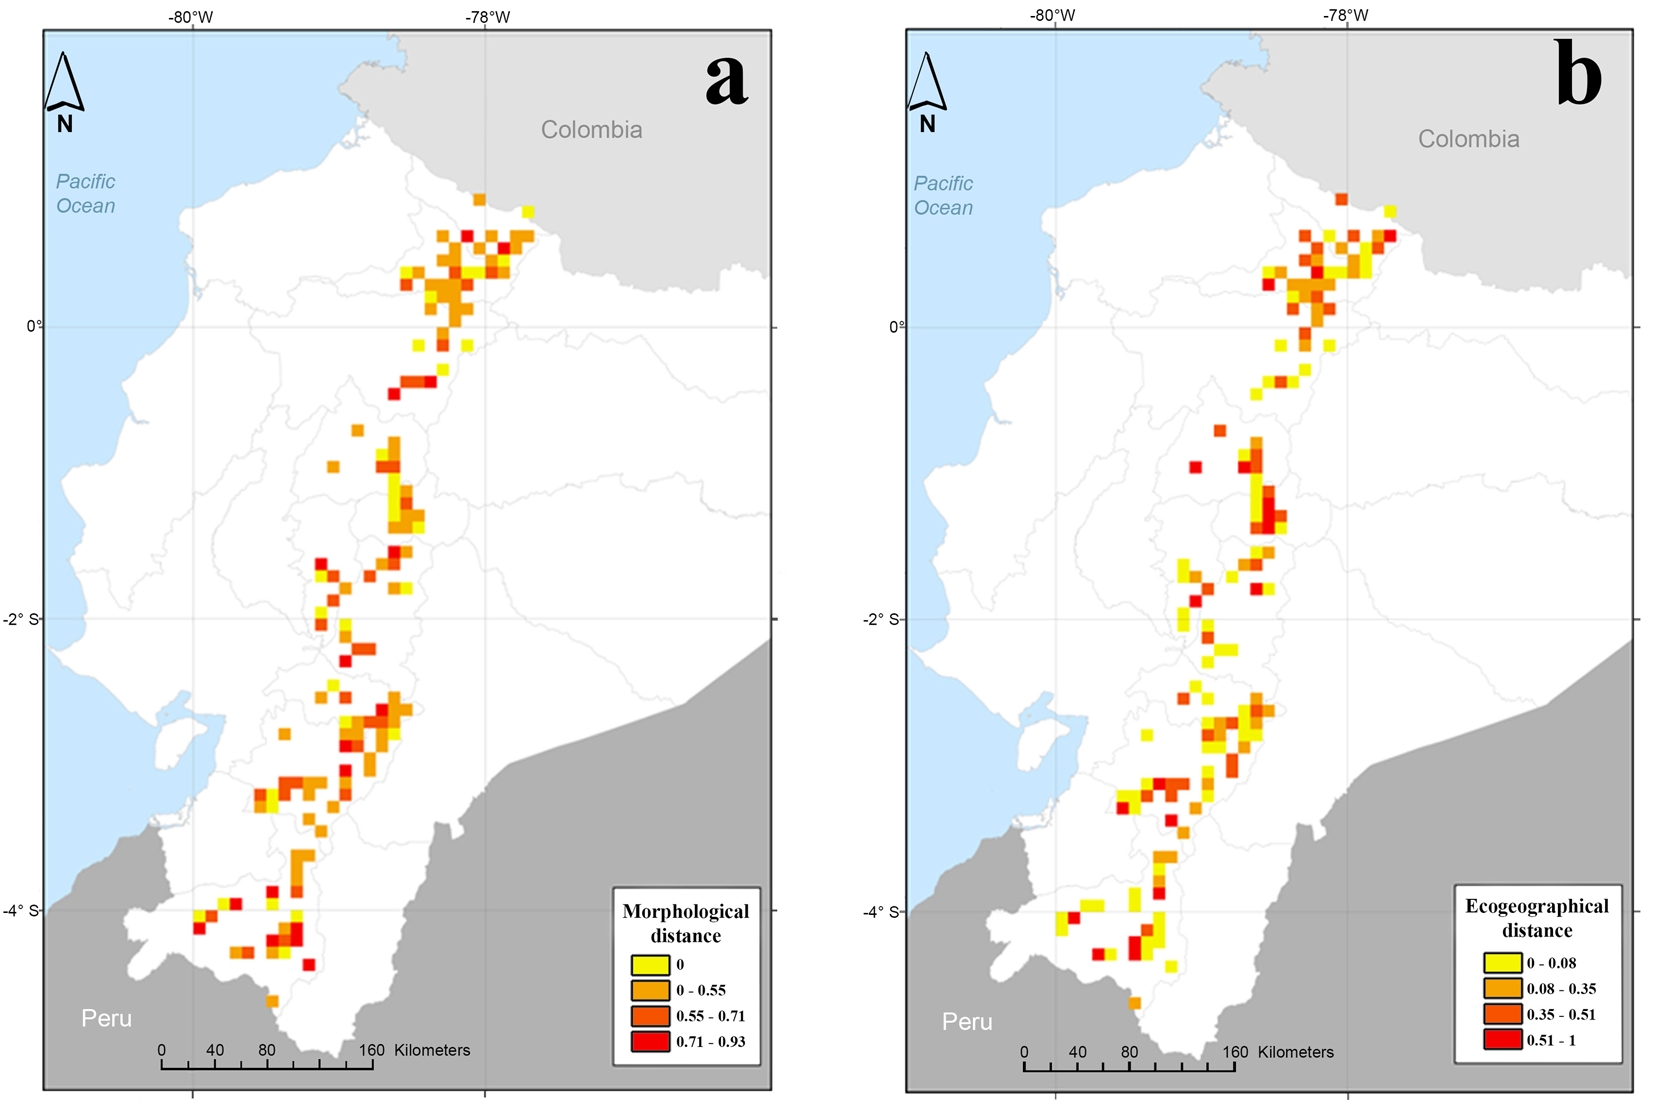
Fig. 4. Maps of diversity by neighbourhood in the high altitude Andes region of Ecuador using Gower coefficient of dissimilarity. (a) Morphological distances and (b) eco-geographical distances.
In terms of eco-geographical diversity, also based on the Gower coefficient of dissimilarity, the map showed two cells with values higher than 0.90 in Loja canton, province of Loja. Eighteen cells with values >0.5 were identified; of these cells, five were in the province of Loja, three in Azuay and Tungurahua, two in Cotopaxi and Imbabura, and one in the provinces of Carchi, Chimborazo and Bolívar (Fig. 4(b)).
A comparison between the maps of richness of races, morphological diversity and eco-geographical diversity revealed the existence of sites with a high richness of races (more than six races) and morphological and eco-geographical diversity (distances >0.5) in the centre and southwest of the province of Imbabura. Several sites with a high richness of races and morphological diversity were also observed in the north of the province of Chimborazo. High morphological and eco-geographical diversity was observed in several sites in the southeast of the Cotopaxi province, in the southwest of the Azuay province, and in the north and southeast of the Loja province.
Discussion
This study indicates that maize diversity is not concentrated in specific places or a few communities, while at the same time, it is not randomly distributed. Interestingly, maize diversity hotpots are distributed in all 10 high Andean provinces of Ecuador. However, some particular cells of high diversity associated with Kichwa indigenous communities can be highlighted in Cotacachi canton (Tapia and Carrera, Reference Tapia and Carrera2011). In this particular canton, maize is more than food, and is involved in recreational or religious events such as Inti Raymi festival (Cevallos, Reference Cevallos2013).
Morphological variability
The analysis of the six qualitative morphological characters indicated that the highest index of variation occurred in the race Patillo Ecuatoriano, even though only 10 samples of this race were analysed. It is probable that the definition of this race by Timothy et al. (Reference Timothy, Hatheway, Grant, Torregroza, Sarria and Varela1963) was ambiguous enough to include highly different samples. For instance, two states or categories are indicated for the shape of the ear (conical to oval) and another two for the arrangement of the kernel rows (irregular to spiral) for this race. Additionally, regarding cob and kernel colours, the possibility of unspecified colours other than red is mentioned. The variability within Patillo Ecuatoriano may also be related to the age of this race. According to Sevilla (Reference Sevilla1991), Patillo Ecuatoriano is as old as Confite Morocho, which is considered one of the oldest races present in the Andean region; this might have led to the development of more significant variation than in other races.
Regarding the race Chulpi Ecuatoriano, its ear shape was defined as conical in the samples characterized by Timothy et al. (Reference Timothy, Hatheway, Grant, Torregroza, Sarria and Varela1963). However, in the present study, this variable exhibited the highest index of variation, as the samples collected for this race corresponded to all four ear shape categories. This suggests that Chulpi Ecuatoriano has been gradually mixed with other races present in the agroecosystems where it grows. This race exhibited the highest coefficient of variation in the number of kernel rows per ear (14–22 rows), with ranges very similar to those defined by Timothy et al. (Reference Timothy, Hatheway, Grant, Torregroza, Sarria and Varela1963). These ranges are among the highest reported, only surpassed by the race Pojoso Chico Ecuatoriano grown in the lowlands of Ecuador.
Similarly, no categories of qualitative descriptors used in the characterization performed by Timothy et al. (Reference Timothy, Hatheway, Grant, Torregroza, Sarria and Varela1963) were found to be missing in the characterization of the material collected for the present study. However, an increase in intra-racial variability was observed, and this study found descriptor categories that were not defined for individual races. This might be caused by the gene flow resulting from the geographical proximity between races, with a greater number of ‘mixed’ populations found. Thus, race identification becomes increasingly difficult, at least using the same morphological parameters valid in earlier studies.
High morphological variability was observed in the ‘mixed’ races, possibly due to the presence of different races in adjoining plots of land as a result of cross-pollination.
The emergence of these ‘blends’ usually makes the identification of races very complex (Hatheway, Reference Hatheway1957). It is very likely that maize races were more divergent from each other in ancient times than they are now (Sevilla, Reference Sevilla, Chávez-Servia and Sevilla-Panizo2006). However, social development and the evolution of transportation and trading activities significantly boosted the possibility of race blending (Fernández et al., Reference Fernández, Crossa, Fundora-Mayor and Gálvez2009). Additional studies on the factors that contribute to the emergence of these mixtures should be undertaken, and their occurrence and coevolution with other native maize avoided in cases where the conservation of the original races prevails (Navarro-Garza et al., Reference Navarro-Garza, Hernández-Flores, Castillo-González and Pérez-Olvera2012; Ayala et al., Reference Ayala, Quiróz and Saravia2019).
Maps of the richness of races, morphological diversity and eco-geographical diversity
Spatial analyses of diversity, in the form of maps of the richness of races, morphological diversity and eco-geographical diversity, provide a novel approach to the conventional analysis of characterization data. In the case of maize, studies on the richness of races have been conducted (Perales and Golicher, Reference Perales and Golicher2014). In the present study, the resulting diversity has been shown in the form of maps that allow quick and straightforward identification of the areas or regions with high variability.
This study identified several sites with high eco-geographical and morphological diversity as well as a high richness of races. The greatest number of samples (abundance) occurs in the northern zone and is not related to greater morphological or eco-geographical diversity, which indicates that a higher sampling effort does not necessarily increase local diversity values. The cells with the greatest richness of races do not coincide with the cells with the highest morphological diversity. This result indicates that the presence of different races does not reflect a high morphological diversity since races can be related to each other. One particular area, in the province of Imbabura, showed high values in all three conditions, possibly as a result of a mix of micro-climates and the high cultural diversity of the indigenous communities present there. However, factors such as climate change could affect these highly diverse sites soon, due to the prolonged droughts experienced by the Andean highland region over the last decade (INAMHI, 2012) that have caused crop losses. In this context, it is worth noting that more than 80% of the cultivated land is not irrigated (INEC, 2012).
In the high altitude Andes region of Ecuador, the map of the richness of races showed high values in the provinces of Imbabura and Azuay, possibly due to the greater cultural diversity related to recreational, social and religious events strongly associated with maize (Coba, Reference Coba1989; Lema, Reference Lema2005). The opposite happened in the province of Bolívar, where samples of six races (Blanco Blandito, Cónico Dentado, Cuzco Ecuatoriano, Kcello Ecuatoriano, Mishca and Patillo Ecuatoriano) were collected in the 1960s according to Timothy et al. (Reference Timothy, Hatheway, Grant, Torregroza, Sarria and Varela1963). The current race count was lower with three races, two of which were not reported in the 1963 study (Blanco Harinoso Dentado and Racimo de Uva).
The low frequency of samples of the races Chaucho, Complejo Chillo-Huandango, Complejo Mishca-Huandango, Clavito, Montaña Ecuatoriana and Yunga on farms is a matter of concern. A great reduction in the cultivation and conservation of races such as Yunga or Clavito may reflect a current lack of interest due to the destination of their products. For these races in particular, which are used to produce animal food, historical national and international production increases and price reductions (MAGAP, 2019) were key factors in the loss of competitiveness. This product replacement can also play an important role in the erosion of traditional knowledge regarding the qualities or properties of these races for specific uses. Additionally, it appears that the ‘Complejo’ types of races and the race Chaucho are replacing the races Chillo and Mishca, which have similar ear and kernel characteristics. In the case of Montaña Ecuatoriana, a white kernel race, its low frequency is possibly due to its replacement by races of a similar kernel type that are better suited to particular uses.
The morphological diversity map has made it possible to identify areas with considerable morphological differences in germplasm collected across the work-frame. Morphological hotspots might be due to several factors, such as the influence of the cultural and management practices of the indigenous and mestizo people. Additionally, the number of cells of high morphological diversity shown on this map is sufficiently high to justify conservation activities in all of them, which would be technically challenging and economically impossible. In this case, it would be advisable to prioritize certain areas based on other factors, such as cultural, social, economic and political criteria.
The eco-geographical diversity map revealed collection sites with very heterogeneous environmental conditions. The main reason for this is the great abundance of water basins, inter-Andean valleys, micro-climates and life zones (Holdridge, Reference Holdridge1978) present in the Andes Mountains. It is well known that this richness of micro-climates that characterizes the Andean highlands has allowed the development of a high diversity of maize and many other crops and wild plants over time (Tapia et al., Reference Tapia, Nieto, Paredes, Nieto, Añazco, Hidrobo and Flor2017). Specifically, an extensive area in the east of the province of Loja showed the greatest distances, suggesting that this is an area with high morphological diversity of maize exposed to very heterogeneous adaptive scenarios. This combination can contribute to the emergence of new maize landraces or races, having an essential role in future maize evolution. On the other hand, eco-geographical diversity maps can help to prioritize conservation efforts even when no genotypic or phenotypic data are available.
The Ecuadorian maize races with the highest variation in the high-altitude Andean region were Patillo Ecuatoriano, Racimo de Uva and Uchima. Some maize races had disappeared from certain areas due to replacement or simply because they are not cultivated anymore, and other races were observed in areas where they had not previously been reported. According to our results, the diversity of races did not appear to have been drastically eroded, at least in terms of the number of extinct races. Nevertheless, genetic erosion at the level of the number of different traditional varieties may be occurring, as evidenced in Mexico (Dyer et al., Reference Dyer, López-Feldman, Yúnez-Naude and Taylor2014).
High levels of intra-racial morphological variability were detected, particularly regarding ear shape, cob diameter, kernel row arrangement and total number of kernels compared to Timothy et al. (Reference Timothy, Hatheway, Grant, Torregroza, Sarria and Varela1963), that is the only information available from studies of maize races in Ecuador. In the same way, all the races reported by Timothy et al. in 1963 were found. Finally, the information on diversity provided by spatial analyses of characterization data and race distribution can be a crucial element to assess the current conservation strategies for these plant genetic resources. The results of this research could help to target areas for on-farm conservation, or for reinforcing the collection of germplasm intended for ex situ conservation. The central and south-western areas of the province of Imbabura are a particularly high priority for the conservation of maize diversity.
Supplementary material
The supplementary material for this article can be found at https://doi.org/10.1017/S1479262121000125.
Acknowledgements
The authors would like to thank the farmers of the high Andean region of Ecuador for their contribution to this study with their maize samples and knowledge. The authors also thank the engineers Edwin Borja, Marcelo Tacán and Edwin Naranjo for their support during various stages of the study. The authors also thank Wendy Byrnes and Ana María Díaz Niño for their linguistic assistance.


