Introduction
Drought is one of the major factors limiting wheat yields in many developing countries worldwide. Drought-resistant plants maintain physiological processes like photosynthesis at lower water potentials (Pugnaire et al., Reference Pugnaire, Serrano, Pardos and Pessarakli1999). Photosystem II (PSII) has been proven to be very sensitive to water stress (Lu and Zhang, Reference Lu and Zhang1998). Changes in the biochemical reaction of PSII can be sensitively characterized by chlorophyll fluorescence as a practical guide to study the relationship between activity of the photosynthetic apparatus and drought tolerance in wheat (Lu and Zhang, Reference Lu and Zhang1998; Inoue et al., Reference Inoue, Inanaga, Sugimoto and El Siddig2004; Tambussi et al., Reference Tambussi, Nogués and Araus2005; Zhang et al., Reference Zhang, Zhao, Liu, Wang and Wang2005). Mapping quantitative trait loci (QTLs) for yield and chlorophyll a fluorescence parameters will provide information on their genetic relationships, by identifying genes that control them, and thereby provide opportunities to improve crop yield by increasing photosynthetic capacity. The aim of this study was to identify the QTLs controlling yield components and chlorophyll fluorescence as physiological factors associated with drought stress in wheat.
Materials and methods
The mapping population used in this study Chinese Spring, SQ1, Double, Haploids (CSDH) consisted of 94 doubled haploid lines (DHLs) generated from the cross between hexaploid wheat (Triticum aestivum L.) genotypes Chinese Spring (CS) and SQ1 (a high abscisic acid breeding line), according to Quarrie et al. (Reference Quarrie, Steed, Calestani, Semikhodskii, Lebreton, Chinoy, Steele, Pljevljakusic, Waterman, Weyen, Schondelmaier, Habash, Farmer, Saker, Clarkson, Abugalieva, Yessimbekova, Turuspekov, Abugalieva, Tuberosa, Sanguineti, Hollington, Aragues, Royo and Dodig2005). The CSDH genetic map presented in Quarrie et al. (Reference Quarrie, Steed, Calestani, Semikhodskii, Lebreton, Chinoy, Steele, Pljevljakusic, Waterman, Weyen, Schondelmaier, Habash, Farmer, Saker, Clarkson, Abugalieva, Yessimbekova, Turuspekov, Abugalieva, Tuberosa, Sanguineti, Hollington, Aragues, Royo and Dodig2005) was used for QTL analysis of yield components: number of grains/main stem ear (NG), grain dry weight/main stem ear (YIELD) and chlorophyll fluorescence parameters: Fv/F0 (maximum primary yield of photochemistry of PSII), Fv/Fm (maximum quantum yield of PSII), performance index as an essential indicator of sample vitality (P.I.) and electron transport flux/excited cross section, at t = 0 (ET0/CS). These traits were evaluated under moderate (MD) and severe (SD) drought stress and compared with well-watered plants (WW). Plants were grown in pots in a rain-out shelter. MD and SD drought conditions were imposed for 4 weeks during the late vegetative stage by maintaining soil water contents at 60 and 40% of WW water contents. Chlorophyll fluorescence parameters were measured on the last day of drought stress conditions. Three plants were tested for each line during 1-year experiment. QTLs were identified using Windows QTLCartographer version 2.5 (Wang et al., Reference Wang, Basten and Zeng2007) and the results were analysed using single-marker analysis (SMA) and composite interval mapping (CIM). A QTL was accepted when the likelihood odds ratio (LOD) score was greater than 3.
Results and discussion
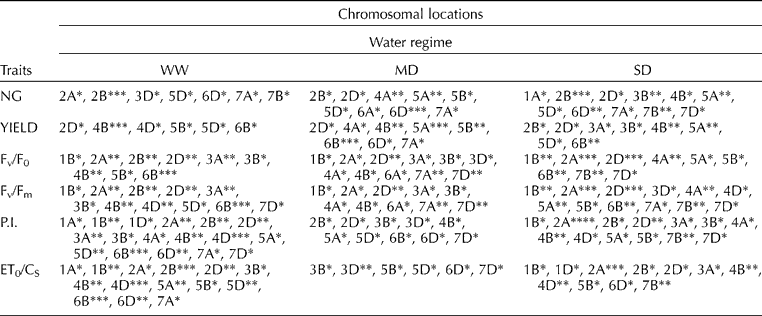
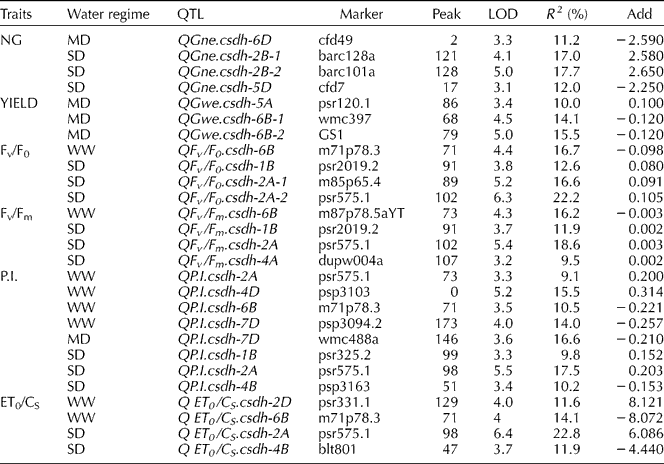
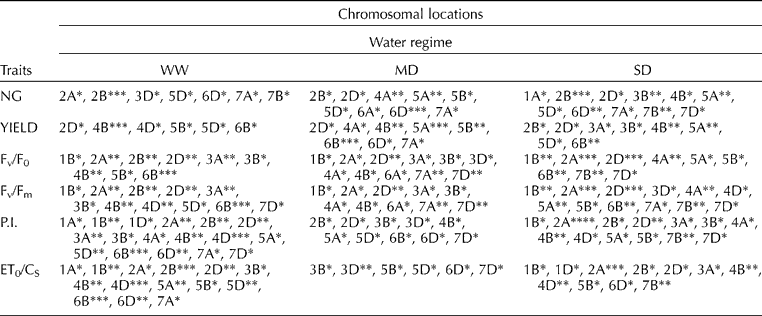
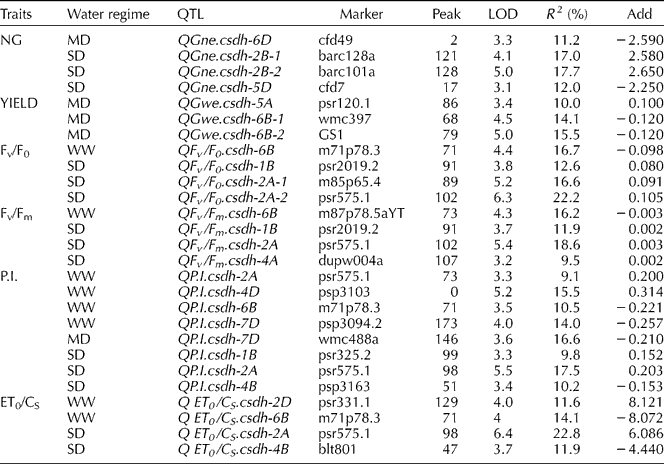
QTL analysis identified several genomic regions involved in regulating yield and chlorophyll fluorescence parameters under three water regimes (Tables 1 and 2). QTL analysis using SMA and CIM showed mostly similar results for all traits, though more QTLs were identified by SMA (Table 1) than by CIM (Table 2). The genetic control of yield, NG and FC varied considerably between drought-stressed and non-stressed plants. Both methods identified a major QTL for NG under MD on chromosome 6D (LOD = 3.3) and QTLs under SD on chromosomes 2B (two QTLs) and 5D, with R 2 of 11.2, 17.0, 17.7 and 12.0%, respectively. QTLs for yield were identified on chromosomes 5A and 6B only under MD. SMA identified additional major QTLs on 5A for YIELD and NG for both drought stress conditions. QTLs for NG by SMA were also localized on chromosome 4A under MD and 3B under SD.
Table 1 Summary of QTLs for yield components and chlorophyll a fluorescence parameters of DHLs under three water regimes identified using SMA

*, **, *** and **** Significance at 0.05, 0.01, 0.001 and 0.0001 probability level, respectively.
Table 2 Main characteristics of significant QTLs for yield components and chlorophyll a fluorescence parameters of DHLs under three water regimes identified using CIM

Peak, position of QTL peak from first marker in cMorgans; R 2 (%), % of phenotypic variance explained by the QTL; Add, additive effect of the CS allele.
The level of chlorophyll a fluorescence varied considerably amongst drought treatments. QTL mapping of FC using CIM identified 20 additive QTLs: 8 QTLs detected under WW, 1 QTL under MD and 13 QTLs under SD for the four FC traits (Table 2). QTLs for Fv/F0, which provides an estimate of leaf photosynthetic capacity, were found under WW on 6B and under SD on 1B and 2A (two QTLs), explaining 16.7 and 12.6, 16.6, 22.2% of the phenotypic variation, respectively. QTLs for other fluorescence parameters under WW were identified: Fv/Fm on chromosome 6B; P.I. on chromosomes 2A, 4D, 6B, 7D and ET0/CS on chromosomes 2D and 6B, explaining phenotypic variation ranging from 9.1 to 16.7%. QTLs for Fv/Fm, which is related to the drought tolerance of photosynthesis, were identified on chromosomes 1B, 2A and 4A under SD, explaining phenotypic variation ranging from 9.5 to 18.6%. Three QTLs controlling P.I. under SD were located on chromosomes 1B, 2A and 4B. Two QTLs for ET0/CS located on chromosomes 2A and 4B (Table 1) explained 22.8 and 11.9% of the phenotypic variation under SD, respectively. Only one QTL under MD was detected for P.I.: chromosome 7D. CIM of all FC parameters showed major loci (LOD>5.0) under SD on chromosome 2A (near psr575.1), with the increasing allele from CS. These 2A QTLs were confirmed by SMA under MD and, more significantly, under SD.
SMA identified additional major QTLs on 2B for all FC parameters under WW. In comparison to WW, localization of QTLs by SMA for NG and all FC parameters were identified on chromosome 7B (P = 0.01) under SD. For both droughts, in comparison to WW, co-localization of QTLs for Fv/F0 and Fv/Fm was observed also on chromosomes 4A, 7A and 7D (Table 1). The presence of QTLs for Fv/F0 on chromosome 7D was also identified in wheat drought studies of Yang et al. (Reference Yang, Jing, Chang and Li2007). Notably, using CIM, no QTLs for yield and FC parameters were coincident for any of the water regimes used here. However, the presence of coincident QTLs for NG, YIELD and Fv/Fm was observed by SMA on chromosome 5A (P = 0.01).
Till now, molecular markers have enabled identification of many QTLs that are involved in the expression of agronomically important traits of wheat, such as yield and its components (e.g. Börner et al., Reference Börner, Schumann, Furste, Coster, Leithold, Roder and Weber2002; Campbell et al., Reference Campbell, Baenziger, Gill, Eskridge, Budak, Erayman, Dweikat and Yen2003; Kumar et al., Reference Kumar, Kulwal, Gaur, Tyagi, Khurana, Khurana, Balyan and Gupta2006, Reference Kumar, Kulwal, Balyan and Gupta2007; Kirigwi et al., Reference Kirigwi, Van Ginkel, Brown-Guedira, Gill, Paulsen and Fritz2007; Maccaferri et al., Reference Maccaferri, Sanguineti, Natoli, Araus-Ortega, Ben Salem, Bort, Chenenaoui, Deambrogio, Garcia Del Moral, Demontis, El-Ahmed, Maalouf, Machlab, Moragues, Motawai, Nachit, Nserallah, Ouabbou, Royo and Tuberosa2008, Reference Maccaferri, Sanguineti, Garcia Del Moral, Demontis, El-Ahmed, Maalouf, Moragues, Nachit, Nserallah, Royo and Tuberosa2011). The genetic dissection of water stress resistance in the CSDH mapping population has previously been carried out by Quarrie et al. (Reference Quarrie, Steed, Calestani, Semikhodskii, Lebreton, Chinoy, Steele, Pljevljakusic, Waterman, Weyen, Schondelmaier, Habash, Farmer, Saker, Clarkson, Abugalieva, Yessimbekova, Turuspekov, Abugalieva, Tuberosa, Sanguineti, Hollington, Aragues, Royo and Dodig2005, Reference Quarrie, Pekic Quarrie, Radosevic, Rancic, Kaminska, Barnes, Leverington, Ceoloni and Dodig2006) and Czyczyło-Mysza (unpublished).
Relationships between physiological traits have been investigated in many studies through QTL mapping (e.g. Lebreton et al., Reference Lebreton, Lazic-Jancic, Steed, Pekic and Quarrie1995; Quarrie et al., Reference Quarrie, Laurie, Zhu, Lebreton, Semikhodskii, Steed, Witsenboer, Calestani and Dodig1997; Thumma et al., Reference Thumma, Naidu, Chandra, Cameron, Bahnisch and Liu2001). Chlorophyll fluorescence has great potential as a high-throughput screen for photosynthetic potential and therefore yield potential. Nonetheless, evidence for its association with genetic gains in yield in crops is lacking, and Foulkes et al. (Reference Foulkes, Reynolds, Bradley, Sandras and Calderini2009) suggest that, it would be difficult to screen for this trait in any crop breeding programmes. Here, we have used parameters of chlorophyll a fluorescence kinetics under drought stress conditions to characterize dehydration tolerance in wheat. Until now, only a few studies have mapped loci associated with FC parameters in wheat (Yang et al., Reference Yang, Jing, Chang and Li2007; Liang et al., Reference Liang, Zhang, Zhao, Liu, Meng, Tian and Zhao2010). Our identification of QTLs for FC parameters will help improve understanding of the genetic basis of photosynthetic processes in plants.
The present preliminary study has shown that yield and FC parameters are suitable quantitative traits for identification of QTLs that could be involved in the regulation of drought resistance of wheat. We plan further QTL analyses of these parameters under drought conditions in wheat to confirm the weak associations between the genetic control of fluorescence parameters and yield identified here.
Acknowledgements
The present research study was funded by COST FA0604 (479/N-COST/2009/0).


