


Introduction
Genetic structure of traditional crops such as sorghum (Sorghum bicolor (L.) Moench) grown under traditional farming systems may reflect the interaction between evolutionary factors (e.g. mutation, drift, selection and migration) and farmers' practices (Alvarez et al., Reference Alvarez, Garine, Khasah, Dounias, Hossaert-McKey and McKey2005). Selection and drift promote genetic diversification between populations, while migration, through pollen and seeds, counteracts this effect. Mixed planting of different populations within the same field, a widespread practice in traditional farming systems (Barnaud et al., Reference Barnaud, Deu, Garine, McKey and Joly2007, Reference Barnaud, Trigueros, McKey and Joly2008), is expected to increase inter-population gene flow. Furthermore, farmers' seed exchange practices seem to be the major cause of long-distance gene flow in cultivated populations (vom Brocke et al., Reference vom Brocke, Christinck, Welteien, Presterl and Geiger2003; Parzies et al., Reference Parzies, Spoor and Ennos2004). The populations of crops that are cultivated by farmers can be grouped into two categories: (1) landraces, formally defined as ‘autochthonous varieties with a high capacity to tolerate biotic and abiotic stress, resulting in high yield stability and an intermediate yield level under a low input agricultural system’ (Zeven, Reference Zeven1998); (2) modern varieties, which are products of modern plant breeding. In this paper, the term variety is used to denote both landraces and modern varieties when being referred together.
Detailed knowledge of the impact of farmers' practices on the genetic structure of sorghum is required for in situ conservation of genetic resources. In addition, such knowledge is crucial for various reasons. In the absence of a formal seed multiplication system, maintenance of genetic purity of modern varieties largely depends on farmers who traditionally rely on farm-saved seeds (Almekinders et al., Reference Almekinders, Louwaars and de Bruin1994). Thus, examining the genetic structure of in situ collected varieties is expected to reveal the likely fate of modern varieties when these are introduced into traditional farming systems. Likewise, such information will be useful for predicting the impact of genetically modified (GM) crops under farmers' management. Despite the potential benefits of GM crops, there is also concern over the possible environmental and agronomic impacts if the transgenes ‘escape’ and become established in natural or agricultural ecosystems (Ellstrand, Reference Ellstrand2001; Gepts and Papa, Reference Gepts and Papa2003; Snow, Reference Snow2003). The potential weediness or invasiveness in the crop or in its wild or weedy relatives as a result of introgression of fitness-enhancing abiotic and biotic traits conferred by transgenes, including resistance to herbicides, insects and disease, and drought tolerance (Warwick et al., Reference Warwick, Beckie and Hall2009), is a major ecological concern. So far, natural hybridization has been reported in crop/wild ancestor complex in 22 of the world's most important crop species, including sorghum (Ellstrand et al., Reference Ellstrand, Prentice and Hancock1999; Ellstrand, Reference Ellstrand2003). The promiscuity of sorghum with its congeners is apparent from the numerous studies which show genetic and/or morphological evidence of crop-to-wild gene flow, especially where the interfertile wild and cultivated sorghums grow sympatrically (Doggett, Reference Doggett1988; Aldrich and Doebley, Reference Aldrich and Doebley1992; Morrell et al., Reference Morrell, Williams-Coplin, Lattu, Bowers, Chandler and Patterson2005; Barnaud et al., Reference Barnaud, Deu, Garine, Chantereau, Bolteu, Koïda, McKey and Joly2009). Understanding farmers' practices is necessary to complement ecological studies (e.g. on pollen dispersal and outcrossing rates), if we are to assess the ecological risk of growing transgenic plants. The impact of formal seed systems may also be discerned from the genetic structure of modern varieties that are commonly planted by the farmers.
The few studies of genetic diversity patterns of sorghum samples collected in situ in ‘traditional’ farming systems reveal a weak regional differentiation (Djè et al., Reference Djè, Forcioli, Ater, Lefèbre and Vekemans1999) and a lack of correlation between environmental factors and diversity patterns (Ayana et al., Reference Ayana, Bryngelsson and Bekele2000; Ghebru et al., Reference Ghebru, Schmidt and Bennetzen2002). Botanical race has been shown to be the main genetic stratifying factor in sorghum landraces from across Niger (Deu et al., Reference Deu, Sagnard, Chantereau, Calatayud, Hérault, Mariac, Pham, Vigouroux, Kapran, Traore, Mamadou, Gerard, Ndjeunga and Bezançon2008) followed by geographical distribution. In a localized study of the genetic structure of sorghum landraces from a single village in Cameroon, Barnaud et al. (Reference Barnaud, Deu, Garine, McKey and Joly2007) found a substantial and significant differentiation among landraces that are commonly mix-planted. These authors suggested that historical factors, differences in mating system and farmers' practices played significant roles in shaping the genetic structure of the studied landraces. In a follow-up study, Barnaud et al. (Reference Barnaud, Trigueros, McKey and Joly2008) found that high outcrossing rates could explain the low genetic differentiation among some landraces, while cleistogamy and pollen competition could explain the significant differentiation of other landraces. The present work is intended to complement and build upon the findings of the previous studies by simultaneous analyses of the genetic structure of sorghum landraces, as well as of that of widely adopted modern varieties, in two countries.
The objectives of this study were: (1) to characterize genetic structure of the most popular sorghum varieties from two different agroecosystems, the Lake Victoria basin region of western Kenya and eastern Sudan, using simple sequence repeats (SSRs); (2) to relate the results on genetic structure to agricultural practices of the farmers, particularly concerning the size of their land holdings, the number of varieties they plant, the presence or absence of isolation practices and their seed systems; (3) to derive recommendations concerning the deployment of improved varieties and of transgenic crops in the study areas, with regard to the maintenance of varietal integrity (particularly that of modern varieties) and the ecological risks of GM gene spread, respectively.
Materials and methods
Study regions
Field survey and sample collection were carried out in conjunction with Kenya Agricultural Research Institute in Kenya and Agricultural Research and Technology Corporation (ARTC) in Sudan. Kenya produced about 147,365 metric tons (MT) of sorghum in 2007, of which about 70% was produced in western Kenya, where land fragmentation is high and average field size is < 0.5 ha (Ngugi et al., Reference Ngugi, King, Abayo and Reddy2002). Most farmers in western Kenya cultivate landraces and use farm-saved seeds. Still, our field survey indicated that an estimated 15% of these farmers plant modern varieties.
Sudan is the fourth highest producer of sorghum in the world, with about 5,840,000 MT in 2007 (FAOSTAT, 2009). Eastern Sudan is considered as the main ‘breadbasket’ of the country. Small-scale subsistence farmers have land holdings of 2–5 ha (Ayoub, Reference Ayoub1999). In addition, large-scale, mechanized farming is mainly practised in the clay plains of eastern Sudan, particularly in Gadaref and in Damazin, with land holdings of 420 ha or larger. Modern varieties are widely adopted in irrigated areas of Sudan.
Plant material
In December 2006, we collected seed samples of sorghum varieties (n = 49 and 45) from farmer households in eastern Sudan and western Kenya, respectively (Fig. 1). Each farmer was asked to provide seed samples of all the varieties that they cultivated. Sampling locations were ascertained using global positioning system co-ordinates. Of these, a subset of 23 samples per country was selected for genotyping (Supplementary Table S1, available online only at http://journals.cambridge.org). Information on farming practices was collected in the form of questionnaire interviews. Specifically, farmers were asked about their field sizes, source of seeds, number and names of varieties cultivated and whether they practised varietal isolation. The most common modern varieties and landraces from both the countries were used for molecular marker analyses. In order to minimize chances of multiple sampling of the same plant, seeds were collected from at least 30 different individual plants per field or from what farmers had stored aside as planting material for the next season.

Fig. 1 Sampling locations in (a) Kenya and (b) Sudan.
DNA extraction and SSR genotyping
DNA was isolated from 24 individual seedlings per sample. Seeds were set to germinate in the laboratory at room temperature using normal garden soil, and DNA was extracted from an approximately 5-cm long piece of leaf tissue of 2-week-old individual seedlings using a modified CTAB protocol (Mace et al., Reference Mace, Buhariwalla and Crouch2003). Concentration and quality of the DNA were assessed using a Nanodrop 1000® spectrophotometer and electrophoresis of 1 μl on 0.7% agarose gel followed by normalization of the concentration at 25 ng/μl.
A set of 16 sorghum SSR markers was used for genotyping (Table 1). They were developed and characterized by Brown et al. (Reference Brown, Hopkins, Mitchell, Senior, Wang, Duncan, Gonzalez Candelas and Kresovich1996) and Taramino et al. (Reference Taramino, Tarchini, Ferrario, Lee and Pe1997) – Sb series; Schloss et al. (Reference Schloss, Mitchell, White, Kukatla, Bowers, Paterson and Kresovich2002) – Xcup series; and Bhattramaki et al. (Reference Bhattramakki, Dong, Chhabra and Hart2000) and Menz et al. (Reference Menz, Klein, Mullet, Obert, Unruh and Klein2002) – Xtxp series. Forward primers were labelled with FAM, HEX, NED or PET, allowing post-PCR pooling of the 16 primer products into four groups. High-throughput PCR in 10-μl reaction volume was carried out as described by Folkertsma et al. (Reference Folkertsma, Rattunde, Chandra, Raju and Hash2005b). Between 0.5 and 1 μl of PCR products of the differently labelled primers were multiplexed in 7 μl of HiDi™ formamide and ROX-labelled GeneScan-500 LIZ™, size standard (0.012 μl) solution. Amplified DNA fragments were denatured and size-fractioned using capillary electrophoresis on an ABI Prism 3730 genetic analyzer automatic DNA sequencer (PE-Applied Biosystems, Foster City, CA, United States). Fragment sizes were determined based on migration relative to the internal size standard using GENEMAPPER version 3.0 software (ABI). The standard genotype ‘BTX 623’ was run together with the samples on each sample plate to confirm reproducibility of allele sizing.
Table 1 Linkage group (LG), type, number of alleles (A) and polymorphic information content (PIC) of the simple sequence repeat markers in the Sudanese, Kenyan and combined set of samples

Standard deviation estimated by 10,000 bootstraps.
a Kim et al. (Reference Kim, Klein, Klein, Price, Mullet and Stelly2005).
b Marker location (expressed sequence tags (ESTs)).
Data analyses
Diversity statistics
All SSR markers showed high reproducibility and were included in the analysis. Standard diversity statistics of mean number of alleles per locus (A); gene diversity (D), also referred to as expected heterozygosity; and polymorphism information content (PIC) were computed. All statistics were calculated using PowerMarker software (Liu and Muse, Reference Liu and Muse2005). Gene diversity at the lth locus was computed as (Weir, Reference Weir1996):
where P i is the frequency of allele i and F IS is the population inbreeding coefficient.
The PIC of the lth locus, which is closely related to D l, provides an estimate of the discriminatory power of a locus, and it was estimated according to Botstein et al. (Reference Botstein, White, Skolnick and Davis1980):
where P i and P j are the frequencies of alleles i and j, respectively. Furthermore, allelic richness (A e), a measure of the number of alleles independent of sample size, was calculated for each variety (since the sample sizes were different). This was implemented in the software FSTAT (Goudet, Reference Goudet1995).
Analysis of population structure
Pattern of genetic structure was assessed by three complementary approaches: a Bayesian clustering method; principal co-ordinate analysis (PCoA); and analysis of molecular variance (AMOVA). We used the Bayesian clustering method implemented in the software STRUCTURE 2.2 (Pritchard et al., Reference Pritchard, Stephens and Donnelly2000), which places individual genotypes in K clusters that have distinct marker frequencies, with K being chosen in advance. We used the basic admixture model with uncorrelated allele frequencies, and varied K from 1 to 10 with at least five replicates per K, a burning period length of 105 iterations, and 105 iterations for the post-burning Markov chain convergence. The most appropriate number of clusters (K) was selected employing the method of Evanno et al. (Reference Evanno, Regnaut and Goudet2005), which is based upon an ad hoc quantity (ΔK) that evaluates a second-order rate of change. Since strongly linked loci lead to spurious clustering (Kaeuffer et al., Reference Kaeuffer, Réale, Coltman and Pontier2007), only loci that were more than 10 cM apart were used in this study.
A PCoA, which summarizes the variance of multivariate datasets into trends of maximum relevance known as principal components (PCs), was computed from a matrix of pair-wise genetic dissimilarities (measured as 1 – proportion of shared alleles) between individuals calculated by the software DARwin5 (Perrier et al., Reference Perrier, Flori, Bonnot, Hamon, Seguin, Perrier and Glaszmann2003). For the STRUCTURE analysis and PCoA, we made three assumptions:
(1) If farmers are acquiring seed samples of a particular modern variety from a formal system, then these seed samples should have a high level of homogeneity and form a distinct cluster.
(2) A landrace is more heterogeneous than a modern variety. Yet, seed samples of different landraces may form distinct clusters in the absence of gene flow between them.
(3) Extensive seed exchange between farmers or strong pollen migration among neighbouring varieties prevents clustering of seed samples.
A three-tier nested AMOVA was conducted to quantify the distribution of genetic variation between the countries, among varieties within countries and within varieties, using Arlequin 2.0 (Excoffier et al., Reference Excoffier, Laval and Schneider2005). Samples showing intermediate ancestry as portrayed by STRUCTURE were excluded from this analysis.
Spatial pattern of genetic structure was assessed by isolation by distance (IBD) software. Values for pair-wise genetic differentiation (F ST) were regressed on the logarithm of geographical distance between populations. The Mantel test was used to test the independence of matrices using IBD software (Bohonak, Reference Bohonak2002).
Results
Occurrence of varieties
According to the interviews, farmers in the study area of eastern Sudan planted 11 varieties, with the modern varieties of Wad-Ahmad and Tabat accounting for 19 and 7% of the collected samples, respectively. The most common landraces were Arfa-Gadamak, Karakola and Gadam-el-Hamam representing 23, 10 and 8% of the collected samples, respectively. The remaining varieties ranged from 1 to 6%. On average, individual farmers cultivated 2.5 (range 1–4) varieties in Sudan. The eastern Sudanese farmers usually had large acreages, and most of them practised varietal isolation. Some of these farmers mentioned farm sizes of up to 1050 ha, while the largest field size mentioned in western Kenya was only 10 ha, and the majorities were 1 ha or less (Supplementary Table S1, available online only at http://journals.cambridge.org). Most farmers in western Kenya cultivated landraces, and farm-saved seeds were found to be the major source of planting material in this region. On average, two varieties were grown per farmer's field (range 1–5). About 37% of these farmers grew only one variety. Eight varieties were frequently mentioned by farmers in western Kenya. Of the samples collected from these farmers, 20% were Ochuti, while Gopari and Andiwo accounted for 18 and 10%, respectively. About 15% of these farmers grew the modern variety Seredo. The frequencies of the remaining four varieties were lower than 8%.
Molecular diversity
The 16 SSR markers revealed a total of 185 alleles, with an average of 11.6 alleles per locus in the entire dataset (Table 1), and 8.8 (range 2–22) and 6.9 (range 2–17) alleles per locus for the Sudanese and the Kenyan set, respectively. The 16 SSRs showed similar pattern of variation in terms of the number of alleles per locus [Pearson product–moment correlation coefficient (r) = 0.92; t = 8.21, P < 0.01]. A mean PIC per locus of 0.61 was found for the entire dataset ranging from 0.44 to 0.88 when the relatively conserved expressed sequence tag (EST)-derived markers Xcup62 (PIC = 0.17) and Xcup53 (PIC = 0.33) were neglected. The PIC values were not significantly different between the Sudanese and Kenyan datasets (0.51 and 0.44, respectively).
Comparison of the genetic variation within seed samples collected from individual farmers showed no significant differences in the number of alleles per locus (t = − 1.053, P = 0.30). The respective A values for Sudan and Kenya were 2.41 (SD = 0.61) and 2.24 (0.55; Table 2). Similarly, the respective average gene diversities (D) were 0.22 and 0.20. However, both the statistics (A and D) varied widely among samples within countries. It is worth mentioning that samples with low genetic heterogeneity, particularly Wad-Ahmad samples 15–18, show low levels of allelic diversity compared with those with heterogeneous ancestry (samples 20, 21 and 23).
Table 2 Mean number of alleles per locus (A) and gene diversity (D) of individual and pooled sorghum samples from western Kenya and eastern Sudan based on 16 SSR markers

a n = 24 for all samples.
b Cultivar abbreviations: AG, Arfa-Gadamak; GO, Gopari; AND, Andiwo; KK, Karakola; OCH, Ochuti; WA, Wad-Ahmad; SER, Seredo.
c Landraces: AG, KK, GO and OCH; modern varieties: WA and SER.
d Allelic richness was calculated in order to compensate for the differences in the sample sizes.
Diversity analyses of pooled samples revealed minor differences between varieties for allelic richness and gene diversity (Table 2). Highly admixed samples as revealed by STRUCTURE analysis and PCoA were excluded from variety grouping in order to avoid false high diversity estimates resulting from Wahlund's ‘isolate breaking’ effect (Lowe et al., Reference Lowe, Harris and Ashton2004).
Inter-variety differentiation and genetic structure
The seven varieties studied formed groupings based on the country of origin (Supplementary Fig. S1, available online only at http://journals.cambridge.org). At the country level, the model-based clustering implemented in the software STRUCTURE indicated that the most appropriate numbers of genetically distinct groups (K) for Kenya and Sudan were 2 and 3, respectively (Fig. 2(a) and (b), respectively). At higher K values, the populations did not show consistent clustering even after multiple runs at the same K level. Populations from Kenya formed only two groups (Fig. 2(b)) consisting of the modern variety Seredo in one cluster and all the landraces in the other. Interestingly, the Kenyan landraces clustered neither by name nor by morphology. Seed admixture was detected between the variety Seredo and the landrace Gopari (sample 10). Populations from Sudan are split into the groups Wad-Ahmad, Karakola and Arfa-Gadamak. A high level of heterogeneous ancestry (i.e. multiple cluster assignments) was detected in populations 7, 8, 9 and 22 at K = 3, indicating possible gene flow between the respective varieties.

Fig. 2 STRUCTURE analysis of 23 sorghum seeds samples from (a) eastern Sudan and (b) western Kenya genotyped with 16 SSRs. Each vertical line represents an individual. Individuals are clustered by sample number (at bottom), and samples are clustered by variety name (at top). Black and grey represent the inferred ancestry from K populations.
The genetic structure was also studied by PCoA. Traditional two-dimensional scatter plots were used to demonstrate global relationship between the varieties, while box plots were used to demonstrate the fine-scale variation within and among individual samples. Consistent with the STRUCTURE results, global clustering pattern of PCoA of the Kenyan samples revealed two groups consisting of the modern variety Seredo and the landraces Fig. S2(a), available online only at http://journals.cambridge.org). The first four principal co-ordinates together accounted for 45% of the extracted variation. Strikingly, the individuals of the modern variety Seredo formed a largely heterogeneous cluster. The differently named Kenyan landraces widely overlapped, indicating insufficient genetic differentiation to resolve them into distinct clusters. Juxtaposition of box plots of the first four PCs, however, indicated subtle differentiations among these landraces (Fig. 3(b)). The second PC distinguished most of the Ochuti samples from those of the other landraces, while PC3 and PC4 only revealed minor differences between Gopari and the other landraces (Fig. 3(a)). Moreover, a high level of genetic heterogeneity was detected among individual samples, particularly within landrace Ochuti and modern variety Seredo. The global clustering pattern of PCoA of the Sudanese sample recapitulated the STRUCTURE results and clearly identified three groups, corresponding to the modern variety Wad-Ahmad and landraces Arfa-Gadamak and Karakola (Supplementary Fig. S2(b), available online only at http://journals.cambridge.org). Individual box plots showed genetic heterogeneity among the individual samples, particularly within the landraces (Fig. 3(a)). The first four co-ordinates (PC1–PC4) together accounted for 53% of the extracted variation. The samples of the modern variety Wad-Ahmad (15–19) remained largely intact and mapped very closely together. Mixed seed samples (samples 7, 8, 22 and 23) clustered in between their constituent varieties.

Fig. 3 Box plots of PCoA for the first four principal co-ordinates (PC1–PC4) in (a) Sudanese and (b) Kenyan sorghum samples. Numbers 1–23 represent sample identities. The rectangular part of the plot extends from the lower quartile to the upper quartile of intra-sample variation. The centre lines within each box indicate the medians, whiskers indicate the 95% confidence interval and plus signs indicate the means. 1AG, Arfa-Gadamak; KK, Karakola; WA, Wad-Ahmad; GOP, Gopari; AND, Andiwo; OCH, Ochuti; SER, Seredo.
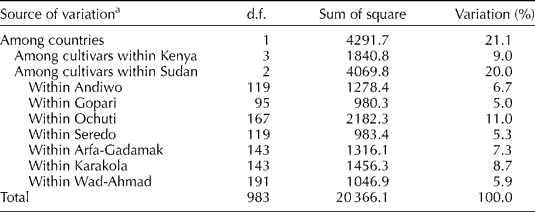
Hierarchical AMOVA reiterated the results of STRUCTURE analysis and PCoA, and showed that varieties were mainly structured by the country of origin (21%; Table 3). Differentiation among varieties accounted for 20% of the total variation in Sudan, but only for 9% in Kenya. At the within-variety level, Ochuti from Kenya had the highest level of molecular variance (11%), while Gopari accounted for 5% of the total variation.
Table 3 Analysis of molecular variance with 16 SSRs in the sorghum samples from eastern Sudan and western Kenya
d.f., Degrees of freedom.
a All items were significant (P = 0.001).
A Mantel test showed that no significant correlation existed between pair-wise genetic differentiation (F ST) and the geographic distance in either of the two countries' samples.
Discussion
Genetic diversity
The field surveys of our study showed that farmers in both the countries grow a large number of sorghum landraces though no individual farmer grows all the varieties. The estimated average of 8 and 11 varieties in the study regions of western Kenya and eastern Sudan, respectively, is slightly higher than that reported for Niger (6, Deu et al., Reference Deu, Sagnard, Chantereau, Calatayud, Hérault, Mariac, Pham, Vigouroux, Kapran, Traore, Mamadou, Gerard, Ndjeunga and Bezançon2008), but is much smaller than that reported for a single village in northern Cameroon (46, Barnaud et al., Reference Barnaud, Deu, Garine, McKey and Joly2007). The large number of landraces grown in a restricted region underscores the importance of farmers in conservation of crop genetic resources. Farmers plant multiple varieties to serve their diverse needs, as well as to lower the risk of crop failure owing to biotic and abiotic constraints. In Ethiopia, Teshome et al. (Reference Teshome, Baum, Fahrig, Torrance, Arnason and Lambert1997) showed an average of 9.75 landraces per field. Barnaud et al. (Reference Barnaud, Deu, Garine, McKey and Joly2007) recorded an average of 12 landraces per field in a single village in Cameroon.
The 16 SSR marker loci used in this study revealed considerable allelic diversity. The level of gene diversity uncovered is similar to that in other SSR-based studies of in situ collected sorghum in Niger (Deu et al., Reference Deu, Sagnard, Chantereau, Calatayud, Hérault, Mariac, Pham, Vigouroux, Kapran, Traore, Mamadou, Gerard, Ndjeunga and Bezançon2008), Cameroon (Barnaud et al., Reference Barnaud, Deu, Garine, McKey and Joly2007) and South Africa (Uptmoor et al., Reference Uptmoor, Wenzel, Friedt, Donaldson and Ayisi2003), but is slightly lower than the estimates from Morocco reported by Djè et al. (Reference Djè, Forcioli, Ater, Lefèbre and Vekemans1999) and from Eritrea reported by Ghebru et al. (Reference Ghebru, Schmidt and Bennetzen2002). However, it should be noted that the above-quoted studies encompassed large numbers of varieties, while in the present study, only the most common varieties from western Kenya and eastern Sudan were analysed. Furthermore, direct comparisons of genetic diversity between in situ studies are difficult, since estimates depend on factors such as seed sampling scheme and the number and characteristics of the markers employed (Deu et al., Reference Deu, Sagnard, Chantereau, Calatayud, Hérault, Mariac, Pham, Vigouroux, Kapran, Traore, Mamadou, Gerard, Ndjeunga and Bezançon2008). For instance, microsatellites derived from ESTs were generally less polymorphic than genomic SSRs. In our study, 7 of the 16 SSR markers were derived from ESTs. On average, the latter had 6 alleles per locus compared with 15.5 for the genomic SSRs. The PIC values found here are similar to the estimates reported by other authors (Smith et al., Reference Smith, Kresovich, Hopkins, Mitchell, Dean, Woodman, Lee and Porter2000; Folkertsma et al., Reference Folkertsma, Rattunde, Chandra, Raju and Hash2005b). Due to high PIC values of our markers, their discriminatory power can be considered adequate for the present purpose. The mean intra-sample genetic diversity per locus was similar in both the countries, suggesting that farmers maintain similar levels of on-farm diversity. However, the sample from Sudan had slightly higher overall marker diversity values, which may be attributed to Sudan's location at the centre of diversity of sorghum (Doggett, Reference Doggett1988).
Farmers' practices and genetic structure
Genetic structure analysed by different approaches (STRUCTURE, PCoA and AMOVA) revealed contrasting patterns in the Kenyan and Sudanese study regions. The clear differentiation among the three most common Sudanese varieties confirmed the results obtained by Abu Assar et al. (Reference Abu Assar, Uptmoor, Abdelmula, Salih, Ordon and Friedt2005) with SSR markers. The failure by STRUCTURE, and to a lesser extent by PCoA, to resolve the Kenyan landraces is due to their low degree of differentiation as shown by the AMOVA results. The lack of genetic resolution among these common landraces by the neutral SSR markers may be due to extensive gene flow among them that is abetted by the mixed-planting of different varieties that is widely practised by the majority of farmers in western Kenya. Furthermore, different varieties often grow side by side to form a mosaic pattern even though the farmers plant single varieties due to the highly fragmented agricultural landscape of western Kenya with an average field size of less than 0.5 ha. In a parallel study, we found that extensive pollen-mediated gene flow occurs up to 10 m in sorghum (Rabbi et al., Reference Rabbi, Parzies, Kiambi, Haussmann, Folkertsma and Geiger2010). On the other hand, varietal isolation practised by Sudanese farmers could explain the genetic distinctness among the different varieties. Lack of genetic differentiation among landraces that are commonly mix-planted has been documented by Barnaud et al. (Reference Barnaud, Deu, Garine, McKey and Joly2007) in Cameroon. These landraces were subsequently shown to have a relatively high outcrossing rate of up to 40% (Barnaud et al., Reference Barnaud, Trigueros, McKey and Joly2008).
The lack of a clear differentiation among the differently named Kenyan landraces (Supplementary Fig. S2, available online only at http://journals.cambridge.org) suggests that they can be considered as a single gene pool. However, the Kenyan landraces are morphologically distinct, despite the weak molecular genetic differentiation observed in our study. For instance, Ochuti plants are mainly red seeded, while Andiwo and Gopari bear light-brown seeds. Conservative selection by farmers for visually assessable traits in sorghum may be responsible for morphological identity despite high gene flow among them. The practice of conservative selection has been documented for sorghum (Alvarez et al., Reference Alvarez, Garine, Khasah, Dounias, Hossaert-McKey and McKey2005; Barnaud et al., Reference Barnaud, Deu, Garine, McKey and Joly2007) and maize (Pressoir and Berthaud, Reference Pressoir and Berthaud2004).
A closer look at the clustering provided by STRUCTURE (Fig. 2) reveals different degrees of hybridization between certain sorghum varieties in western Kenya and eastern Sudan. In Sudan, hybridization seems to occur between variety Wad-Ahmad and each of the two landraces (Arfa-Gadamak and Karakola), but rarely between the two landraces themselves. This migration pattern may be explained by the fact that the modern variety Wad-Ahmad excels in many farmer-preferred traits, and therefore has a higher chance of being admixed to farmers' landraces. The farmers who provided some of these intermediate samples (7–9 and 23) mentioned that they have been using farm-saved seeds for 4–8 years. They had probably planted Wad-Ahmad close to or mixed with their preferred landraces for several generations. This means that not all Sudanese farmers practise varietal isolation, and that some have practices similar to those of the western Kenyan farmers.
Impacts of formal and informal seed systems in the observed genetic structure
Gene flow is expected to decrease with geographic distance. Results of the Mantel test showed a lack of correlation between pair-wise genetic differentiation (F ST) and geographical distance, suggesting long-distance exchange of genetic materials between farmers in both Sudan and Kenya. The directionality of seed exchange is difficult to trace, and merits further investigation. However, the impact of the formal seed sector is easy to detect from the genetic structure of the analysed samples of modern varieties: seeds from the formal sector are expected to show a high level of homogeneity. This is confirmed by the clustering pattern of samples of the Sudanese modern variety Wad-Ahmad (15–20; PCoA; Fig. 3(b)). Farmers who provided these samples mentioned that they had obtained the seeds from the formal seed sector of Sudan (Supplementary Table S1, available online only at http://journals.cambridge.org). In contrast, samples of variety Seredo from western Kenya formed a relatively loose cluster. Indeed, most western Kenyan subsistence farmers do not regularly purchase fresh seeds from the formal seed sector. Furthermore, the Seredo is usually incorporated into the local germplasm and is commonly planted alongside the landraces. This process has previously been documented for maize cultivated in Mexico by subsistence farmers and is referred to as ‘creolization’ (Bellon and Brush, Reference Bellon and Brush1994). Under this process, intensive gene flow occurs between modern varieties and farmers' landraces. Consequently, in the course of time, newly introduced modern varieties will change from a rather uniform structure to a heterogeneous structure.
Implications for maintenance of varietal integrity and deployment of transgenic sorghum
Farmers' seed management in principle could be used for the distribution of modern varieties. However, maintaining varietal purity is difficult in such a system. In an ongoing research project, farmer-preferred landraces from various African countries are being improved for important traits such as resistance against Striga hermonthica (Folkertsma et al., Reference Folkertsma, Haussmann, Parzies, Hoffmann and Geiger2005a) and against drought (Borrel et al., Reference Borrell, Tao and McIntyre1999). The future stability of these introgressed traits depends on minimizing intercrossing with non-modern varieties that grow in farmers' diverse fields. Intercrossing would result in recombination and consequently in genetic heterogeneity. According to the results of this study, the risk of compromising genetic purity of modern varieties is greater in western Kenya than under the Sudanese farming system. This risk could even be greater in other regions such as Cameroon and Ethiopia, where about a dozen varieties are grown per farmer's field (Teshome et al., Reference Teshome, Baum, Fahrig, Torrance, Arnason and Lambert1997; Barnaud et al., Reference Barnaud, Deu, Garine, McKey and Joly2007). Though selection based on morphological traits is effective in maintaining identities of particular landraces, it may not be effective for other traits whose phenotypes are not visually discernible. These traits may include quantitative trait loci conferring resistance or tolerance to biotic and abiotic constraints. To counteract this risk, a more active involvement of the formal seed sector is needed. In addition, the outcrossing rate of modern varieties needs to be determined, since frequency of pollen-mediated gene flow is primarily determined by pollen load of a donor and outcrossing rates of a pollen recipient (Lu and Yang, Reference Lu and Yang2009). If a newly introduced modern variety has a low outcrossing rate, farmers can re-plant it for several seasons without much deterioration of genetic integrity.
This study offers a ‘preview’ on the frequency of potential hybridization between GM and non-GM sorghum under contrasting seed management and farming systems. Like the modern varieties analysed in this study, GM genes are likely to spread more rapidly in the germplasm of western Kenya than in that of eastern Sudan due to lack of spatial isolation between different varieties that are often mix-planted. Nonetheless, this risk also exists in Sudan, since some of the farmers follow practices similar to those of their Kenyan counterparts, and their seed samples documented hybridization between the modern variety Wad-Ahmad and the two landraces studied.
Acknowledgements
This research was funded by Bundesministerium für Zusammenarbeit, Bonn. The first author was sponsored by Deutscher Akademischer Austauschdienst, and he carried out the study as part of his PhD thesis. The authors thank Dr Mohamed Abdalla, ARTC, Wad-Medani, for organizing the field work in Sudan. Laboratory assistance of Baireddy Chiranjeevi Reddy is gratefully acknowledged. The authors thank the reviewers who provided tremendous help through important, accurate and constructive suggestions for improving this manuscript.


