Introduction
Soybean (Glycine max) protein content is one of the most important traits targeted by many breeding programmes. It is primarily controlled by quantitative trait loci (QTLs) (Diers et al., Reference Diers, Keim, Fehr and Shoemaker1992). Although phenotypic selection for high protein content in traditional breeding is usually successful (Wang et al., Reference Wang, Meng, Yang, Zhao and Wu1986; Chung et al., Reference Chung, Babka, Graef, Staswick, Lee, Cregan, Shoemaker and Specht2003), marker-assisted selection (MAS) is considered to be an efficient method (Chapman et al., Reference Chapman, Pantalone, Ustun, Allen, Landau-Ellis, Trigiano and Gresshoff2003). In the past few decades, 141 QTLs associated with soybean protein content have been discovered (http://www.soybase.org; Diers et al., Reference Diers, Keim, Fehr and Shoemaker1992; Lee et al., Reference Lee, Bailey, Mian, Carter, Shipe, Ashley, Parrott, Hussey and Boerma1996; Brummer et al., Reference Brummer, Graef, Orf, Wilcox and Shoemaker1997; Orf et al., Reference Orf, Chase, Jarvik, Mansur, Cregan, Adler and Lark1999; Sebolt et al., Reference Sebolt, Shoemaker and Diers2000; Csanádi et al., Reference Csanádi, Vollmann, Stift and Lelley2001; Chapman et al., Reference Chapman, Pantalone, Ustun, Allen, Landau-Ellis, Trigiano and Gresshoff2003; Chung et al., Reference Chung, Babka, Graef, Staswick, Lee, Cregan, Shoemaker and Specht2003; Fasoula et al., Reference Fasoula, Harris and Boerma2004; Hyten et al., Reference Hyten, Pantalone, Sams, Saxton, Landau-Ellis, Stefaniak and Schmidt2004; Panthee et al., Reference Panthee, Pantalone, West, Saxton and Sams2005; Nichols et al., Reference Nichols, Glover, Carlson, Specht and Diers2006; Jun et al., Reference Jun, Van, Kim, Lee and Walker2008). Compared with QTLs associated with protein content, more QTLs associated with oil content are found in SoyBase. Most of the populations of G. max× G. max have been found to exhibit a negative correlation between protein and oil content (Diers et al., Reference Diers, Keim, Fehr and Shoemaker1992), except Young × PI 416937 (Lee et al., Reference Lee, Bailey, Mian, Carter, Shipe, Ashley, Parrott, Hussey and Boerma1996). Some of the QTLs increasing protein content have been found to be not associated with decreasing oil content (Lee et al., Reference Lee, Bailey, Mian, Carter, Shipe, Ashley, Parrott, Hussey and Boerma1996). In other cases, QTLs have been found to increase both protein and oil contents (Qiu et al., Reference Qiu, Arelli and Sleper1999). Although wild soybean is a potential resource for soybean improvement (Wang et al., Reference Wang, Shoemaker, Arelli and Diers2001, Reference Wang, Graef, Procopiuk and Diers2004; Concibido et al., Reference Concibido, La Vallee, Mclaird, Pineda, Meyer, Hummel, Yang, Wu and Delannay2003; Hyten et al., Reference Hyten, Song, Zhu, Choi, Nelson, Costa, Specht, Shoemaker and Cregan2006; Liu et al., Reference Liu, Fujita, Yan, Sakamoto, Xu and Abe2007; Winter et al., Reference Winter, Shelp, Anderson, Welacky and Rajcan2007; Li et al., Reference Li, Pfeiffer and Cornelius2008a; Kim et al., Reference Kim, Diers, Hyten, Rouf Mian, Shannon and Nelson2012), only one population of Glycine max× Glycine soja has been used for mapping protein content (Diers et al., Reference Diers, Keim, Fehr and Shoemaker1992). This may be due to undesirable traits such as small seed size, shattering and viny growth in G. soja and labour consuming for management.
The objectives of this study were to map QTLs controlling the protein content in two populations derived from crosses between two G. max cultivars and one G. soja accession and to determine the genetic effect of these QTLs. The results of this study will be helpful for soybean improvement using MAS.
Materials and methods
Two high-protein content varieties and a G. soja accession were used as parents. Jidou 12 (mature group II) derived from Mengcheng 6/Clark//Tian'edan/Zhilibaimao and Jidou 9 (mature group III) derived from Tie 7533//Niumaohuang/Williams. ZYD2738, a G. soja accession, was collected in Chengde. Eighty-three F2 plants derived from Jidou 12 × ZYD2738 (dubbed J12) and 219 F2 plants derived from Jidou 9 × ZYD2738 (dubbed J9) were self-pollinated to obtain F2:3 populations. The F2:3 and parent plants were grown in a randomized complete-block design with three replicates, at Dishang Experimental Station, Hebei, China, during the summer of 2009. Approximately 20 g of seeds were ground with a standard coffee grinder and passed through a 35-mesh screen. Samples weighing around 0.5 g were used to measure protein content using the Kjeldahl method (Hymowitz et al., Reference Hymowitz, Dudley, Collins and Brown1974; Wolf et al., Reference Wolf, Cavins, Kleiman and Black1982) with the nitrogen conversion factor of 6.25.
The DNA of F2 plants was extracted using the Tiangen DNA Quick Plant System (TIANGEN Biotech, Beijing, China). Based on the consensus linkage map (Song et al., Reference Song, Marek, Shoemaker, Lark, Concibido, Delannay, Specht and Cregan2004), well-distributed polymorphic simple sequence repeat (SSR) markers were selected and used to analyse the populations. Polymerase chain reactions were carried out using the method described by Li et al. (Reference Li, Guan, Liu, Ma, Wang, Li, Lin, Luan, Chen, Yan, Guan, Zhu, Ning, Smulders, Li, Piao, Cui, Yu, Guan, Chang, Hou, Shi, Zhang, Zhu and Qiu2008b).
Heritability was estimated as follows:
where h
2 represents heritability,
![]() $$\sigma _{g}^{2} $$
is the genetic variance,
$$\sigma _{g}^{2} $$
is the genetic variance,
![]() $$\sigma _{e}^{2} $$
is the error variance and r is the number of replications (Funatsuki et al., Reference Funatsuki, Kawaguchi, Matsuba, Sato and Ishimoto2005). Linkage analysis was carried out using the MapManager program QTXb17 (http://mapmgr.roswellpark.org). The candidate QTLs were identified by composite interval mapping using Windows QTL Cartographer version 2.5 (Wang et al., Reference Wang, Basten and Zeng2007). A QTL was considered to exist at a position where the logarithm of the odds (LOD) score exceeded the empirical threshold based on 1000 permutations (Churchill and Doerge, Reference Churchill and Doerge1994).
$$\sigma _{e}^{2} $$
is the error variance and r is the number of replications (Funatsuki et al., Reference Funatsuki, Kawaguchi, Matsuba, Sato and Ishimoto2005). Linkage analysis was carried out using the MapManager program QTXb17 (http://mapmgr.roswellpark.org). The candidate QTLs were identified by composite interval mapping using Windows QTL Cartographer version 2.5 (Wang et al., Reference Wang, Basten and Zeng2007). A QTL was considered to exist at a position where the logarithm of the odds (LOD) score exceeded the empirical threshold based on 1000 permutations (Churchill and Doerge, Reference Churchill and Doerge1994).
Results and discussion
Protein contents in Jidou 12, Jidou 9 and ZYD2738 were 412, 405 and 401 g/kg− 1, respectively. Although the protein contents in these parents were not significantly different, those in the two populations derived from them were normally distributed with transgression. Protein content in J12 plants ranged from 388 to 473 g/kg− 1, with a mean of 418 g/kg− 1 and a standard deviation of 16.1 g/kg− 1. It ranged from 358 to 445 g/kg− 1 in J9 plants, with a mean of 399 g/kg− 1 and a standard deviation of 15.4 g/kg− 1. The heritability of protein content in J12 and J9 plants was 0.80 and 0.76, respectively.
For the analysis of J12 plants, 132 polymorphic SSR markers were used. Three of the markers exhibited significant (P≤ 0.01) segregation distortion. The 132 markers covered a total distance of 1235.7 cM, with an average distance of 10.7 cM between the markers. Four putative protein content QTLs were discovered with LOD scores ≥ 3.6 (Table 1). The QTLs had R 2 estimates ranging from 12.8 to 14.5% and were located on chromosomes 2, 6, 13 and 20. For the analysis of J9 plants, 151 polymorphic markers were used. Six of the markers exhibited significant (P≤ 0.01) segregation distortion. The 151 markers covered a total distance of 1824.7 cM, with an average distance of 10.7 cM between the markers. Four putative QTLs with R 2 estimates ranging from 6.6 to 9.6% were located on chromosomes 2, 13, 18 and 20. Diers et al. (Reference Diers, Keim, Fehr and Shoemaker1992) found that all QTL alleles from G. soja contributed more to increasing protein content compared with those from G. max. In the present study, however, most of the alleles associated with higher protein content derived from G. max, except qPRO_20_1. The identification of positive QTLs from both G. soja and G. max provides an opportunity to integrate different genes for soybean improvement.
Table 1 Quantitative trait loci (QTLs), chromosome locations, linkage markers, and genetic contributions to seed protein content from QTLs identified using composite interval mapping in two F2:3 populations derived from the Glycine max×Glycine soja crosses of Jidou 12×ZYD2738 and Jidou 9×ZYD2738

LOD, logarithm of the odds.
a R 2 is the proportion of phenotypic variance explained by the genotype at the marker locus.
b The unit for the additive and dominance effects of each QTL is 10 g kg− 1.
c The additive effect of each QTL is given as a unit contribution of the G. max allele.
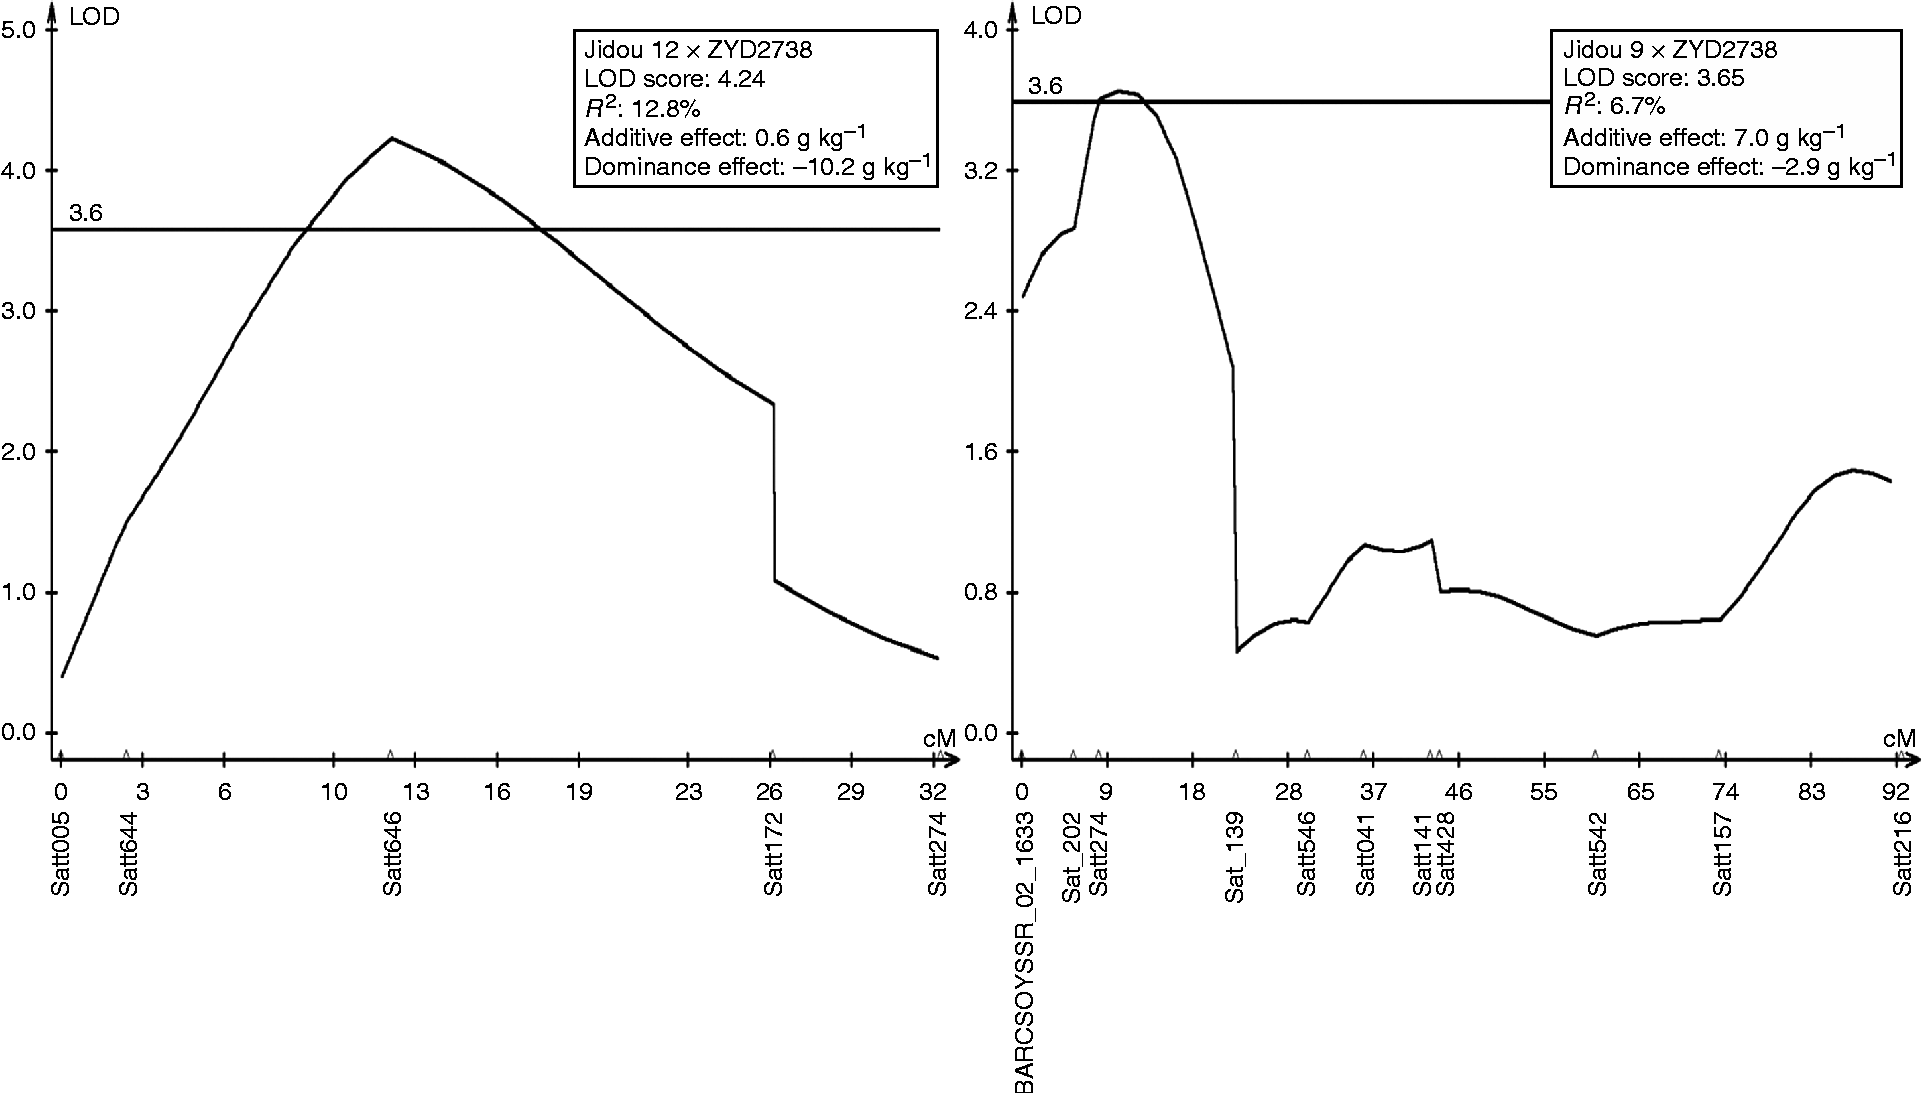
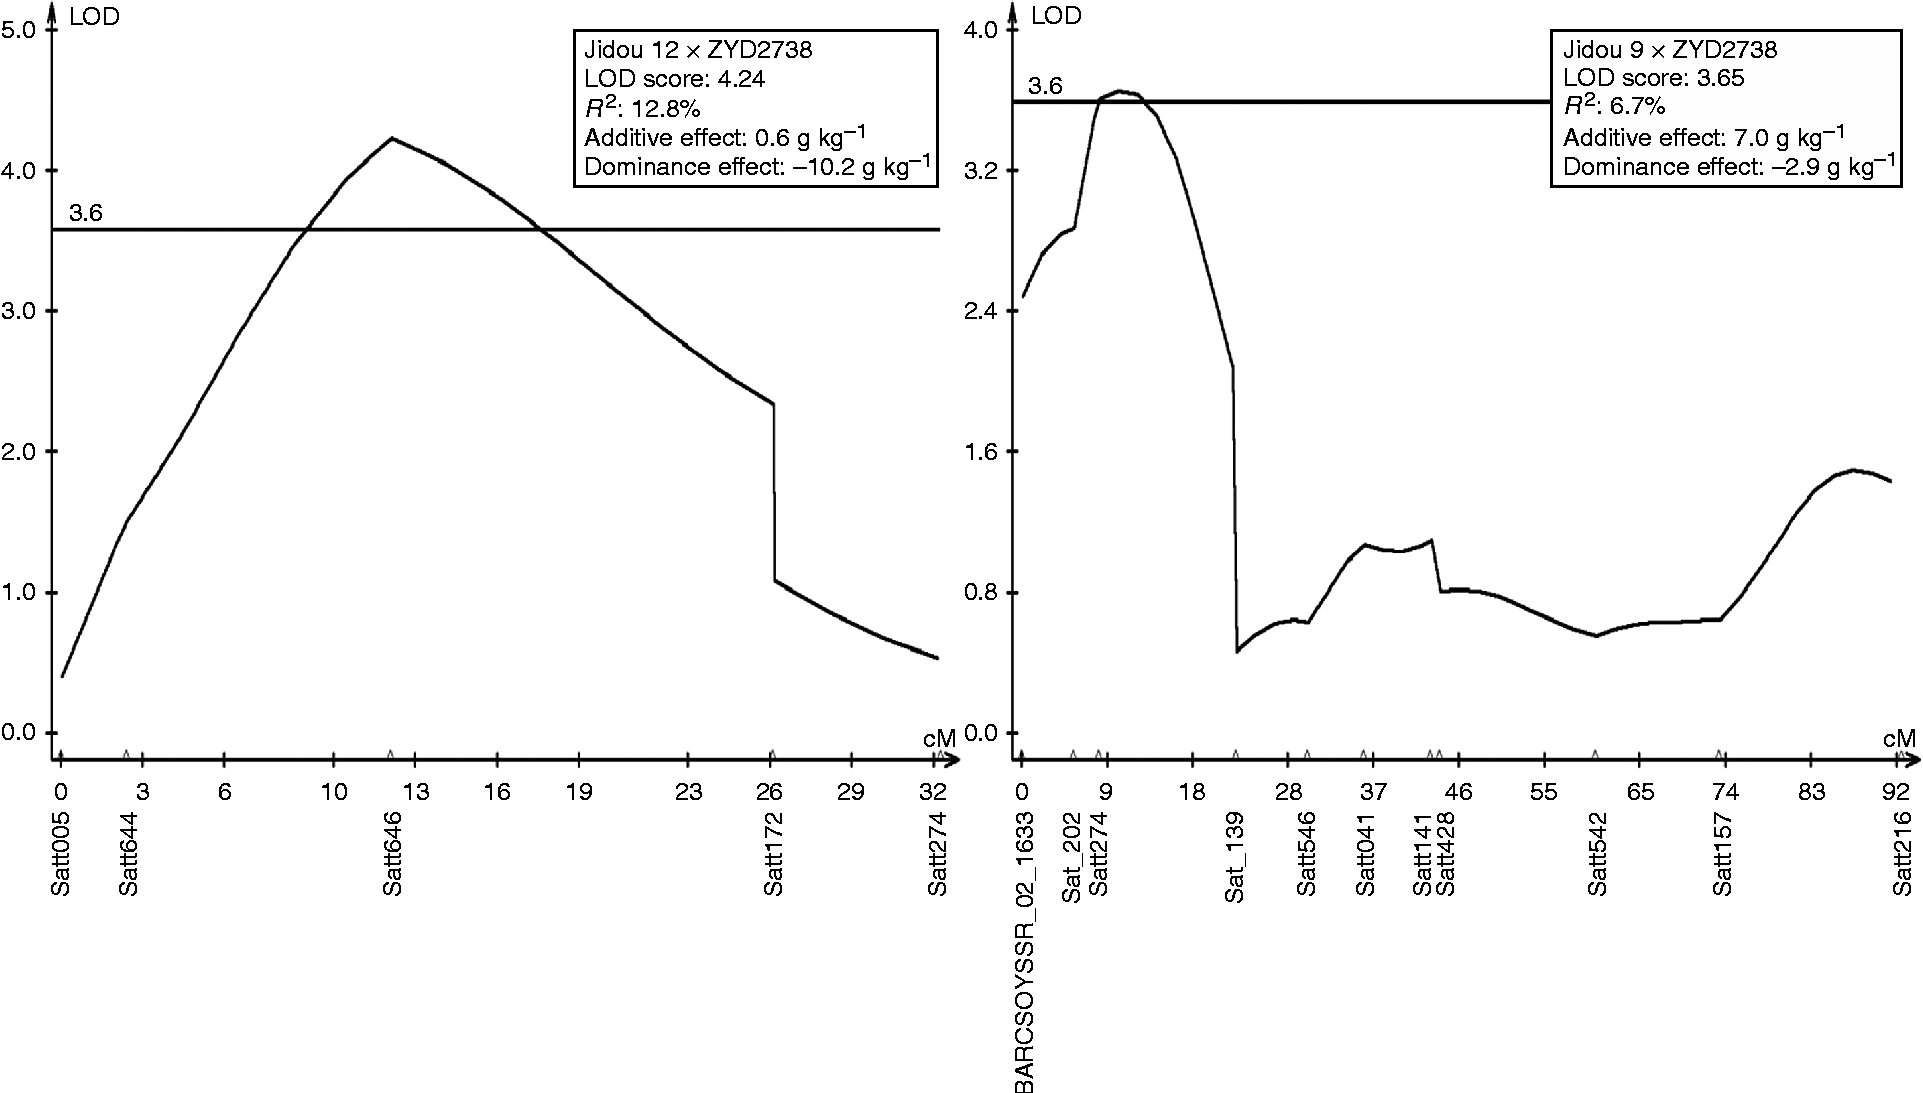
qPRO_2_1 is apparently a novel QTL associated with protein content. In J12 plants, qPRO_2_1 linked with Satt546, the LOD score was 5.81, and the R 2 estimate was 17.5%. In J9 plants, it linked with Satt274, the LOD score was 3.7, and the R 2 estimate was 6.7% (Fig. 1). qPRO_20_1 has been reported in both G. max× G. soja and G. max× G. max populations (Diers et al., Reference Diers, Keim, Fehr and Shoemaker1992; Brummer et al., Reference Brummer, Graef, Orf, Wilcox and Shoemaker1997; Sebolt et al., Reference Sebolt, Shoemaker and Diers2000; Chung et al., Reference Chung, Babka, Graef, Staswick, Lee, Cregan, Shoemaker and Specht2003; Nichols et al., Reference Nichols, Glover, Carlson, Specht and Diers2006; Bolon et al., Reference Bolon, Joseph, Cannon, Graham, Diers, Farmer, May, Muehlbauer, Specht, Tu, Weeks, Xu, Shoemaker and Vance2010; Yesudas et al., Reference Yesudas, Bashir, Geisler and Lightfoot2013), and it was also detected in two populations in this study: linked with Satt239 in J12 plants and with Satt270 in J9 plants. The synteny regions of this QTL on chromosome 10 were compared, and the result indicated that non-shared gene contents within the duplicated genomic regions might lead to the absence/presence of QTLs related to protein content (Lestari et al., Reference Lestari, Van, Lee, Kang and Lee2013). qPRO_13_1, which linked with Satt114, was an over-dominant QTL, because the estimated dominance to the absolute value of additive effect was larger than unity (Yu et al., Reference Yu, Li, Xu, Tan, Gao, Li, Zhang and Saghai Maroof1997). Discovering more QTLs contributing to higher protein content among cultivated and wild soybean populations will be beneficial for increasing protein content by pyramiding genes.

Fig. 1 Logarithm of the odds score plot for qPRO_2_1 in two populations of Jidou 12 × ZYD2738 and Jidou 9 × ZYD2738 in chromosome 2. Genetic positions of the markers are given in centimorgans.
Acknowledgements
This study was financially supported by the National Natural Science Foundation of China (31000719 and 31340043), the State Key Program for National Transgenic Organism New Variety Development (2013ZX08009-003 and 2011ZX08004-002), the 12th Five-Year Plan of China (2011BAD35b06), and the State High-Tech (863) (2012AA101106) and State Key Basic Research and Development Plan of China (973) (2009CB118400), Chinese Crop Germplasm Platform (2012-004).


