


Introduction
Dolichos bean is widely distributed in the Indian subcontinent, Africa and Southeast Asia (Smartt, Reference Smartt1985), where it has been used as a grain legume and vegetable for more than 3500 years (Fuller, Reference Fuller, Neumann, Butler and Kahlheber2003). Despite the wide range of adaptability and diversity, it remains as an underutilized crop in many of these regions (Engle and Altoveris, Reference Engle and Altoveris2000). However, its potential as a vegetable, pulse, forage, cover and green manure crop (Adebisi and Bosch, Reference Adebisi, Bosch, Grubben and Denton2004) and suitability to tropical agricultural production systems (Ebert, Reference Ebert2014) was reported. Being predominantly a self-pollinated crop (Kukade and Tidke, Reference Kukade and Tidke2014) with lack of pollination control systems, pure-line is the only cultivar option in Dolichos bean. Pedigree breeding is the preferred method of developing pure-line varieties in Dolichos bean, as is true in other grain legume crops. Broadening the genetic base and enhancing crop cultivar diversity is the key to attaining sustainable Dolichos bean productivity and production, for which greater use of diverse germplasm is a prerequisite.
University of Agricultural Sciences (UAS), Bengaluru harbours the largest germplasm depository (#648) for Dolichos bean in India (Vaijayanthi et al., Reference Vaijayanthi, Ramesh, Byregowda, Mohan Rao, Keerthi and Marry Reena2015a). To facilitate increased utilization of this diverse germplasm in Dolichos bean improvement programmes, a core set which captures ≥90% of the variability in the whole collection was developed (Vaijayanthi et al., Reference Vaijayanthi, Ramesh, Byregowda, Mohan Rao, Jayarame, Ramappa, Keerthi and Rajendra Prasad2015b) following advanced M-strategy with a heuristic search (Kim et al., Reference Kim, Chung, Cho, Ma, Chandrabalan, Gwag, Kim, Cho and Park2007). The core set is considered as most efficient and reliable source for an initial search of trait-specific accessions, quantitative trait loci (QTLs)/gene discovery, allele mining and as association mapping (AM) panel to explore marker-trait associations (Upadhyaya et al., Reference Upadhyaya, Gowda and Sastry2008; Qiu et al., Reference Qiu, Xing, Guo, Wang, Jackson and Chang2013). Enhancing the pace and efficiency of Dolichos bean breeding for yield and its component traits require the adoption of a well-conceived strategy that hinges on DNA marker-assisted identification and introgression of key genes/QTLs.
Precise information on QTLs controlling economic traits enables effective management of genetic variability for crop improvement. AM is a population-based survey to detect, locate and quantify the contribution of QTLs controlling economic traits variation based on linkage disequilibrium (LD). LD is created through historical multiple recombination events resulting in break up of the genome into fragments (Macky and Powell, Reference Macky and Powell2007). AM exploits high LD persists among alleles at marker loci and those controlling trait variation, thereby enabling reliable mapping of QTLs controlling target traits. Since its introduction to plants (Thorsberry et al., Reference Thorsberry, Goodman, Doeblay, Kresovich, Neilson and Buckler2001), AM is gaining popularity as it offers three advantages; (i) increased mapping resolution, (ii) reduced research time and (iii) captures a greater number of alleles controlling target traits (Yu and Buckler, Reference Yu and Buckler2006). In the present study, we hypothesized that, AM is highly effective in Dolichos bean because LD between two marker alleles and/or between marker alleles and alleles controlling productivity traits extends over long distance driven by self-pollination and lower rate of recombination (1/3 of an obligate out-crossing species) (Nordborg and Donnelly, Reference Nordborg and Donnelly1997), therby requiring fewer markers for exploring marker-trait association. Under these premises, a study was undertaken to identify simple sequence repeats (SSR) markers linked to genomic regions controlling nine productivity traits in Dolichos bean through genome-wide AM approach.
Material and methods
Experimental material
The material for the study comprised 64 core set germplasm accessions of Dolichos bean and two check varieties (HA-4 and kadalavare (KA)) maintained at All India Coordinated Research Project (AICRP) on pigeon pea, UAS, Bengaluru. The core germplasm accessions include accessions of Indian (78%- collected from Karnataka, Andhra Pradesh, Maharashtra, Gujarat, Tamil Nadu and Kerala states of India), exotic (6%) and unknown origin (16%). The check entry HA-4 is a released, high yielding, photoperiod-insensitive determinate variety; KA is a high yielding, photoperiod-sensitive indeterminate landrace.
Phenotyping core germplasm accessions
The core germplasm accessions, along with two check entries, were sown in augmented design (Federer, Reference Federer1956) in seven compact blocks during 2014 and 2015 late rainy seasons at the experimental plot of Zonal Agricultural research station (ZARS), UAS, Bengaluru. Each block consisted of 13 germplasm accessions, two checks (replicated twice) and two border entries. The seeds of each entry were sown in a single row of 2.5 m length, with a row spacing of 0.45 m. After thinning (10 days after sowing), a spacing of 0.2 m was maintained between plants within a row. A recommended fertilizer dose of 25:50:25 Kg/ha of NPK was applied to the experimental plots as basal dose. Recommended management practices were followed during the crop-growing period to raise a healthy crop.
Data were recorded on five randomly tagged plants in each germplasm accession and check variety on nine quantitative traits (QTs), i.e. days to 50% flowering, primary branches per plant, racemes per plant, raceme length, nodes per raceme, pods per plant, fresh pod yield per plant, fresh seed yield per plant and 100-fresh seed weight following the descriptors (Byregowda et al., Reference Byregowda, Gireesh, Ramesh, Mahadevu and Keerthi2015).
Genotyping core germplasm accessions
Young leaves from 21 days old seedlings were collected from each core germplasm accessions and genomic DNA was extracted following cetyl Trimethyl Ammonium Bromide extraction method (Doyle and Doyle, Reference Doyle and Doyle1987) with minor modifications. To assess the quality of DNA, samples were run on 0.8% agarose gel. The quantity of DNA was assessed by comparing the band intensity with that of λ DNA (50 bp). The core germplasm accessions were genotyped with a total of 234 SSR markers which included 198 in-house developed SSR markers and 36 transferable cross legume species/genera SSR markers. Polymerase chain reaction (PCR) was carried out in a total reaction volume of 10 µl mixture. PCR products were visualized on 4% agarose gel. The genotype profiles produced by SSR markers were scored manually. The variation in amplicon intensity was not taken into consideration to avoid confusion in scoring.
Statistical analysis
Estimation of phenotypic variability
The QT mean values computed based on data on five randomly tagged plants in each germplasm accession and check entry were used for statistical analysis. Analysis of variance was performed separately for 2014 and 2015 data to partition the total variation among the germplasm accessions and check entries using Statistical Package for Augmented Design developed by Indian Agricultural Statistics Research Institute, New Delhi. Genetic variability among the germplasm accessions was assessed using the estimates of absolute and standardized range and phenotypic coefficient of variation (PCV) (Burton and De Vane, Reference Burton and De Vane1953).
Population structure analysis
The data on alleles at polymorphic SSR markers were used to detect the population structure in a core set of Dolichos bean germplasm accessions, without considering their geographical origin. The analyses were performed using the software package STRUCTURE 2.3.2 (Pitchard et al., Reference Pitchard, Stephens and Donnelly2000). The program STRUCTURE implements a model-based clustering method introduced by Pitchard et al. (Reference Pitchard, Stephens and Donnelly2000) and extended by Falush et al. (Reference Falush, Stephens and Pritchard2003, Reference Falush, Stephens and Pritchard2007) for inferring population structure using genotype data consisting of unlinked markers to identify ‘k’ clusters to which the program then assigns each individual genotype. To determine the most appropriate k value, burn-in Markov Chain Monte Carlo (MCMC) replication was set to 10,000 and data were collected over 10,000 MCMC replications in each run. Five independent runs were performed setting the number of populations (k) from 2 to 10 using a model allowing for no admixture and correlated allele frequencies. The ‘k’ value was determined by LnP (D) in STRUCTURE output and an ad hoc statistic Δk based on the rate of change in LnP (D) between successive k values (Evanno et al., Reference Evanno, Regnaut and Goudet2005). The final subpopulations (ΔK) were determined based on the rate of change in LnP (D) between successive k values. An online-based python program known as the STRUCTURE HARVESTER (http://taylor0.biology.ucla.edu/structureHarvester/) was used to measure the ΔK (Evanno et al., Reference Evanno, Regnaut and Goudet2005). The ΔK thus obtained was used to estimate an optimum number of populations.
Analysis of molecular variance (AMOVA) was performed using the software Power Marker 3.25 (Liu and Muse, Reference Liu and Muse2005) to evaluate population differentiation among the subpopulations. Further, genetic differentiation among subpopulations was calculated as Wright's F ST values (Weir and Cockerham, Reference Weir and Cockerham1984) using Arlequin software, version 3.11 (Excoffier et al., Reference Excoffier, Laval and Schneider2005).
Estimation of LD
The genome-wide LD between all pairs of polymorphic SSR markers were estimated by a weighted average of squared allele frequency correlations (r 2) between pairs of SSR loci using the software TASSEL (Bradbury et al., Reference Bradbury, Zhang, Kroon, Terry, Yogesh and Buckler2007). The significance of LD between all pairs of SSR loci was examined using TASSEL (Bradbury et al., Reference Bradbury, Zhang, Kroon, Terry, Yogesh and Buckler2007) with the rapid permutation test in 10,000 shuffles. The estimates of LD between all pairs of SSR loci were plotted as LD heat map for visual analysis of genome-wide LD patterns.
Identification of marker-trait association
Two different parameters namely Structure (Q) and Kinship (K) were estimated for use in association analysis to reduce the number of false positive associations. Q matrix was generated using STRUCTURE 2.3.1 software after a burn-in period and run length of 100,000. The pair-wise kinships of all the 64 accessions were also estimated using TASSEL 2.1 (http://www.maizegenetics.net/tassel/) software. Marker-trait association analysis was performed using 2 years pooled QTs data and polymorphic SSR marker data following general linear model (GLM) and mixed linear model (MLM) incorporated in TASSEL 2.1. The R 2 which indicate the fraction of the total trait variance explained by the associated marker was estimated. The estimates of marker-trait associations based on GLM and MLM were tested for their statistical significance at probability (P) values of, P < 0.01 and P < 0.05. In order to correct for multiple testing, qFDR value, which is an extension of the false discovery rate (FDR) method was estimated. The q value was obtained by following a smoother method available in Q VALUE R package software (Storey and Tibshirani, Reference Storey and Tibshirani2003). In order to ascertain the true marker-trait association, the SSR markers with qFDR value <0.05 was considered as significant.
Results
Phenotypic and molecular diversity in a core set of Dolichos bean germplasm
The data on nine QTs recorded over 2 years (2014 and 2015) were subjected to ANOVA. Year-wise ANOVA revealed highly significant mean squares attributable to ‘germplasm accessions’ and ‘check varieties’ for all traits in both the years except for raceme length during 2014. Mean squares due to ‘accessions versus check varieties’ were significant for all traits except for raceme length, nodes per raceme and fresh seed yield per plant during 2014. Combined ANOVA (Table 1) indicated significant mean squares for accessions × years’ interaction for all traits except primary branches per plant and racemes per plant; the checks interacted significantly with years for all the traits except for primary branches per plant. The 2 year pooled data were subsequently used for AM. The estimates of traits range provide clues about the occurrence of accessions with extreme expression. The traits standardized ranges of the accessions were relatively high, which is amply reflected by higher estimates of PCV for all the traits except for days to 50% flowering and primary branches per plant (Table 2).
Table 1. Combined ANOVA (2014 and 2015) of a core set of Dolichos bean germplasm accessions

*,**Significant at 5% and 1% probability level, respectively.
Table 2. Descriptive statistics for nine quantitative traits in a core set of Dolichos bean germplasm accessions

Of the 234 SSR markers used in the study, 187 markers were amplified. Among the 187 amplified markers, 95 (50.80%) were found polymorphic and the number of alleles per SSR locus varied from 1 to 4 with an average of 2.21 alleles. Major allele frequency ranged from 0.58 to 0.96 with an average of 0. 93. The minor allele frequency ranged from 0.01 to 0.15 with an average of 0.05. The effective number of alleles per locus ranged from 1.03 to 2.13 with an average of 1.17. The estimates of Nei's gene diversity ranged from 0.03 to 0.53 with an average of 0.13 whereas the estimated PIC value ranged from 0.03 to 0.63 with an average of 0.42.
Population structure and LD in a core set of Dolichos bean germplasm
A set of 95 polymorphic SSR markers were used to dissect the population structure of Dolichos bean core set. The ad-hoc statistic ‘Δk’ determined based on MCMC model was found to be k = 3, the number of subpopulations (Fig. 1(a)). A graphical bar plot was then generated with the posterior membership coefficient (Q) and presented in Fig. 1(b). AMOVA showed a meager quantity of (2%) the total variance explained by ‘between subpopulations’, while 98% of the total variance could be explained by individuals within the sub-populations (Table 3). The Wright's fixation index, F ST was found to be 0.05.

Fig. 1. (a) Depiction of three subpopulations (K = 3) of 64 core set germplasm accessions of Dolichos bean. (b) SSR marker assay-based population genetic structure in a core set of Dolichos bean germplasm.
Table 3. Analysis of molecular variance (AMOVA) in a core set of Dolichos bean germplasm

The weighted average of squared allele frequency correlations (r 2) between pairs of SSR loci was used to estimate LD. Further, the significance of pair-wise LD was estimated using TASSEL. Maximum significant LD (r 2 = 1) was observed between the SSR markers KTD 128 and KTD 223. LD heat map was generated to visualize genome-wide LD patterns (Fig. 2).
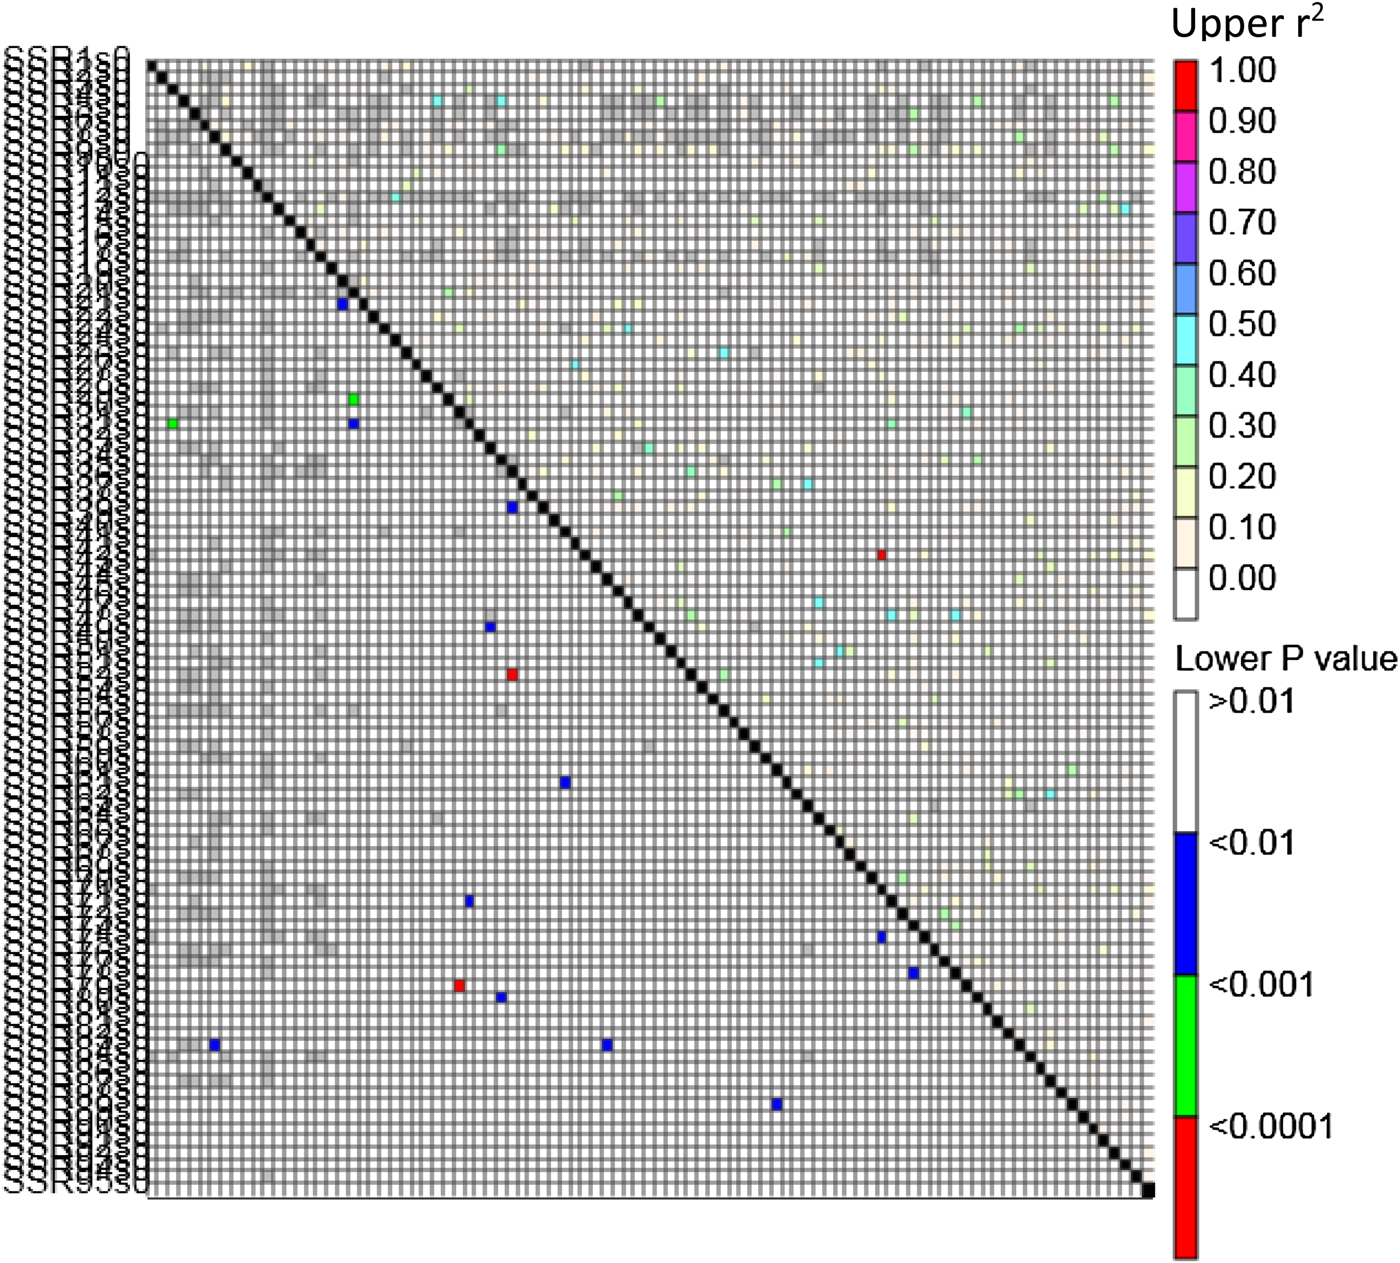
Fig. 2. LD heat map depicting estimates of LD (r 2) between 95 polymorphic SSR loci of a core set of Dolichos bean germplasm accessions.
Identification of marker-trait association
MLM and GLM implemented in TASSEL 2.1 (Yu et al., Reference Yu, Pressoir, Briggs, Vroh, Yamasaki, Doebley, Mcmullen, Gaut, Nielsen, Holland, Kresovich and Buckler2006) were used to identify the SSR markers associated with genomic regions controlling nine QTs in Dolichos bean at P ≤ 0.05 and P ≤ 0.01. As many as 62 and 60 SSR markers were found significantly associated (P ≤ 0.05) with genomic regions controlling nine QTs based on GLM and MLM, respectively (Table 4). However, when more stringency was applied in association analysis (i.e. P ≤ 0.01), significant marker-trait associations were reduced considerably to an extent of 35.48% (GLM) and 36.66% (MLM). The SSR markers, KTD 200, KTD 268, KTD 194 and KTD 228 were found significantly associated with days to 50% flowering by both GLM and MLM methods, of which KTD 200 explained 17–23% of the trait variation (online Supplementary Tables S1 and S2). The markers KTD 130, KTD 235, KTD 273, KTD 271 and KTD 285 were found significantly associated with fresh pods per plant based on both the models. Among the eight significant SSR markers (KTD 273, KTD 271, KTD 281, KTD 285, KTD 130, KTD 235, KTD 170 and KTD 218) associated with fresh pod and seed yield per plant, KTD 273 explained 12–14% of the trait variation. The highest number of SSR markers (12 SSRs) was found significantly associated with genomic regions controlling variation in 100 fresh seed weight based on both GLM and MLM methods. Out of the total reported marker-trait associations, 53 associations were found true to type as depicted by qFDR <0.05.
Table 4. Number of SSR markers significantly associated with nine QTs using GLM and MLM at different significance levels in dolichos bean

*SSR markers with qFDR <0.05 was considered significant.
A few SSR markers such as KTD 273 (fresh pods per plant, fresh pod yield per plant and fresh seed yield per plant), KTD 271 (primary branches per plant, raceme length, nodes per raceme, fresh pods per plant, fresh pod yield per plant and fresh seed yield per plant) and KTD 130 (fresh pods per plant, fresh pod yield per plant and fresh seed yield per plant) were found associated with multiple traits (online Supplementary Tables S1 and S2). A few of the significantly associated markers such as KTD 200 for days to 50% flowering, KTD 273 for fresh pod yield per plant and KTD 130 for fresh pods per plant explained ≥10% of the trait variations. We also observed that at any significant P value, the number of significant marker-trait associations informed by GLM was almost par with the number of marker-trait correlations given by MLM.
Discussion
Diversity analysis and its implications
The phenotypic variation of many complex traits of agricultural importance is influenced by environment, multiple QTLs and their interaction with the environment (Holland, Reference Holland2007). Detection of genetic variability is a prerequisite for assessing the relative contribution of genetic and non-genetic sources on the QTs variability which in turn is useful in formulating appropriate selection strategies to breed improved Dolichos bean cultivars. However, phenotyping has not received as much attention as genotyping. While accuracy and throughput of genotyping have dramatically improved, obtaining robust phenotypic data remains a limitation for AM. Since AM panel often involves diverse genotypes, a collection of phenotypic data with adequate replication across years/locations is a challenging job (Campbell et al., Reference Campbell, Baenziger, Gill, Eskridge, Budak, Erayman and Yen2003). In the present study, year-wise and combined ANOVA suggested the differential performance of accessions and checks across years. The significant interaction of genotypes with years implied that testing must be performed in multiple years for reliable results. The results also showed the greater magnitude of variability for all the QTs which intern suggested suitability of core set as a panel for AM. Significant variability among the accessions for QTs was expected as they are landraces which have evolved over millennia through a combination of natural and human selection on the variation originated by mutations and distributed and reshuffled by recombination (Allard, Reference Allard1999). Substantial variability for different QTs in Dolichos bean germplasm accessions has also been documented by Borah and Shadeque (Reference Borah and Shadeque1992), Basavarajappa and Byregowda (Reference Basavarajappa and Byregowda2000) and Vaijayanthi et al. (Reference Vaijayanthi, Ramesh, Byregowda, Mohan Rao, Keerthi and Marry Reena2015a). The greater magnitude of variability for different QTs suggested ample opportunity to identify traits-specific accessions and those promising for acombination of traits.
The efficiency of breeding Dolichos bean can be accelerated by DNA marker-assisted diversity analysis, chromosomal localization and unraveling of the mode of action of genes controlling traits of economic importance etc. However, availability of genomic resources is a major impediment for crop and very few markers were reported. The SSR marker system offers a unique opportunity in such resource-limited situations as they are codominant, multi-allelic, high throughput can be exchanged between laboratories and are highly transferable between species or genera. The 234 SSRs used in the study includes both in house developed and cross legume/species transferable genic and genomic SSRs. The extent of genetic diversity present in the core collections of chickpea (Upadhyaya et al., Reference Upadhyaya, Gowda and Sastry2008), genus Arachis (Koppolu et al., Reference Koppolu, Upadhyaya, Dwivedi, Hoisington and Vershney2010), common beans (Blair et al., Reference Blair, Diaz, Buendia and Duque2009), peanut (Kottapalli et al., Reference Kottapalli, Burow, Burow, Burke and Puppala2007) etc were also assessed using SSR markers.
In the present study, out of 187 amplified SSRs, 95 were found polymorphic of which 20 markers were multi-allelic and 75 were bi-allelic. The 20 multi-allelic SSR markers exhibited greater ability to discriminate the germplasm accessions as reflected by higher estimates of PIC and Nei's gene diversity. Although the estimate of PIC is not related to genetic diversity, a few researchers have used it for assessing genetic diversity in populations of crop plants. However, Nei's gene diversity (Nei, Reference Nei1973), which is the probability that two randomly chosen alleles at a locus in a population are different to each other, is conceptually more adequate than PIC as a measure of genetic diversity (Laurentin, Reference Laurentin2009). In general, higher estimates of PIC and Nei's diversity indicated the presence of ample diversity at the 95 polymorphic SSR loci among a core set of germplasm accessions. The poor correspondence between phenotype and SSR markers-based diversity estimates is because of the fact that SSR marker loci are most often sampled from non-coding regions and/or un-translated regions while, phenotypes are due to coding regions of the genome (Morgante et al., Reference Morgante, Hanafey and Powell2002). This problem can be addressed by developing Functional Markers (FM) and genic marker resources like EST-SSRs. Further, the 20 multi-allelic markers could be preferentially used to assess genetic diversity, fingerprinting and to establish distinctiveness, uniformity and stability (DUS) of lines. Saravanan et al. (Reference Saravanan, Shanmugasundaram, Senthil and Veerabadhiram2013) also reported higher discriminating power of 10 SSR loci and a fairly higher polymorphism among Dolichos bean genotypes.
Population structure and genetic differentiation among core set germplasm accessions
Population structure occurs from the unequal distribution of alleles among sub-populations of different ancestries. When these sub-populations are sampled to construct a panel of genotypes for AM, the intentional or unintentional mixing of individuals with different allele frequencies creates LD. In short, selection affects the genome and LD at specific loci (Yu and Buckler, Reference Yu and Buckler2006) while population structure affects LD throughout the genome. Significant LD between unlinked loci results in false-positive associations between a marker and a trait. One of the sources of false positive marker-trait associations in AM is population structure (Yu and Buckler, Reference Yu and Buckler2006; Zhu et al., Reference Zhu, Gore, Buckler and Yu2008). Hence, the population structure of Dolichos bean core set was worked out using 95 polymorphic SSR markers. The MCMC model-based ad-hoc statistics, Δk, suggested the existence of three subpopulations in Dolichos bean core set. However, the graphical bar plot (Fig. 1(b)) generated using the posterior membership coefficient (Q) indicated week population structure. This implies that either STRUCTURE does not capture properly the genetic structure with a small set of multi-allelic markers or that no population structure is present. In order to confirm the week population structure, we additionally performed AMOVA and Wright's fixation index (F ST).
The distribution of molecular genetic variation among and within the three sub-populations was estimated by AMOVA (Table 3). AMOVA is a method of estimating population differentiation directly from molecular data and testing hypothesis about such differentiation (Excoffier et al., Reference Excoffier, Smouse and Quattro1992). A meager 2% of the total variance could be explained by ‘between subpopulations’, while 98% of the total variance could be explained by individuals within the subpopulations (Table 3). Significant within sub-population molecular variance indicates that the populations are constituted by genetically distinct individuals. The Wright's F statistic (F ST) is a measure of population differentiation due to genetic structure. The F ST value obtained in the study was lower and nonsignificant indicating marginal genetic differentiation among subpopulations. Hence, the low contribution of ‘between population’ variance and low estimates of F ST additionally confirmed the presence of week population structure. However, the week population structure has an advantage in association analysis, since it reduces the chances of discovery of false positives.
Detection of LD and association analysis
Linkage analysis and AM are the two most commonly used tools for dissecting the genetic basis of complex traits (Zhu et al., Reference Zhu, Gore, Buckler and Yu2008). Linkage analysis in plants typically localizes QTLs in 10–20 cM intervals because of the limited number of recombination events that occur during the development of mapping populations (Doerge, Reference Doerge2002; Holland, Reference Holland2007). Alternatively, AM has emerged as a tool to resolve complex traits variation down to the sequence level by exploiting historical and evolutionary recombination events in the natural populations (Risch and Merikangas, Reference Risch and Merikangas1996; Nordborg and Tavare, Reference Nordborg and Tavare2002). Genetic materials like core sets would be an ideal material for AM of traits of economic importance in crops where they are available (Whitt and Buckler, Reference Whitt and Buckler2003) as is true in Dolichos bean. AM based on a core set of germplasm provides a valuable alternative to bi-parental population-based gene mapping (Wen et al., Reference Wen, Mei, Feng, Yu, Huang, Wu, Chen, Xu and Luo2009) due to its reduced size and represents the entire collections of that species.
The knowledge of LD is limited in Dolichos bean. Availability of such information helps to understand the domestication process and pave the way for identification of agriculturally significant genes (Wang et al., Reference Wang, Chen, Zhi, Yang, Li, Wang, Li, Zhao, Chen and Diao2010). Since the LD estimate (i.e. r 2) are pair-wise LD between polymorphic loci, it is difficult to obtain summary statistics of LD across the genomic region (Gupta et al., Reference Gupta, Rustgi and Kulwal2005). Moreover, knowledge on the chromosomal location of the 95 polymorphic SSRs in Dolichos bean is limited. To circumvent this problem, LD heat map (it is a colour-coded triangular plot where the diagonal represents ordered loci and the different intensity coloured pixels depicts significant pair-wise LD level expressed as r 2) was generated and used to infer about genome-wide LD pattern. Maximum LD (i.e., r 2 = 1) was observed between the SSR markers KTD 128 and KTD 223 indicating their close position in the genome.
Several statistical models take into account the potential effect of population structure and kinship. Initially, structured association (Pitchard et al., Reference Pitchard, Stephens and Donnelly2000; Thorsberry et al., Reference Thorsberry, Goodman, Doeblay, Kresovich, Neilson and Buckler2001) was used and it was first implemented in TASSEL to reduce the risk of discovering false positives arising from population structure. The MLM developed by integrating population structure (Q) and family relatedness (K) within population showed to be superior (Yu et al., Reference Yu, Pressoir, Briggs, Vroh, Yamasaki, Doebley, Mcmullen, Gaut, Nielsen, Holland, Kresovich and Buckler2006) to GLM that take into account only Q (Bradbury et al., Reference Bradbury, Zhang, Kroon, Terry, Yogesh and Buckler2007). In this study, the 95 polymorphic marker allele's scores were regressed onto phenotypes at nine QTs following GLM and MLM. In order to avoid spurious association, multiple testing was performed (50,000 permutations, at various P values i.e. P < 0.05, P < 0.03, P < 0.01, P < 0.001). Unlike expected there was no difference in the number of marker-trait associations before and after permutations at all the four significant P values. As many as 57 (P ≤ 0.05) SSR markers were found commonly associated with genomic regions controlling nine productivity traits based on both GLM and MLM (online Supplementary Tables S1 and S2). Further, 53 marker-trait associations were found highly significant as their qFDR <0.05.
Relatively a large number of SSR markers were significantly associated with positive effect QTLs controlling yield traits. Moreover, the number of significant markers tagged with yield traits was comparable in both GLM and MLM methods. This may be because of non-significant population structure present among core germplasm accessions. The number of marker-trait associations reported was always more than the number of individual markers linked. This is because of the fact that many SSRs were linked to multiple traits. For example, SSR markers such as KTD 273 (fresh pods per plant, fresh pod yield per plant and fresh seed yield per plant), KTD 271 (primary branches per plant, raceme length, nodes per raceme, fresh pods per plant, fresh pod yield per plant and fresh seed yield per plant) and KTD 130 (fresh pods per plant, fresh pod yield per plant and fresh seed yield per plant) were found associated with multiple traits. Such associations of SSR markers with multiple traits may arise due to the pleiotropic effect of the linked QTLs on different traits (Miller and Rawlings, Reference Miller and Rawlings1967). Closely linked QTLs affecting different traits may also lead to a single marker showing association with multiple traits which would be reflected in correlations between such traits (Rakshit et al., Reference Rakshit, Rakshit, Singh, Chopra, Balyan, Gupt and Bhat2010). AM using MLM model have been used to discover marker-trait association in other legumes such as common bean (Blair et al., Reference Blair, Diaz, Buendia and Duque2009; Nemli et al., Reference Nemli, Asciogul, Kay, Kahraman, Siyok and Tanyolac2014), flax (Braulio et al., Reference Braulio, Axel, Raja and Sylvie2013; Soto-Cerda et al., Reference Soto-Cerda, Duguid, Booker, Rowland, Diederichsen and Cloutier2014), chickpea (Jadhav et al., Reference Jadhav, Rayate, Mhase, Thudi, Chitikineni, Harer, Jadhav, Varshney and Kulwal2015) and in cereals such as rice (Agrama et al., Reference Agrama, Eizenga and Yan2007; Wen et al., Reference Wen, Mei, Feng, Yu, Huang, Wu, Chen, Xu and Luo2009; Borba et al., Reference Borba, Brondani, Breseghello, Coelho, Mendonca, Rangel and Brondani2010), wheat (Breseghello and Sorrells, Reference Breseghello and Sorrells2006; Liu et al., Reference Liu, Wang, Yao, Zhang and Zhao2010; Neumann et al., Reference Neumann, Kobiljski, Dencic, Vershney and Borner2011) and sorghum (Murray et al., Reference Murray, Rooney, Hamblin, Mitchell and Kresovich2009) and model species, Arabidopsis (Zhao et al., Reference Zhao, Aranzana, Kim, Lister, Shindo, Tang, Toomajian, Zheng, Dean, Marjoram and Nordborg2007). Borba et al. (Reference Borba, Brondani, Breseghello, Coelho, Mendonca, Rangel and Brondani2010) in rice and Blair et al. (Reference Blair, Diaz, Buendia and Duque2009) in common bean have demonstrated the usefulness of core collection for unraveling population structure and identification of markers associated with genetic determinants controlling phenotypic variation. AM with diverse germplasm not only enable tagging genomic regions controlling economic traits with high resolution (Wang et al., Reference Wang, Yu, Zhao, Shi, Song, Wang and Li2008), but also help identify new superior alleles that were not captured by breeding populations and support introgression of these alleles into elite breeding germplasm (Kumar et al., Reference Kumar, Choundary, Solanki and Pratap2011). Considering limited availability of information on linkage and QTL mapping in Dolichos bean, AM provides more information for MAS breeding programmes and insight into the genetic basis of yield-associated traits.
Conclusion
The reported result on identifying QTLs controlling QTs is first of its kind in Dolichos bean. The study suggested the effectiveness of genome-wide AM approach to identify QTLs affecting variation in all the traits investigated. However, it is necessary to increase the resolution of mapping QTLs using a large set of hyper variable SSR/SNP markers and validation for implementing marker-assisted selection to increase the efficiency of breeding Dolichos bean. Identification of closely linked SSR markers also paves the way for introgressing positive effect QTLs into the elite agronomic background which is expected to increase yield grains in Dolichos bean.
Supplementary material
The supplementary material for this article can be found at https://doi.org/10.1017/S1479262118000163.
Acknowledgement
The senior author greatly acknowledges financial support from Department of Science and Technology (DST), New Delhi in the form of INSPIRE fellowship (IF 140200) for perusing Ph.D. thesis research.


