Introduction
The common bean (Phaseolus vulgaris L.) is of great agronomic interest worldwide, and represents 50% of grain legumes for direct human consumption (McClean et al., Reference McClean, Lee and Miklas2004). Domestication of P. vulgaris occurred independently in the Mesoamerican and Andean areas, which gave rise to two highly differentiated gene pools (Gepts and Debouck, Reference Gepts, Debouck, Schoonhoven and Voysest1991; Gepts, Reference Gepts1998). The two gene pools can be distinguished according to morphological traits (Gepts et al., Reference Gepts, Osborne, Rashka and Bliss1986), phaseolins (major seed-storage proteins) and by various marker systems (Beebe et al., Reference Beebe, Rengifo, Gaitan, Duque and Tohme2001; Papa and Gepts, Reference Papa and Gepts2003; Kwak and Gepts, Reference Kwak and Gepts2009; Rossi et al., Reference Rossi, Bitocchi, Bellucci, Nanni, Rau, Attene and Papa2009). The Mesoamerican types are small or medium seeded, with phaseolins S or B; while the Andean are large seeded, with phaseolins T, C, H and A (Gepts et al., Reference Gepts, Osborne, Rashka and Bliss1986; Singh et al., Reference Singh, Nodari and Gepts1991). Based on the occurrence of a strong bottleneck in the Andean wild population, Rossi et al. (Reference Rossi, Bitocchi, Bellucci, Nanni, Rau, Attene and Papa2009) recently suggested a Mesoamerican origin of the common bean.
The common bean was introduced into Europe after Columbus's voyages. It was distributed widely in all parts of Europe, where many landraces and varieties evolved, as they were grown to provide dry seeds or fresh pods (Zeven, Reference Zeven1997).
Here, we present a brief overview regarding the level and structure of the genetic diversity of the European common bean, and we compare this with information provided for other continents.
Composition of the European common bean
Overall, outside the domestication centres of the common bean (Table 1), the proportions of the Andean and Mesoamerican gene pools vary considerably across different countries and continents.
Table 1 Gene pool compositions (% of Andean and Mesoamerican), gene diversities (Nei, Reference Nei1978) and % hybrids in European sample, compared with countries on other continents
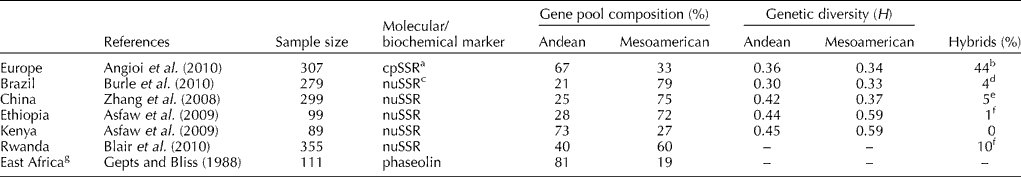
a Provan et al. (Reference Provan, Powell and Hollingsworth2001), for a review.
b Data obtained through comparison with nuclear STS and phaseolins.
c As defined by Tautz Reference Tautz1998.
d Data obtained through comparison with phaseolins.
e Data obtained through comparison with morphological data.
f Intermediate genotypes identified in the neighbour-joining tree.
g Ethiopia, Kenya, Uganda, Burundi, Rwanda, Democratic Republic of Congo (former Zaire), Tanzania, Malawi and Zambia.
In Europe, studies have been conducted on different scales: continental, macro-areas, single country and local (within country). The first studies on large collections of the European common bean were carried out by using phaseolins. These demonstrated that the germplasm arose from both of the American gene pools, with a higher frequency of Andean types (76–66%) (Gepts and Bliss, Reference Gepts and Bliss1988; Lioi, Reference Lioi1989). This prevalence (76%) was confirmed in a large collection that included, for the first time, central European countries (Logozzo et al., Reference Logozzo, Donnoli, Macaluso, Papa, Knupffer and Spagnoletti Zeuli2007).
Angioi et al. (Reference Angioi, Rau, Attene, Nanni, Bellucci, Logozzo, Negri, Spagnoletti Zeuli and Papa2010) used chloroplast microsatellites (cpSSRs), two nuclear markers and morphological seed traits to analyze a large part of the collection of Logozzo et al. (Reference Logozzo, Donnoli, Macaluso, Papa, Knupffer and Spagnoletti Zeuli2007), while adding new accessions from countries previously less represented (e.g. France). Also for this analysis, the prevalence (67%) of European germplasm was of Andean origin (Fig. 1).

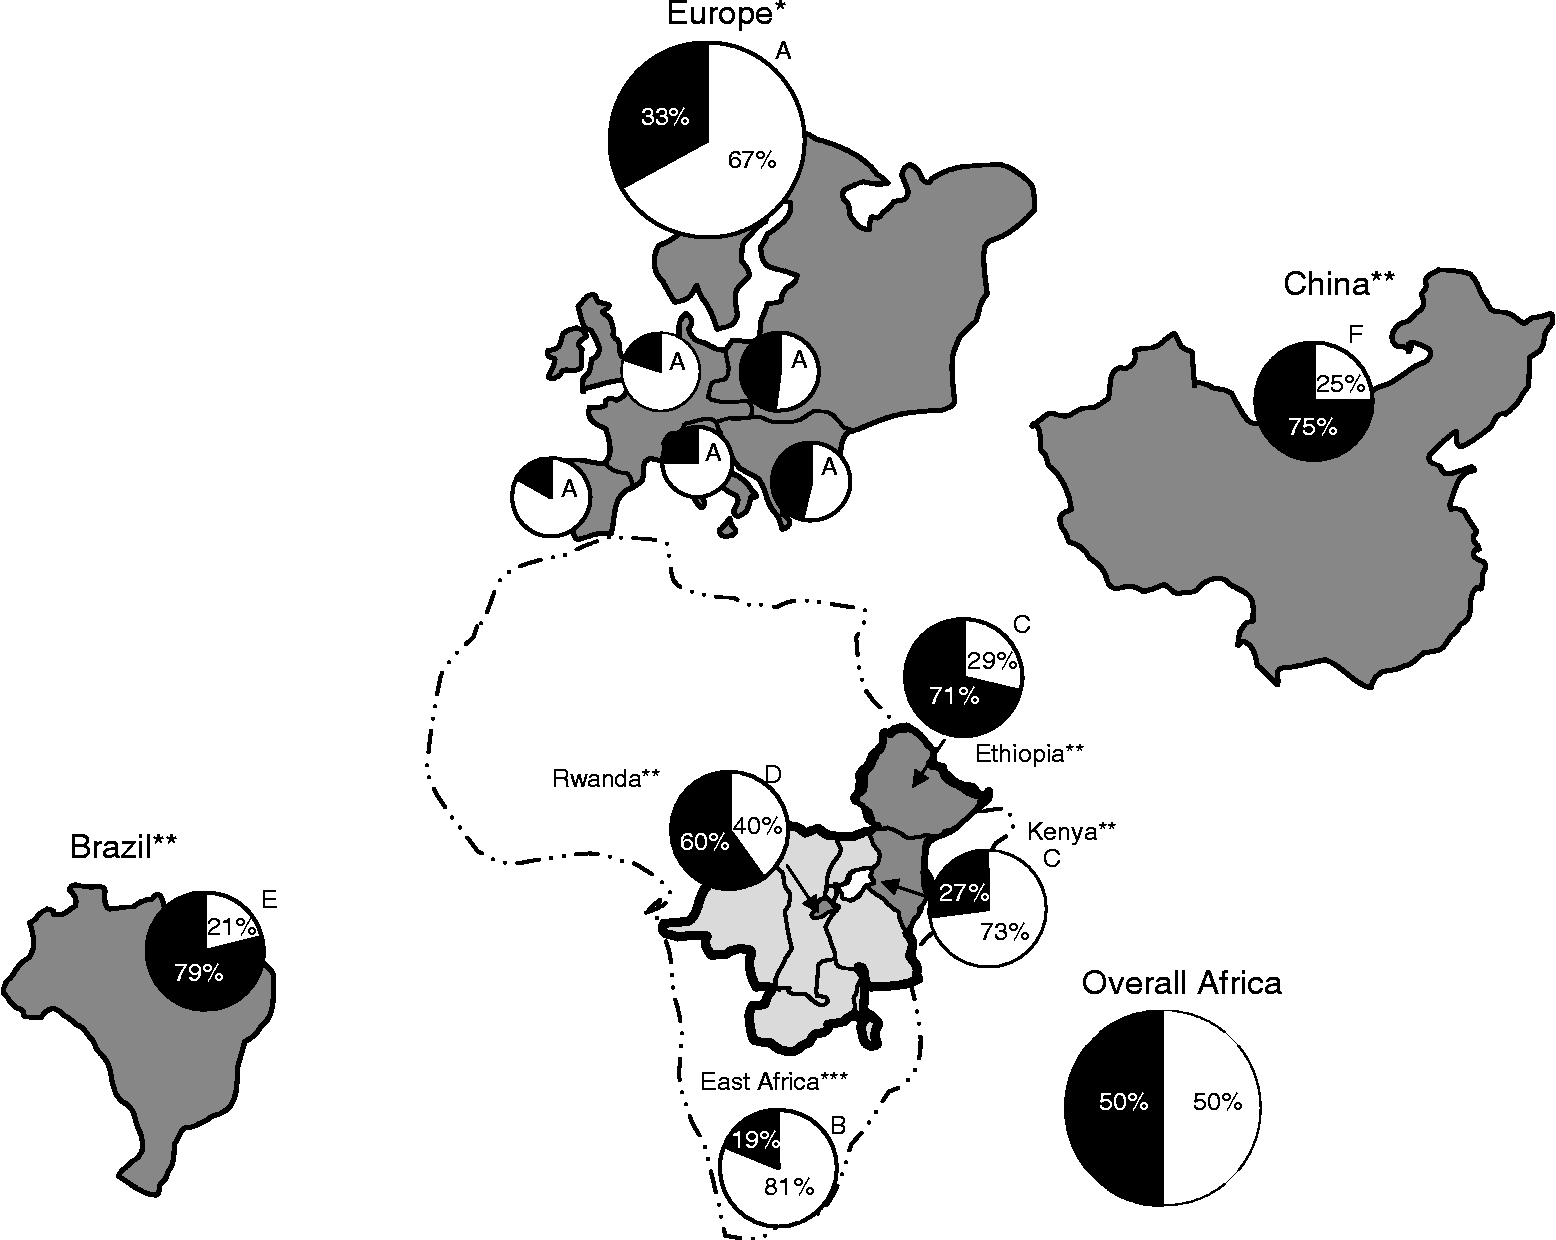
Fig. 1 Distribution map of the Andean and Mesoamerican gene pools in Europe and on other continents, analyzed with molecular markers. In the pie charts: white, Andean gene pool; black, Mesoamerican gene pool. (A) Europe (sample size, n = 307) and the Iberian Peninsula (53), Italy (32), central-northern Europe (74), eastern Europe (69), south-eastern Europe (79); Angioi et al. (Reference Angioi, Rau, Attene, Nanni, Bellucci, Logozzo, Negri, Spagnoletti Zeuli and Papa2010). (B) east Africa (111), Gepts and Bliss (Reference Gepts and Bliss1988); (C) Ethiopia (99) and Kenya (89), Asfaw et al. (Reference Asfaw, Blair and Almekinders2009); (D) Rwanda (355), Blair et al. (Reference Blair, González, Kimani and Butare2010); (E) Brazil (279), Burle et al. (Reference Burle, Fonseca, Kami and Gepts2010); (F) China (299), Zhang et al. (Reference Zhang, Blair and Wang2008). *cpSSRs, **nuSSRs, ***phaseolins. The overall African pie chart is obtained pooling together the data provided in Table 1.
Within Europe, an interesting trend was seen, as the Andean type was in the majority in three macro-areas: the Iberian Peninsula, Italy and central-northern Europe. In contrast, in eastern and south-eastern Europe, the proportion of the Mesoamerican type increased (Fig. 1). This was supported by other studies in the Iberian Peninsula (Rodiño et al., Reference Rodiño, Santalla, De Ron and Singh2003; Ocampo et al., 2005), and at a country level in Greece (46%; Lioi, Reference Lioi1989) and Bulgaria (79%; Svetleva et al., Reference Svetleva, Pereira, Carlier, Cabrita, Leitão and Genchev2006) (see Papa et al., Reference Papa, Nanni, Sicard, Rau, Attene, Motley, Zerega and Cross2006, for review).
In Italy, on a local scale, the prevalence of the Andean type has been confirmed. The contribution of the Mesoamerican gene pool varied from 5% in Sardinian landraces (Angioi et al., Reference Angioi, Desiderio, Rau, Bitocchi, Attene and Papa2009) to 29% in the Marche region (Sicard et al., Reference Sicard, Nanni, Porfiri, Bulfon and Papa2005), according to chloroplast and nuclear markers, and 12 and 13% in Abruzzo and Basilicata, respectively (Piergiovanni et al., Reference Piergiovanni, Cerbino and Brandi2000a, Reference Piergiovanni, Taranto and Pignoneb), according to phaseolins.
Looking at other continents, the Mesoamerican gene pool prevailed in a Chinese collection (Zhang et al., Reference Zhang, Blair and Wang2008) and a Brazilian collection (Burle et al., Reference Burle, Fonseca, Kami and Gepts2010) (Table 1 and Fig. 1). The Mesoamerican predominance in Brazil is surprising, given its close proximity to the Andes. Multiple introductions of Mesoamerican germplasm and similarities in climate and soil between Brazil and Mesoamerica might have had a considerable impact in establishing this pattern (Burle et al., Reference Burle, Fonseca, Kami and Gepts2010).
In Africa, overall, both gene pools are equally represented (Fig. 1), although at the single country level, contrasting situations are seen. In Ethiopia (Asfaw et al., Reference Asfaw, Blair and Almekinders2009) and Rwanda (Blair et al., Reference Blair, González, Kimani and Butare2010), the Mesoamerican types predominate, and vice versa in Kenya (Asfaw et al., Reference Asfaw, Blair and Almekinders2009) and East Africa (Gepts and Bliss, Reference Gepts and Bliss1988) (Table 1 and Fig. 1). This suggested that the genetic divergence in bean landraces might be due to the original differences in the introduced germplasm from the centres of origin (Asfaw et al., Reference Asfaw, Blair and Almekinders2009), combined with differences in pest resistance (e.g. Mesoamerican types resistant to root rot in Rwanda) and production (Mesoamerican genotypes have the highest yields).
Finally, gene flow between Ethiopia and Kenya was moderate, probably due to different farmer preferences according to ecological adaptation, cooking values and market orientation (Asfaw et al., Reference Asfaw, Blair and Almekinders2009). This is in contrast to Europe. Indeed, in Europe, high gene flow among macro-areas and/or homogenizing selection (anthropic and natural) has been suggested (Angioi et al., Reference Angioi, Rau, Attene, Nanni, Bellucci, Logozzo, Negri, Spagnoletti Zeuli and Papa2010). The role of selection is suggested by the findings of Logozzo et al. (Reference Logozzo, Donnoli, Macaluso, Papa, Knupffer and Spagnoletti Zeuli2007) in European landraces, where accessions with Mesoamerican phaseolin had significantly larger seed size than individuals from America in the same phaseolin class.
Introgression between the gene pools
Introgression is an event that arises from hybridization among gene pools, as spontaneous outcrossing in farmer fields followed by selection for adaptation to production niches and uses. Comparing chloroplast data with nuclear (phaseolin and sequence-tagged sites, STS) and morphological data, Angioi et al. (Reference Angioi, Rau, Attene, Nanni, Bellucci, Logozzo, Negri, Spagnoletti Zeuli and Papa2010) estimated that a high proportion of the European bean germplasm (44%) derived from at least one hybridization event using a maximum-likelihood approach. Although hybrids are present everywhere, they show uneven distributions, with high frequencies in central Europe and low frequencies in the Iberian Peninsula and Italy. A comparison of chloroplast data with nuclear and morphological data is a reliable method to identify the hybrids, as they tend to have intermediate seed size with respect to ‘pure’ Andean or Mesoamerican, with Andean × Mesoamerican seeds smaller than ‘pure’ Andean, and Mesoamerican × Andean seeds larger than ‘pure’ Mesoamerican. This method was also applied at local scales in Italy, in the Marche region (12% hybrids; Sicard et al., Reference Sicard, Nanni, Porfiri, Bulfon and Papa2005) and Sardinia (4%; Angioi et al., Reference Angioi, Desiderio, Rau, Bitocchi, Attene and Papa2009).
Other studies have analyzed hybridization among gene pools, but they found few hybrids: 4% in Brazil, comparing nuclear SSRs (nuSSRs) to phaseolins (Burle et al., Reference Burle, Fonseca, Kami and Gepts2010), and from 1 to 10% in Ethiopia and Rwanda (Asfaw et al., Reference Asfaw, Blair and Almekinders2009; Blair et al., Reference Blair, González, Kimani and Butare2010), considering individuals intermediate among gene pools in the neighbour-joining tree (Table 1). The differences in hybrid frequency can be explained by different marker systems used (chloroplast and nuclear) and the definition of hybrids as recent (Asfaw et al., Reference Asfaw, Blair and Almekinders2009; Blair et al., Reference Blair, González, Kimani and Butare2010) versus old generation hybrids (Angioi et al., Reference Angioi, Rau, Attene, Nanni, Bellucci, Logozzo, Negri, Spagnoletti Zeuli and Papa2010). Another explanation might be that, as seen in Brazil, the frequency of the two gene pools are very different, or that in some environments, there is no flowering synchronization between Andean and Mesoamerican types (Asfaw et al., Reference Asfaw, Blair and Almekinders2009). In the Chinese sample, Zhang et al. (Reference Zhang, Blair and Wang2008) found 5% hybrids, noting that average seed weight of the Andean types was lower than that of the American Andean beans, with the opposite for the Mesoamerican Chinese bean.
The existence of the high frequency of inter-gene pool hybridization in Europe might have had a significant impact on the structure of the genetic and genotypic diversity in the nuclear genome. This is consistent with the breakdown of geographical isolation between the two gene pools (Angioi et al., Reference Angioi, Rau, Attene, Nanni, Bellucci, Logozzo, Negri, Spagnoletti Zeuli and Papa2010). Moreover, the European hybrids appear to be of great importance for breeding that aims to recombine Andean and Mesoamerican traits (Johnson and Gepts, Reference Johnson and Gepts1999, Reference Johnson and Gepts2002).
Acknowledgements
This study was partially supported by the Italian Government (MIUR) grant no. 20083PFSXA PRIN 2008.