


Introduction
Coconut (Cocos nucifera L.) (Arecaceae) is a globally important tree-borne oil crop. It is grown in more than 80 countries, while Indonesia, the Philippines and India are the major producers contributing about 75% of the total production (FAOSTAT, 2012). Understanding of genetic diversity in germplasm collections would be helpful for conservation, maintenance and exploitation of this valuable species. Coconut germplasm is primarily classified into ‘Tall’ (Typica) and ‘Dwarf’ (Nana) types. The Talls are outcrossing and the Dwarfs are mostly autogamous in nature (Harries, Reference Harries1978). Traditionally, coconut genotypes are characterized using morphological traits (Balakrishnan and Nair, Reference Balakrishnan and Nair1979; Panda, Reference Panda1982; Sugimura et al., Reference Sugimura, Itano, Salud, Otsuji and Yamaguchi1997; Zizumbo-Villarreal and Piñero, Reference Zizumbo-Villarreal and Piñero1998), which have been difficult due to scarcity of phenotypic markers, long juvenile phase and expensive field trials. Molecular markers help to overcome these limitations as they are abundant, highly polymorphic, independent of environments and the characterization can be performed rapidly (Perera et al., Reference Perera, Russell, Provan, McNicol and Powell1998). Several kinds of molecular markers have been used to characterize genetic diversity in coconut namely randomly amplified polymorphic DNA (RAPD) (Ashburner et al., Reference Ashburner, Thompson and Halloran1997; Daher et al., Reference Daher, Pereira, Tupinambá, Amaral Junior, Aragao, Ribeiro, Oliveira and Sakiyama2002), RFLPs (restriction fragment length polymorphisms) (Lebrun et al., Reference Lebrun, N'cho, Seguin, Grivet and Baudouin1998), AFLPs (amplified fragment length polymorphisms) (Perera et al., Reference Perera, Russell, Provan, McNicol and Powell1998; Teulat et al., Reference Teulat, Aldam, Trehin, Lebrun, Barker, Arnold, Karp, Baudouin and Rognon2000), simple sequence repeats (SSRs) (Rivera et al., Reference Rivera, Edwards, Barker, Arnold, Ayad, Hodgkin and Karp1999; Perera et al., Reference Perera, Russell, Provan and Powell2000, Reference Perera, Russell, Provan and Powell2001; Teulat et al., Reference Teulat, Aldam, Trehin, Lebrun, Barker, Arnold, Karp, Baudouin and Rognon2000; Baudouin and Lebrun, Reference Baudouin and Lebrun2002; Meerow et al., Reference Meerow, Wisser, Brown, Kuhn, Schnell and Broschat2003; Rajesh et al., Reference Rajesh, Arunachalam, Nagarajan, Lebrun, Samsudeen and Thamban2008a, Reference Rajesh, Nagarajan, Jerard, Arunachalam and Dhanapalb; Martinez et al., Reference Martinez, Baudouin, Berger and Dollet2010; Ribeiro et al., Reference Ribeiro, Baudouin, Lebrun, Chaves, Brondani, Zucchi and Vencovsky2010; Liu et al., Reference Liu, Tang, Li and Hou2011; Loiola et al., Reference Loiola, Azevedo, Diniz, Aragão, Azevedo, Santos, Ramos, Pereira and Ramos2016), inter-SSRs (Manimekalai and Nagarajan, Reference Manimekalai and Nagarajan2006) and SNPs (single-nucleotide polymorphisms) (Mauro-Herrera et al., Reference Mauro-Herrera, Meerow, Borrone, Kuhn and Schnell2007). Among all, SSRs are considered ideal markers because of locus specificity, multi-allelic and codominant nature (Tautz, Reference Tautz1989), which are critical properties for assessing genetic diversity in outcrossing species.
Germplasm collections are directly exploited for association mapping of traits in perennial species (Font i Forcada et al., Reference Font i Forcada, Oraguzie, Reyes-ChinWo, Espiau, Socias i Company and Fernández i Martí2015). Traditional linkage mapping has limitations in perennial species because it requires pedigree-based mapping population such as recombinant inbred lines produced from cross between two diverse inbreds, which is extremely difficult to develop (Herrán et al., Reference Herrán, Estioko, Becker, Rodriguez, Rohde and Ritter2000; Baudouin et al., Reference Baudouin, Lebrun, Konan, Ritter, Berger and Billotte2006; Riedel et al., Reference Riedel, Riederer, Becker, Herrán, Kullaya, Arana-López, Peña-Rodríguez, Billotte, Sniady, Rohde and Ritter2009). A germplasm collection which displays excellent trait variability, genetically unstructured and free of linkage disequilibrium (LD) among unlinked loci is considered ideal for association analysis. Studies on association mapping of traits in coconut germplasm are rare. To date, a few preliminary association studies have been reported in coconut, which include association of RAPD markers with resistance to lethal yellowing disease (Cardeña et al., Reference Cardeña, Ashburner and Oropeza2003), resistance to eriophyid mite (Shalini et al., Reference Shalini, Manjunatha, Lebrun, Berger, Baudouin, Pirany, Ranganath and Prasad2007) and gene-based SSR markers with tree height (Xia et al., Reference Xia, Xiao, Liu, Luo, Mason, Fan, Yang, Zhao and Peng2014). In this study, our objectives were to analyse genetic diversity, population structure and LD in a world-wide collection of coconut genotypes (79), maintained at a regional coconut breeding station in Tamil Nadu state (India), using SSR markers and subsequently to perform an association analysis with fruit yield components in a subset of 44 genotypes.
Materials and methods
Plant material
In this study, a total of 79 coconut genotypes (34 exotic and 45 indigenous) were used (Table 1). Details of source/origin of these genotypes are provided in Table S1. The exotic genotypes represented 15 countries including Africa (5), Fiji Islands (2), Guam Islands (2), Indonesia (2), Jamaican Islands (1), Malaysia (4), Micronesia (1), Panama (1), Papua New Guinea (1), the Philippines (8), Thailand (2), Trinidad (1), Solomon Islands (1), Sri Lanka (2) and Vietnam (1). The indigenous genotypes represented different parts of India: Andaman and Nicobar Islands (5), Andhra Pradesh (1), Goa (3), Karnataka (2), Kerala (4), Lakshadweep Islands (2), Tamil Nadu (27) and West Bengal (1). Fifty genotypes were maintained at Coconut Research Station (CRS), Tamil Nadu Agricultural University (TNAU), Aliyarnagar (10.4881514°N, 76.9657343°E), Tamil Nadu State, India; 13 at CRS, TNAU, Veppankulam (10.44895°N, 79.34915°E), Tamil Nadu State, India and 12 were from farmers’ fields located at three districts namely Nagercoil (8.1700°N, 77.4300°E), Theni (10.0090°N, 77.4700°E) and Coimbatore (11.0183°N, 76.9725°E) of Tamil Nadu State, India and four from Coconut Nursery, TNAU, Coimbatore, India. The coconut genotypes were established at TNAU with the support of Indian Council of Agricultural Research (ICAR), New Delhi through its All India Coordinated Research Programme on Palms (AICRP-Palms).
Table 1. Details of 79 coconut genotypes used in this study

a Genotypes were coded and actual names are provided in supplementary information (Table S1); the genotypes in bold were used for association analysis.
Measurements on fruit traits
A subset of 44 genotypes maintained at CRS, TNAU, Aliyarnagar, Tamil Nadu State, India was of uniform age (22 years old); hence, it was considered for phenotypic measurements. Evaluation of trees for fruit component traits was carried out for a period of 3 years (2011–2013) consecutively. For each genotype, observations on fruit traits were recorded (12 nuts/palm/year) as per the standard descriptors (Ratnambal et al., Reference Ratnambal, Nair, Muralidharan, Kumaran, Bhaskara Rao and Pillai1995), which are briefly described below.
-
i. Fruit length – length between the two polar zones in cm.
-
ii. Fruit breadth – measured at the equatorial zone of the fruit in cm.
-
iii. Fruit weight – weight of the whole fruit (10-month old) in g.
-
iv. Husk thickness – measured from the pericarp of the fruit to the outer shell of the nut in cm.
-
v. Nut weight – weight of the dehusked nut in g.
-
vi. Kernel weight – weight of the kernel after separation from the shell in g.
-
vii. Kernel thickness – measured in split nuts in cm.
-
viii. Shell thickness – measured in split nuts in cm.
-
ix. Copra content – weight of the copra in g.
-
x. Nut yield – number of matured nuts per palm per year.
DNA extraction
DNA isolation was carried out using a high salt concentration method described by Angeles et al. (Reference Angeles, Laurena and Tecson-Mendoza2005) with some modifications in the sample collection and initial extraction conditions. Two to three fresh whole leaflets were collected from the second topmost frond without any damage. The samples from different locations were packed in ziplock covers and transported to laboratory under room temperature condition. The samples remained green and fresh for about 3 d. A day before DNA extraction, pestle and mortars were placed in deep freezer (−80°C) for pre-chilling. About 10 ml of the DNA extraction buffer was added to 50 ml falcon tubes (sterilized) and pre-heated to 65°C in water bath. The fresh leaflets were cut into small bits of about 5 cm length and were quickly dropped into the pre-chilled pestle and mortar (−80°C) containing liquid nitrogen. Care was taken to avoid browning of leaf samples. Immediately, 500 mg of PVP (polyvinylpyrrolidone) was added and the leaf samples were ground to fine powder. The powdered samples were quickly transferred (before thawing) to the falcon tubes containing 10 ml of pre-heated DNA extraction buffer. Then, 1 ml of 20% SDS (sodium dodecyl sulphate) and 50 µl of β-mercaptoethanol were added. The contents were mixed thoroughly, incubated at 65°C for 1 h at water bath and centrifuged at 15,000 rpm for 15 min at 4°C. The supernatants were carefully transferred to fresh falcon tubes. For every 1 ml of supernatant, 250 µl of 3 M sodium acetate and 1 ml of ice cold absolute isopropanol were added. The resulting solution was mixed by gentle inversion followed by incubation for 20 min at −20°C for DNA precipitation to happen. The DNA was hooked out and washed with 70% ethanol twice and suspended in 1 ml of TE buffer. The DNA was further purified by adding about 100 µl of 3 M sodium acetate and 2 ml of pre-chilled absolute alcohol, mixing gently and incubating at 4°C for 30 min. Then, the DNA was hooked out or pelleted, washed with 70% ethanol, air dried for 2 h and dissolved in TE buffer before storing at −20°C until further use. The quality and quantity of DNA were checked by loading 3 µl of DNA sample on 1% agarose gel along with the standard λ DNA marker with ethidium bromide staining. Based on the results of quantification, the stock DNA of all samples were diluted using sterile distilled water to have working samples with approximately 10 ng/μl concentration for SSR analysis.
SSR analysis
A set of 48 SSR primer pairs was selected for genotyping work from the Tropgene database (http://www.cogentnetwork.org/tropgene-database), which was developed by Centre International de Recherches en Agronomie pour le Développement (CIRAD), Montpellier, France. These primers with known linkage groups (LG) and map positions were selected in order to have a random coverage of markers throughout 16 chromosomes of coconut. Number of markers on each LG was as follows: LG1-5, LG2-5, LG3-2, LG4-5, LG5-1, LG7-1, LG8-4, LG9-3, LG10-4, LG11-4, LG12-2, LG13-7, LG14-1, LG15-3 and LG16-1. The details of SSR loci, genetic map positions and the sequences of primer-pairs are provided in Table S2.
The PCR was carried out in 20 µl volume containing 4 µl of genomic DNA (10 ng/μl), 2.0 µl of 10X Taq buffer containing 1.5 mM MgCl2 (20 mM stock), 2.0 µl of dNTP (2.5 mM of each dNTP), 1.0 µl each of forward and reverse primer (100 pM/μl stock), 0.5 µl of Taq DNA polymerase (3U/μl), and 9.5 µl of sterile water. PCR cycles consisted of an initial denaturation step at 94°C for 5 min, followed by 35 cycles at 94°C for 30 s for denaturation, 1 min at 51°C for primer annealing, and 1 min at 72°C for extension. This was followed by a final extension step at 72°C for 5 min. About 3 µl of PCR products were run on 6% polyacrylamide gel electrophoresis (PAGE) at 150 volts for 3 h and resolved by silver staining procedure described by Panaud et al. (Reference Panaud, Chen and McCouch1996). The SSR alleles were scored as allele 1, 2, 3, etc. based on size (bp) (approximate).
Statistical analysis
Basic statistics of trait variation
Mean, range and standard deviation (SD) for each trait were obtained using the ‘Data Analysis Tools’ available in the standard Microsoft Excel program.
Genetic diversity estimates
Number of alleles (N A), frequency of major alleles (M AF), gene diversity (expected heterozygosity, He) and polymorphism information content (PIC) were obtained using the software program PowerMarker version 3.25 (Liu and Muse, Reference Liu and Muse2005).
Cluster analysis
Hierarchical clustering based on Ward's method (Ward, Reference Ward1963) was used to group genotypes as implemented in DARwin software version 5 (Dissimilarity Analysis and Representation for windows) V.5.0.158 (Perrier and Jacquemoud-Collet, Reference Perrier and Jacquemoud-Collet2006) (available at http://darwin.cirad.fr/).
Population structure
STRUCTURE 2.3.2 program (Pritchard et al., Reference Pritchard, Stephens, Rosenberg and Donelly2000) was used to detect the number of populations within a collection of 79 coconut genotypes. The membership of each genotype was tested from K = 1 to K = 10 (K = putative number of populations) with the admixture model, along with a burn-in period of 100,000 and a run length of 100,000. Subsequently, the ΔK measure (Evanno et al., Reference Evanno, Regnaut and Goudet2005) was used to estimate the optimum number of populations using the online version of Structure harvester (http://tayloro.biologyucla.edu/Struct_harvest) developed by Earl and von Holdt (Reference Earl and vonHoldt2012). A value of K was selected when the estimate of ΔK peaked in the range of 1–10 and inferred ancestry estimates of individuals (Q-matrix) (membership coefficients) were derived for the selected population (Pritchard et al., Reference Pritchard, Stephens, Rosenberg and Donelly2000). The genotypes with membership coefficient ≥0.75 were assigned to the respective population and <0.75 were assigned to the admixture group.
Estimation of LD between SSR loci
The statistic, squared allele frequency correlation (r 2) was used to determine LD between SSR loci (pairwise) as implemented in the software program PowerMarker version 3.25 (Liu and Muse, Reference Liu and Muse2005) with 1000 permutations. The LD between loci was considered significant when r 2 values were >0.1 at P < 0.0001. The r 2 values range from 0 to 1. When r 2 = 0, two loci are presumed to be in complete linkage equilibrium and when r 2 = 1, the loci are presumed to be in complete LD. Arbitrarily, LD between two SSR loci is considered significant when r 2 value exceeds 0.1 (Abdurakhmonov and Abdukarimov, Reference Abdurakhmonov and Abdukarimov2008).
Association analysis
A subset of 44 coconut genotypes (collection of CRS, Aliyarnagar) was considered for association analysis because the trees were of uniform age. Association analysis was carried out based on general linear model (GLM) as implemented in TASSEL (Bradbury et al., Reference Bradbury, Zhang, Kroon, Casstevens, Ramdoss and Buckler2007). The population membership estimates (Q-matrix) obtained from the Structure software was combined as covariate in the association analysis. This is helpful specially to account for population structure effect on the association analysis. Correction for multiple testing was applied to P-values obtained from GLM using the positive false discovery rate (FDR) method as implemented in software program QVALUE (Storey and Tibshirani, Reference Storey and Tibshirani2003). The q-value is a measure of significance in terms of FDR similar to the P-value that relates to the false-positive rate. Marker trait associations having q≤0.1 (arbitrary) were declared significant (Iquira et al., Reference Iquira, Humira and François2015). The P and q values determine whether a locus is associated with the marker and the marker R 2 evaluates the magnitude of the locus effect (Agrama et al., Reference Agrama, Eizenga and Yan2007).
Results
Trait variation
Fruit component traits of coconut namely fruit length, breadth, weight, husk thickness, nut weight, kernel weight, kernel thickness, shell thickness, copra content and nut yield displayed quantitative variation in the collection of 44 coconut genotypes. Mean, range and SD of traits in the coconut genotype panel from the evaluation trial for three consecutive years (2011–2013) are presented in Table 2.
Table 2. Variation for fruit component traits in a panel of 44 coconut genotypes based on evaluation data over three consecutive years

Genetic diversity
All 48 SSR loci were polymorphic in the panel of 79 coconut genotypes. A total of 197 alleles was detected with an average of 4.1 alleles per locus. The N A at each locus ranged from 2 (CnCirE1, CnCirD1, CnCirI4, CnCirG4, CnCir126) to 7 (CnCirC5, CnCir87, CnCirA4). Allele size (bp) (approximate) information for each SSR locus are provided in Table S2. The mean gene diversity was 0.573 and it ranged from 0.162 (CnCirE1) to 0.811 (CnCirC5). The average PIC value was 0.522 and it ranged from 0.149 (CnCirE1) to 0.785 (CnCirC5). Details of the genetic diversity measures are presented in Table 3.
Table 3. Measures of genetic diversity based on 48 SSR loci in a collection of 79 coconut genotypes

N A, number of alleles per SSR locus; M AF, major allele frequency; He, expected heterozygosity; PIC, polymorphism information content.
Genotypic clusters
Cluster analysis revealed two major clusters (C1 and C2) with four distinct sub-clusters (Fig. 1). The first group (C1) comprised of the Tall genotypes distinctly. Within this group, two sub-clusters (C1.1 and C1.2) could be distinguished. The first sub-cluster (C1.1) comprised of 26 Tall genotypes, which originated from the Indo-Atlantic Region (Laccadive Islands, Andaman and Nicobar Islands, Seychelles, Zanzibar, Tanzania), Caribbean Islands (San Blas and St. Vincent) and the South Asian countries namely Indonesia, Malaysia and Vietnam. The second sub-cluster (C1.2) consisted of 20 Tall genotypes, which were mostly of local ecotypes of Tamil Nadu (India), a genotype from the Car Nicobar Islands (India) and all genotypes of Sri Lankan origin used in this study.
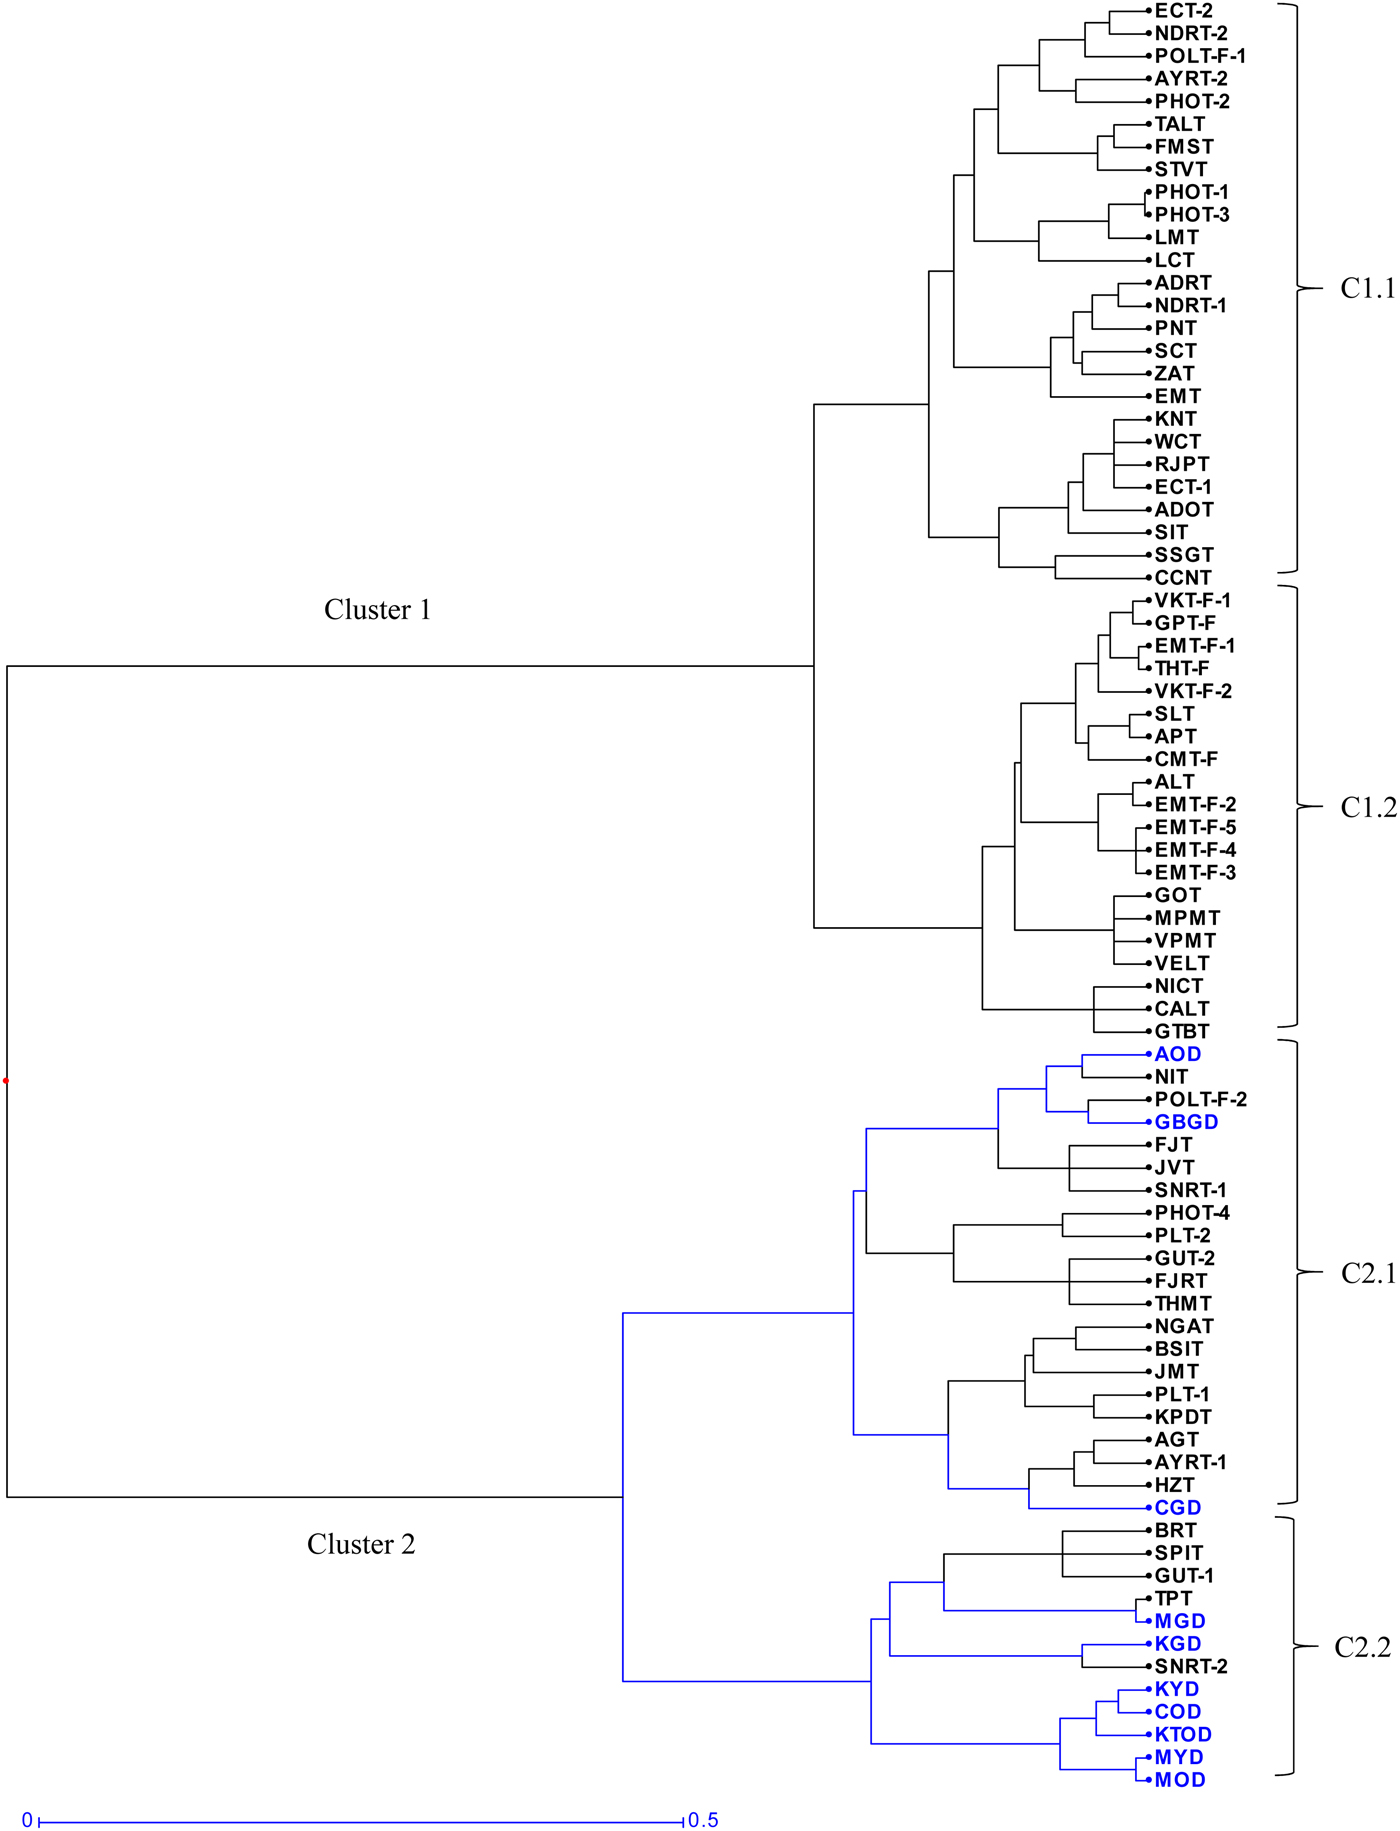
Fig. 1. Dendrogram showing genetic relationships of 79 coconut genotypes using 48 SSR loci based on Ward's method of Hierarchical clustering. Cluster 1 included genotypes from Indo-Atlantic to South Asia regions and cluster 2 included genotypes from Indo-Pacific to South-East Asia regions. C1.1, C1.2, C2.1 and C2.2 indicate sub-clusters. Dwarf types are indicated in blue colour.
The second group (C2) included all Dwarfs and Talls from the Indian Ocean, Oceania and South Pacific Islands, which were further grouped into two distinct sub-clusters (C2.1 and C2.2). The sub-cluster (C2.1) included 21 genotypes (18 Talls and 3 Dwarfs). The sub-cluster (C2.2) comprised of 12 genotypes (7 Dwarfs and 5 Talls). Most of the orange and yellow coloured Dwarfs (Malayan Yellow Dwarf, Malayan Orange Dwarf, Chowghat Orange Dwarf, Kulasekaram Yellow Dwarf, Kenthali Orange Dwarf) except Andaman Orange Dwarf and the green Dwarfs (Ganga bondam, Chowghat Green Dwarf) grouped distinctly in a single sub-cluster (C2.2), irrespective of their geographic origin. The Talls included mostly the genotypes of Indian origin, the Philippines, Oceania (Melanesia, Micronesia and Polynesia) and South Pacific Islands (Fiji, Guam, New Guinea, and British Solomon Islands), which are towards the Australian continent.
Population structure
While performing STRUCTUE analysis, 50 data sets were obtained by setting the number of possible clusters (K) from 1 to 10 with five replications each. The mean posterior probability [LnP(D)] value for each given K increased with the increase of K, but no abrupt change in LnP(D) values was observed, hence the probable K value could not be inferred. However, the ΔK analysis (Evanno et al., Reference Evanno, Regnaut and Goudet2005), showed a sharp peak of ΔK at K = 2 (Fig. 2), suggesting two major populations. A secondary peak of ΔK was also observed at K = 4 (Fig. 2) indicating further sub-structuring, which were named as sub-populations P1, P2, P3 and P4. The genotypes were assigned to specific population based on the threshold value of membership coefficients (≥0.75). The values of membership coefficient for each genotype are presented in Table S1. Out of 79 genotypes, 47 could be assigned to either P1, P2, P3 or P4 unambiguously and the remaining 32 genotypes were considered admixture types. P1 included eight genotypes (COD, KTOD, KGD, KYD, MGD, MOD, MYD and TPT) from South Asia, which were mostly Dwarf with the exception of one. P2 included 13 Tall genotypes (AGT, ADOT, AYRT-1, GUT-2, HZT, JMT, KPDT, KNT, NDRT-2, PHOT-4, PNT, TALT and ZAT), which represented Indo-Atlantic, South-East Asia and South Asia. P3 included four Tall genotypes (FJT, GUT-1, PLT-2 and PHOT-2), which represented Oceania and South-East Asia. P4 included 22 genotypes (ALT, APT, CALT, SLT, ECT-1, EMT-F-2, EMT-F-3, EMT-F-4, EMT-F-5, GPT-F, GTBT, LMT, NICT, PHOT-3, POLT-F-1, SNRT-2, SIT, THT-F, VKT-F-1, VKT-F-2, VELT and VPMT), which were mostly from India and the Philippines. The STRUCTURE plot for K = 4 is presented in Fig. 2.
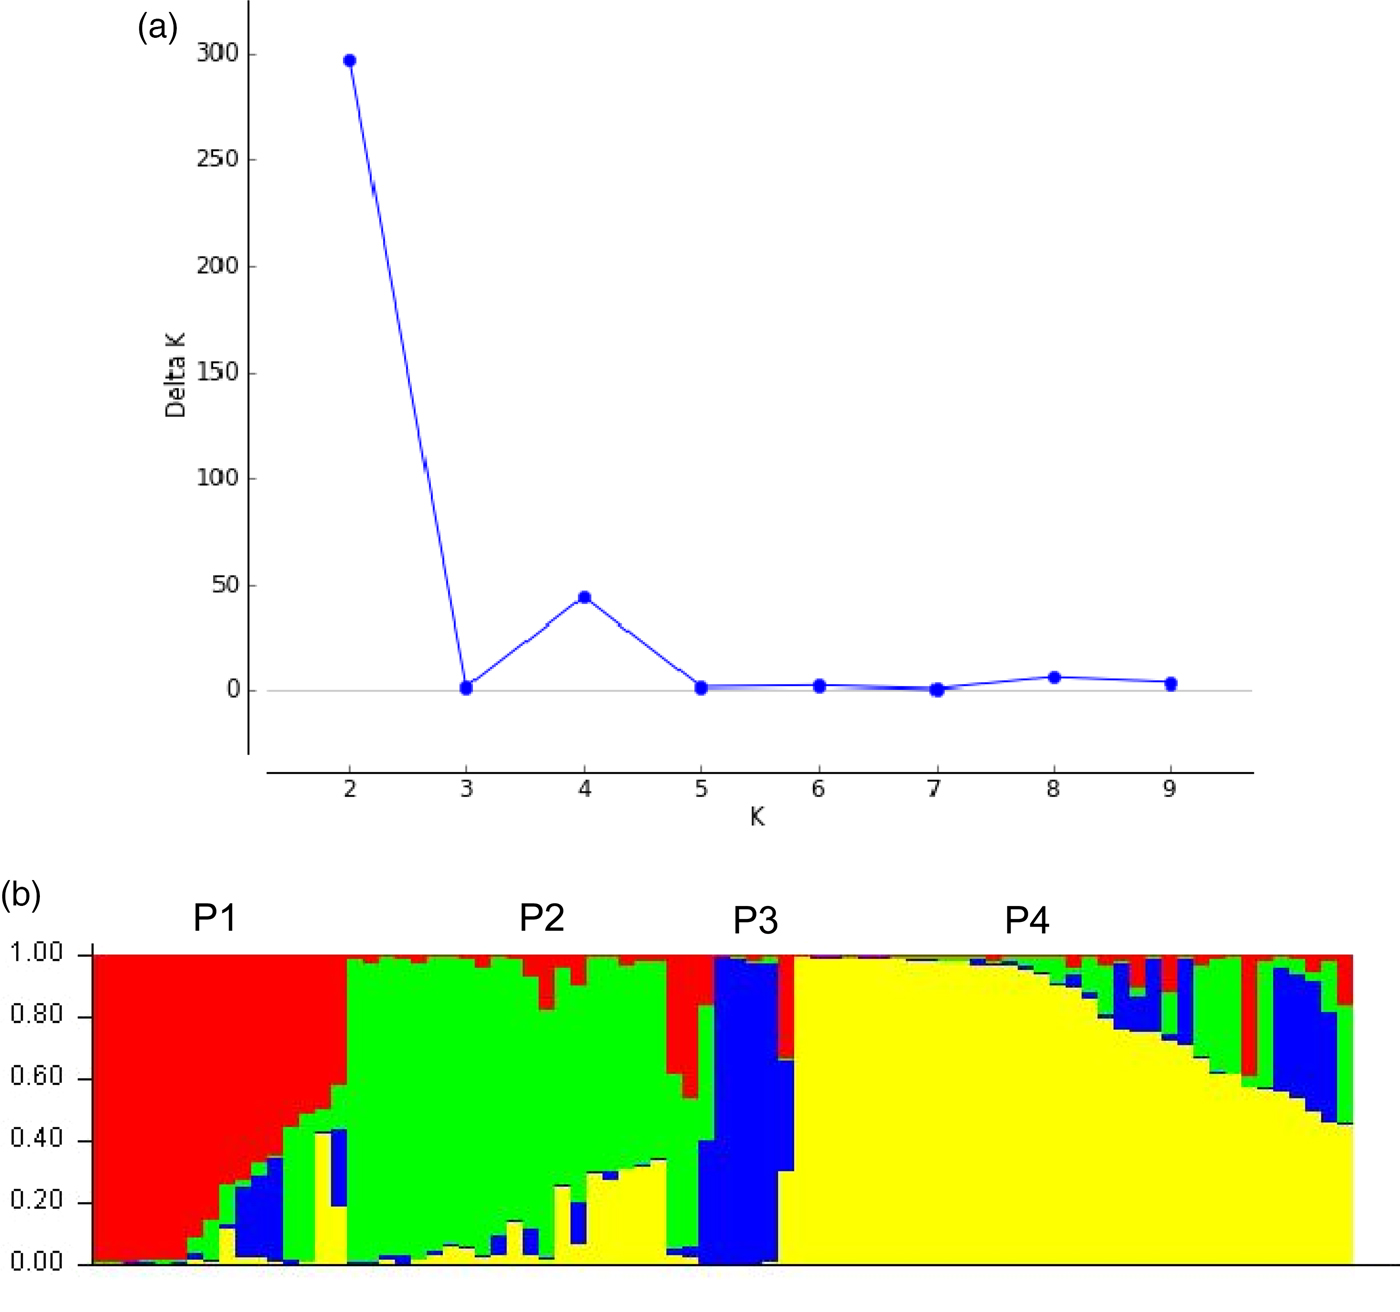
Fig. 2. Prediction of sub-populations (K = 4) in a collection of 79 coconut genotypes using Evanno method in the STRUCTURE analysis (a) and STRUCTURE plot depicting sub-populations (b). P1, P2, P3 and P4 indicate sub-populations.
LD between SSR loci
Overall, a total of 1128 SSR locus-pairs were analyzed for LD. The r 2 ranged from 0.0001 to 0.2283 with a mean of 0.0247. Out of 1128 marker pairs, 27 were in LD across LG with a mean r 2 of 0.1480, which indicated that the LD among SSR loci tested in the population was low (2.4%). Two closely located locus-pairs, on chromosome 1 (CnCirE4-CnCir226) and 2 (CnCir147-CnCir215) showed significant LD with a mean r 2 of 0.1401 as expected.
Association of SSR marker with fruit component traits
The SSR locus CnCir73 (LG1) showed putative association with fruit breadth, kernel weight, nut weight and copra content at FDR (q-value) ≤0.1 with the phenotypic contribution (R 2) ranging from 34 to 43% (Table 4).
Table 4. SSR marker putatively associated with fruit component traits in coconut germplasm through association analysis

LG, linkage group; R 2, phenotypic variance explained by the SSR locus; FDR, false discovery rate of ≤0.1 was considered for putative association of marker locus with the traits.
Discussion
In this study, SSR markers revealed that a world-wide coconut germplasm collection (79 genotypes) maintained at Tamil Nadu state (India) preserved moderately high level of genetic diversity and was strongly structured according to geographical origins. Number of SSR alleles ranged from 2 to 7 with an average of 4.1 alleles per locus, which corresponded with previous studies. Perera et al. (Reference Perera, Russell, Provan and Powell2001) reported 3–10 alleles with an average of seven alleles per locus in 33 coconut genotypes based on eight SSR loci. Rajesh et al. (Reference Rajesh, Arunachalam, Nagarajan, Lebrun, Samsudeen and Thamban2008a) reported 3–17 alleles with an average of 6.4 alleles per locus in 102 coconut palms based on 14 SSR loci. Dasanayaka et al. (Reference Dasanayaka, Everard, Karunanayaka and Nandadasa2009) identified a total of 79 alleles (range 3–10, average 4.9 alleles per locus) at 16 SSR loci in 43 coconut genotypes. Ribeiro et al. (Reference Ribeiro, Baudouin, Lebrun, Chaves, Brondani, Zucchi and Vencovsky2010) reported an average of 5.2 alleles per locus in 10 coconut populations based on 13 SSR loci. Overall, SSR analysis in coconut has revealed a minimum of 2 to a maximum of 17 alleles per locus (Teulat et al., Reference Teulat, Aldam, Trehin, Lebrun, Barker, Arnold, Karp, Baudouin and Rognon2000; Rajesh et al., Reference Rajesh, Nagarajan, Jerard, Arunachalam and Dhanapal2008b). The maximum number of 17 alleles was detected at the locus CncirE2 in a collection specific to Andaman and Nicobar Islands (Rajesh et al., Reference Rajesh, Nagarajan, Jerard, Arunachalam and Dhanapal2008b). Mean and range of PIC values of SSR loci (0.52, 0.14–0.78) obtained in the present study was also comparable with the previous studies. Rajesh et al. (Reference Rajesh, Arunachalam, Nagarajan, Lebrun, Samsudeen and Thamban2008a) reported that the PIC value ranged from 0.41 to 0.89 among 14 SSR loci with an average of 0.61. Ribeiro et al. (Reference Ribeiro, Baudouin, Lebrun, Chaves, Brondani, Zucchi and Vencovsky2010) reported that the PIC value ranged from 0.04 to 0.67 with a mean value of 0.44 among 13 SSR loci. In this study, the average gene diversity (He) ranged from 0.16 to 0.81 with an average of 0.57. Similar levels of He estimates (range 0.42–0.66) were reported from other coconut germplasm collections in Brazil (Ribeiro et al., Reference Ribeiro, Baudouin, Lebrun, Chaves, Brondani, Zucchi and Vencovsky2010), Kerala and Pondicherry region (Deva Kumar et al., Reference Deva Kumar, Thomas, Nair, Jerard, Rajesh, Jacob, Jayadev and Parthasarathy2011), Andaman and Nicobar Islands (Rajesh et al., Reference Rajesh, Nagarajan, Jerard, Arunachalam and Dhanapal2008b), Sri Lanka (Perera et al., Reference Perera, Russell, Provan and Powell2000) and France (CIRAD collection) (Gunn et al., Reference Gunn, Baudouin and Olsen2011).
It is likely that small sample size as well as genotyping of only a single palm per accession would have resulted in underestimation of SSR allelic variation in this study. In addition, some alleles would have been missed by the gel system (6% PAGE), which can resolve only the alleles of at least 5–10 bp differences. However, our main interest was to assess the global picture of the diversity within a collection of world-wide coconut accessions (maintained at our location) and not within each accession. We also observed that overall SSR allelic variation in the collection was comparable with the published reports, which have used varied number of palms per accession (Perera et al., Reference Perera, Russell, Provan and Powell2000, Reference Perera, Russell, Provan and Powell2001; Meerow et al., Reference Meerow, Wisser, Brown, Kuhn, Schnell and Broschat2003; Martinez et al., Reference Martinez, Baudouin, Berger and Dollet2010). Overall, the results suggested that genetic diversity in coconut germplasm is moderately high, which might perhaps be due to its outcrossing nature and wide distribution. Hamrick and Godt (Reference Hamrick and Godt1996) demonstrated that outcrossing species with long geographical range show more genetic diversity.
Cluster analysis divided the 79 coconut genotypes into two distinct groups with two major sub-clusters in each group indicating clear genetic structuring in the collection. The first cluster included most of the genotypes belonging to the Indo-Atlantic region comprising of Africa, Caribbean islands, Indian subcontinent and South Asia. Within this cluster, the ecotypes of Tamil Nadu, mostly collected from the farmer's field (>60 years old) in the southern districts, and Sri Lankan ecotypes were placed in a separate sub-cluster. These results were in agreement with Lebrun et al. (Reference Lebrun, N'cho, Seguin, Grivet and Baudouin1998) who reported that the West African ecotypes were related to the Indian and Sri Lankan ecotypes. This clustering also supported the hypothesis of spread of coconut along the Atlantic Coasts of Africa and to the Panama region through nuts originating from the Indian Ocean.
The second group represented the Indo-Pacific Ocean basin which included all Talls belonging to the Indian Ocean, Oceania, South-East Asia and Pacific Islands along with the Dwarfs. This type of clustering pattern supports the hypothesis that Dwarf varieties could have originated from South Pacific or the South-East Asian region (Lebrun et al., Reference Lebrun, Grivet, Baudouin, Oropeza, Verdeil, Ashburner, Cardeña and Santamaría1999 and Gunn et al., Reference Gunn, Baudouin and Olsen2011). Manimekalai and Nagarajan (Reference Manimekalai and Nagarajan2006) also observed the same relationship that Laccadive Dwarf and Chowghat Orange Dwarf from India representing South Asia, clustered with South Pacific Talls. Similarly, Perera et al. (Reference Perera, Russell, Provan and Powell2000) reported that Sri Lankan Dwarfs did not group with Sri Lankan Talls, but grouped with South-East Asian Tall coconuts. Lebrun et al. (Reference Lebrun, N'cho, Seguin, Grivet and Baudouin1998) reported that African Dwarfs clustered with Far East and Pacific Tall coconuts. Similar to the findings of the current study, previous studies have also observed that South Asian and South-East Asian Talls such as Spicata and San Ramon, shared the cluster along with Dwarf genotypes suggesting that these Tall genotypes could have a common putative origin similar to Dwarfs from South-East Asia (Lebrun et al., Reference Lebrun, N'cho, Seguin, Grivet and Baudouin1998; Parthasarathy et al., Reference Parthasarathy, Geethalakshmi and Niral2004 and Dasanayaka et al., Reference Dasanayaka, Everard, Karunanayaka and Nandadasa2009). In this study, the green Dwarfs grouped with the Talls in the South-East Asia and Pacific group while the orange- and yellow-coloured Dwarfs grouped separately irrespective of their geographic origin. Using RAPD markers, Daher et al. (Reference Daher, Pereira, Tupinambá, Amaral Junior, Aragao, Ribeiro, Oliveira and Sakiyama2002) and Upadhyay et al. (Reference Upadhyay, Jayadev, Manimekalai and Parthasarathy2004) also found that Malayan Dwarf genotypes clustered with the Brazilian and Indian Dwarf genotypes, respectively.
Although the dendrogram depicted a clear distinction between the Indo-Atlantic and the Indo-Pacific Ocean lineages of coconut genotypes, a few genotypes were mixed in both the groups. This suggested that the Indian Ocean region could have been a common point for the westward and eastward spread of coconut. These genotypes could have been dispersed either through human activity or could represent admixtures due to the outcrossing nature. For instance, Jamaica Tall, a native of the Caribbean region and Nigerian Tall of Africa clustered with the South Asian genotypes particularly of Indian origin, which was in agreement with Manimekalai and Nagarajan (Reference Manimekalai and Nagarajan2006). Similarly, while most genotypes from the Philippines region clustered with South-East Asia and South Pacific group as expected, the Philippines Ordinary Tall genotypes with variations in the nut colour clustered with the Indo-Atlantic genotypes. Although dispersal through human activity cannot be ruled out, these results need to be interpreted with caution. It is also possible that these genotypes could indicate a hybrid or admixture from the native population due to outcrossing when domesticated over a period of time along with other exotic genotypes as part of the germplasm conservation programme.
The performances of the hierarchical clustering technique in germplasm collections have been proven with phenotypic as well as molecular data (Franco et al., Reference Franco, Crossa, Taba and Shands2005; Odong et al., Reference Odong, van Heerwaarden, Jansen, van Hintum and van Eeuwijk2011). In the hierarchical clustering technique, UPGMA (Sokal and Michener, Reference Sokal and Michener1958) and Ward (Ward, Reference Ward1963) are the two most commonly used methods. While both the methods use Lance and William's recurrence formula (Lance and Williams, Reference Lance and Williams1967), the algorithms differ in the method of defining the pairwise distance between clusters. In the present study, initially the UPGMA method was tried but it resulted in several clusters with one to few genotypes in each cluster (data not shown). Hence, the Ward's method of hierarchical clustering was employed, as it tends to form balanced clusters that could include the outlying genotypes (Jobson, Reference Jobson1992). The dendrogram thus obtained, formed distinct clusters which matched with groups based on geographic origin. This result was in good agreement with Odong et al. (Reference Odong, van Heerwaarden, Jansen, van Hintum and van Eeuwijk2011). They compared both the UPGMA and Ward methods of hierarchical clustering in coconut and found that UPGMA placed outlying genotypes in separate clusters, which resulted in highly unbalanced clusters with many clusters containing one or two genotypes, and the clusters did not correspond with the geographic origin or passport data. The results of the current study also supported that Ward's method of hierarchical clustering would depict genetic relationships in coconut more realistically.
Presence of genetic structuring in coconut germplasm collection used in this study was further evident from the results of STRUCTURE analysis. Broadly, the collection was divided into two distinct populations (K = 2) namely the Indo-Atlantic Oceanic basins and Indo-Pacific Oceanic basins. Further sub-structuring was also clearly evident at K = 4. These groupings were quite similar to dendrogram obtained by the Ward's method of hierarchical clustering. Most of the genotypes from Indo-Atlantic and South Asia regions were found in P2 and P4. Similarly, most of the genotypes from Indo-Pacific and South-East Asia regions were found in P1, P2 and P3. Considerable number of genotypes (34) were admixture types. Several authors have documented population structure in different coconut germplasm collections namely France (CIRAD) (Gunn et al., Reference Gunn, Baudouin and Olsen2011), Florida (Meerow et al., Reference Meerow, Wisser, Brown, Kuhn, Schnell and Broschat2003; Mauro-Herrera et al., Reference Mauro-Herrera, Meerow, Borrone, Kuhn and Schnell2007), Brazil (Ribeiro et al., Reference Ribeiro, Baudouin, Lebrun, Chaves, Brondani, Zucchi and Vencovsky2010; Loiola et al., Reference Loiola, Azevedo, Diniz, Aragão, Azevedo, Santos, Ramos, Pereira and Ramos2016) and China (Xiao et al., Reference Xiao, Luo, Yang, Fan, Xia, Mason, Zhao, Sager and Qiao2013). It is reported that population structure in a species is affected by several factors including breeding systems, genetic drift, population size, seed dispersal, gene flow, evolutionary history and natural selection (Hamrick and Godt, Reference Hamrick and Godt1990). In general, outcrossing species tend to show less structure compared with selfing species. On the contrary, clear structuring was observed in the coconut collection used in this study. Therefore, the results must be viewed in light of the following aspects: (1) some level of population structure is expected in coconut because both modes of reproduction namely cross pollination and self-pollination exist, (2) most of the coconut germplasm collections hitherto analyzed for structure have been artificially established collections through introduction and they were not naturally occurring populations; therefore, chances for gene flow would have been limited. For instances, in Florida and Brazil, coconut is not a native species and it has been established through introductions; expectedly, these collections showed more population differentiation and (3) the small population size would have affected the structure results.
Extent of LD (non-random association of alleles at different loci) is an important characteristic of a germplasm collection or a natural population for genetic studies. The results showed that the level of LD between unlinked SSR locus-pairs was very low, which is expected because the SSR loci were chosen based on genetic map position carefully avoiding closely linked markers. Small percentage of unlinked loci were in LD, which might be caused by population structure, mating system, co-selection of allele combinations at different loci, etc. (Hartl and Clark, Reference Hartl and Clark1997). However, it may be noted that LD observed in the current study would have been underestimated due to small number of marker loci and small population size. Nevertheless, low level of LD between unlinked loci is a desirable feature of the current germplasm panel for its use in association mapping studies.
Association analysis showed that a single SSR locus CnCir73 had putative association with several traits namely fruit breadth, nut weight, kernel weight and copra content explaining high phenotypic variance (R 2 = 34–43%). The association of CnCir73 with many fruit component traits is expected because they are highly correlated (Geethanjali et al., Reference Geethanjali, Rajkumar and Shoba2014). Interestingly, the marker CnCir73 was also detected in a quantitative trait loci (QTL) mapping study for fruit component traits by Baudouin et al. (Reference Baudouin, Lebrun, Konan, Ritter, Berger and Billotte2006). This QTL on chromosome 1 within the marker interval 37/2-CnCir73 was reported to be associated with fruit weight, nut weight, shell weight and meat nut ratio (Baudouin et al., Reference Baudouin, Lebrun, Konan, Ritter, Berger and Billotte2006). Thus, the results of the current study also support the association of this genomic region with fruit yield component traits in coconut, which need to be ascertained by further studies. To date, studies on QTL mapping are very limited in coconut (Herrán et al., Reference Herrán, Estioko, Becker, Rodriguez, Rohde and Ritter2000; Lebrun et al., Reference Lebrun, Baudouin, Bourdeix, Konan, Barker, Aldam, Herrán and Ritter2001; Baudouin et al., Reference Baudouin, Lebrun, Konan, Ritter, Berger and Billotte2006; Riedel et al., Reference Riedel, Riederer, Becker, Herrán, Kullaya, Arana-López, Peña-Rodríguez, Billotte, Sniady, Rohde and Ritter2009) due to the great difficulty in developing mapping populations. Correspondence of the results from both association analysis and QTL mapping indicate that association mapping could be a useful alternative strategy for trait mapping in coconut.
However, it is important to note that the results of association analysis reported in this study is only preliminary and not conclusive due to small population size, which could lead to spurious associations. The germplasm panel also exhibited strong genetic structuring. Ideally, for a robust association study, an unstructured germplasm panel consisting of a large number of individuals must be genotyped at marker loci covering the whole genome and the phenotypic evaluation must be carried out at multiple locations. The use of large number of individuals in coconut has been a limitation due to perennial nature of the species and it would also be logistically demanding. In order to obtain reliable results, the population structure issue was addressed with the use of Q values as covariate in the model while performing the analysis. The FDR correction (q-value) of observed P values was also used to reduce the number of false-positive associations as suggested by Storey and Tibshirani (Reference Storey and Tibshirani2003). In a similar study, Xiao et al. (Reference Xiao, Luo, Yang, Fan, Xia, Mason, Zhao, Sager and Qiao2013) reported two SSR markers associated with height in a structured population containing 70 coconut accessions. A thorough genome-wide association study in a large germplasm panel is expected to provide more insights on genetic marker loci associations with phenotypic traits in coconut.
In conclusion, the present study revealed moderately high level of genetic diversity present in a coconut germplasm collection (79 genotypes) being maintained at TNAU, Coimbatore, one of the major coconut breeding centres in India, using a set of 48 SSR marker loci. The distance-based cluster analysis and the model-based structure analysis showed that the germplasm collection is genetically structured with two distinct lineages namely Indo-Atlantic-South Asia and Indo-Pacific-South-East Asia regions and further sub-divisions according to the geographical origin. The LD between unlinked SSR marker loci was very low (2.4%), which is a desirable feature for exploitation of this germplasm panel for association studies. In a preliminary association study, a single SSR locus CnCir73 on chromosome 1 was found to be putatively associated with fruit size and weight-related traits explaining high phenotypic variance (34–43%). Interestingly, this locus colocalized with a previously mapped QTL for fruit weight, nut weight, shell weight and meat nut ratio in coconut.
Supplementary Material
The supplementary material for this article can be found at https://doi.org/10.1017/S1479262117000119.
Acknowledgements
The authors thank Dr Senthilvel Senapathy, ICAR-IIOR for critical inputs on data analysis and Department of Science and Technology, Government of India for financial support through research grant No. SR/FT/LS-69/2010.


