Introduction
Common beans are an important grain legume grown in highly diverse agroecologies, especially in Latin America (Broughton et al., Reference Broughton, Hernández, Blair, Beebe, Gepts and Vanderleyden2003). The genetic resources of common bean consist of two major gene pools of wild and cultivated accessions: the Mesoamerican, originally from Central America, Mexico and Colombia, and the Andean from southern Peru, Bolivia and northern Argentina (Koenig and Gepts, Reference Koenig and Gepts1989). Cultivated Mesoamerican and Andean gene pools are subclassified into races according to their agronomic traits such as growth habit as well as agroecological adaptation. Andean landraces have been classified into three different races: Peru, Nueva Granada and Chile (Singh et al., Reference Singh, Gepts and Debouck1991).
The wild form of common bean is distributed from the north of Mexico to the north of Argentina (Gepts and Debouck, Reference Gepts, Debouck, van Schoonhoven and Voysest1991), and the genetic structure of common bean landraces reflects some of the structure of the wild types (Tohme et al., Reference Tohme, Gonzáles, Beebe and Duque1996). Domesticated common beans show differences in morphology, isozymes, phaseolins, and nuclear, chloroplast and mitochondrial DNA markers, which parallel those found in wild Mesoamerican and Andean beans (Gepts et al., Reference Gepts, Osborn, Rashka and Bliss1986; Becerra and Gepts, Reference Becerra and Gepts1994). This suggests events of independent domestication from local wild types and a founder effect associated with domestication in each region (Chacón et al., Reference Chacón, Pickersgill and Debouck2005, Reference Chacón, Pickersgill, Debouck and Arias2007; Papa et al., Reference Papa, Acosta, Delgado-Salinas and Gepts2005).
Genetic compatibility between wild and domesticated populations leads to wild–weedy–domesticated complexes, in sites where wild and cultivated beans are sympatric. Gene flow and genetic introgression from wild populations to domesticated ones or vice versa were reported in the Andes (Freyre et al., Reference Freyre, Ríos, Guzmán, Debouck and Gepts1996; Beebe et al., Reference Beebe, Toro, Gonzáles, Chacón and Debouck1997) and Mesoamerica (Papa and Gepts, Reference Papa and Gepts2003).
Apart from the food value, beans might also have been domesticated for their aesthetic value and symbolic use. Certain authors have suggested that they were used as a form of record keeping or non-phonetic writing in pre-Columbian cultures, on the basis of the seed forms and grain colours or pattern (Avila et al., Reference Avila, Avila, Brandolini and Rojas1987; Freyre et al., Reference Freyre, Ríos, Guzmán, Debouck and Gepts1996). In isolated valleys of the Andes, some traditional farmers grow and maintain seed mixtures of all sizes and colours, and children in rural areas still use beans with spherical shape known as ‘chuis’ as toys. In addition, special beans from Southern Peru and Bolivia pop when heated and are called ‘k'opurus’ or ‘nuñas’, which are consumed as a toasted snack (Tohme et al., Reference Tohme, Toro, Vargas and Debouck1995).
The objectives of this study were (1) to evaluate the use of common bean microsatellites for their ability to detect genetic diversity within germplasm from the Southern Andes, (2) to determine the genetic relationships and the structure of diversity within the groups of genotypes from wild and cultivated Phaseolus vulgaris and an outgroup of three related species and (3) to determine the correlation of genetic structure with geographical collection sites so as to evaluate landrace isolation in the valleys of the Southern Andes.
Materials and methods
Plant material
Accessions were selected from the Bolivian collection of Phaseolus beans maintained in the germplasm bank of the Pairumani Foundation (CIFP). Accessions were chosen based on their collection site information in order to evaluate among accession diversity in a representative set covering the full ecogeographic range of bean cultivation in this part of the Southern Andes. The germplasm was broadly distributed in origin; however, a majority of the accessions were from the sub-Andean valleys and a few from lowland areas of the Chaco and Chapare/Beni regions. Since the accessions were constituted from cultivars grown and marketed by traditional farmers, some were mixtures and these were separated into subsamples according to the grain colour, form or size, with each subsample constituting a new accession. The collection has been re-multiplied every 5 years in the field, sowing 100 seeds of each accession and harvesting all seeds of each accession together. In total, 174 accessions were evaluated for the genotyping work: 118 corresponded to landraces of dry beans, 33 to snap bean cultivars obtained by genetic improvement, two to weedy types and ten to wild P. vulgaris. In addition, an outgroup of eight Phaseolus augusti, two Phaseolus lunatus and one Phaseolus coccineus genotype was evaluated. Four additional cultivated genotypes of P. vulgaris provided by the Genetic Resources Unit of the CIAT were used as controls, two considered as representative of the Andean gene pool–G4494 (Calima) from Colombia and G19833 (Chaucha Chuga) from Peru – and two from the Mesoamerican gene pool – G5773 (ICA Pijao) from Colombia and Dorado (DOR364) from El Salvador. These genotypes had been used in previous microsatellite studies as a standard for each of the gene pools (Blair et al., Reference Blair, Giraldo, Buendía, Tovar, Duque and Beebe2006, Reference Blair, Díaz, Hidalgo, Díaz and Duque2007, Reference Blair, Díaz, Buendía and Duque2009; Díaz and Blair, Reference Díaz and Blair2006). To calculate the genetic diversity within a subset of the accessions, five were chosen at random from the collection, three from the group of cultivated P. vulgaris (accessions 55, 198 and 454), one from the group of wild P. vulgaris (accession 150) and one P. augusti (accession 140). In each case, 20 genotypes were evaluated per accession. In all cases, DNA was isolated from trifoliate leaf tissue from three plants of each accession, using a cetyl,tri-methyl ammonium bromide (CTAB) method and treated with RNase. For PCR amplifications, the DNAs in Tris-EDTA (TE) buffer were diluted to a concentration of 10 ng/μl.
Microsatellite amplifications
A total of 29 common bean microsatellites designed from coding (11 gene-based markers) and non-coding regions (18 genomic-derived markers) were used. PCR amplifications were performed in a PTC-100 thermal cycler (MJ Research, Watertown, MA, USA) as recommended previously (Yu et al., Reference Yu, Park, Poysa and Gepts2000, Gaitán-Solís et al., Reference Gaitán-Solís, Duque, Edwards and Tohme2002 and Blair et al., Reference Blair, Pedraza, Buendía, Gaitán, Beebe, Gepts and Tohme2003). The final MgCl2 concentration ranged from 1.5 to 2.5 mM depending on the microsatellite: 2.5 mM for BM151, BM152 and GATs11, 2 mM for BM137 and BM142, and 1.5 mM for all others. The PCR products were run on 4% polyacrylamide gel (29:1 acrylamide–bis-acrylamide) using Sequi-Gen GT sequencing units (Bio-Rad Laboratories, Inc., Hercules, CA, USA) at a constant 120 W power. A 10 bp molecular weight marker (Invitrogen, Carlsbad, CA, USA) was used for the estimation of allele sizes and the four control genotypes were run in all gels for the sake of comparison. The repeatability of the markers was verified in the whole collection using three microsatellites and all null alleles were confirmed by a second amplification. All the 29 microsatellites were used for the study of genetic diversity among the accessions, while nine were retained for the study of genetic diversity within the accessions.
Data analysis
For the study of among-accession genetic diversity, the entire microsatellite dataset was used for a factorial correspondence analysis (FCA) performed with the SAS program software version 9.1 (SAS Institute, Inc., Cary, NC, USA). The groups were defined using Euclidean distance and unweighted pair group method with arithmetic mean (UPGMA) clustering from the resultant coordinates of the FCA. Genetic distances were calculated as 1 − proportion of shared alleles (Bowcock et al., Reference Bowcock, Ruiz-Linares, Tomforde, Minch, Kidd and Cavalli-Sforza1994), also known as the absolute genetic distance (AGD), using Microsat software, from Minch (Reference Minch1997). Genetic distance data were then used for UPGMA clustering to construct dendrograms with the software NTSYS (Rohlf, Reference Rohlf2002). An analysis of molecular variance (AMOVA) was then carried out to determine the proportions of the molecular variance between and within the groups of accessions and to calculate the F st values which are a measure of the genetic differentiation among the populations, using GenAlex6 in Microsoft Excel (Peakall and Smouse, Reference Peakall and Smouse2005). Assignment tests were then conducted with the entire set of accessions, by means of Structure software (Pritchard et al., Reference Pritchard, Stehens and Donnelly2000) for each group of accessions that were defined according to the methods described above. Finally, the polymorphism information content (PIC) was calculated for each microsatellite, as discussed in Blair et al. (Reference Blair, Pedraza, Buendía, Gaitán, Beebe, Gepts and Tohme2003), and other parameters of genetic diversity such as number of polymorphic loci, allele frequencies and gene flow (N m) were also determined. The among-accession genetic diversity was calculated with an AMOVA to determine the variance within and between the accessions.
Results
Marker polymorphism and cross-species amplification
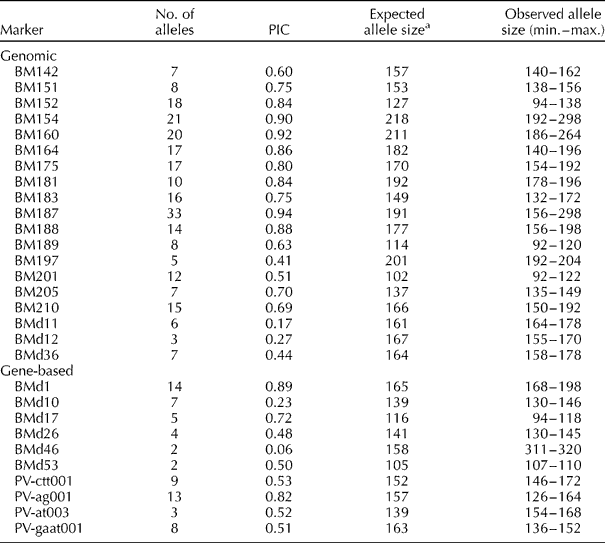
All the microsatellites analysed were polymorphic and showed high levels of allelic diversity. A total of 311 alleles were identified in the entire germplasm set, with an average of 10.7 alleles per marker. Considering the cultivated P. vulgaris accessions only, a total of 249 alleles were found with an average of 8.6 alleles per locus. The average allele number obtained with the genomic microsatellites and with the gene-based microsatellites in the entire set of genotypes were 12.8 and 6.7, respectively. Meanwhile, within the cultivated common beans only, these values were 10.5 and 5.0, respectively.
The maximum number of alleles found per marker for the genomic and gene-based microsatellites was 33 and 14 for BM187 and BMd1, respectively. The microsatellites BMd46 and BMd53, both gene-based markers, presented only two alleles each, while among the genomic microsatellites, BMd12 presented the lowest number of alleles, three. The observed allele sizes for all of the microsatellites studied agreed with the expected sizes of Yu et al. (Reference Yu, Park, Poysa and Gepts2000), Gaitán-Solís et al. (Reference Gaitán-Solís, Duque, Edwards and Tohme2002) or Blair et al. (Reference Blair, Pedraza, Buendía, Gaitán, Beebe, Gepts and Tohme2003, Reference Blair, Giraldo, Buendía, Tovar, Duque and Beebe2006). For the entire study, the average PIC values obtained with the genomic and gene-based microsatellites were 0.68 and 0.53, respectively (Table 1). For the cultivated P. vulgaris accessions only, the PIC values were 0.69 and 0.51 for the two types of markers, respectively. The highest PIC value was obtained with the genomic microsatellite BM187 and the lowest with the gene-based microsatellite BMd46.
Table 1 Number of alleles, polymorphism information content (PIC) and expected and observed allele sizes of common bean microsatellites evaluated in the Bolivian collection

a Definitions of genomic and gene-based microsatellites provided in Blair et al. (Reference Blair, Giraldo, Buendía, Tovar, Duque and Beebe2006).
In terms of cross-species amplification, PCR products were found for all the common bean microsatellites in the three outgroup species: P. augusti, P. lunatus and P. coccineus. Nevertheless, P. augusti genotypes had high percentages of null alleles, especially for BM175, BM205, BM160 and BM188. Repeat amplifications were used to confirm the lack of amplification. In comparison, within the cultivated P. vulgaris accessions, the frequency of null alleles was only 2.9%. Eight alleles were unique to the accessions of P. augusti (allele 192 in BM154, 140 in BM164, 92 in BM189, 311 in BMd46, 146 and 164 in PV-ctt001, 154 in PV-at003 and 146 in PV-gaat001).
Factorial correspondence analysis
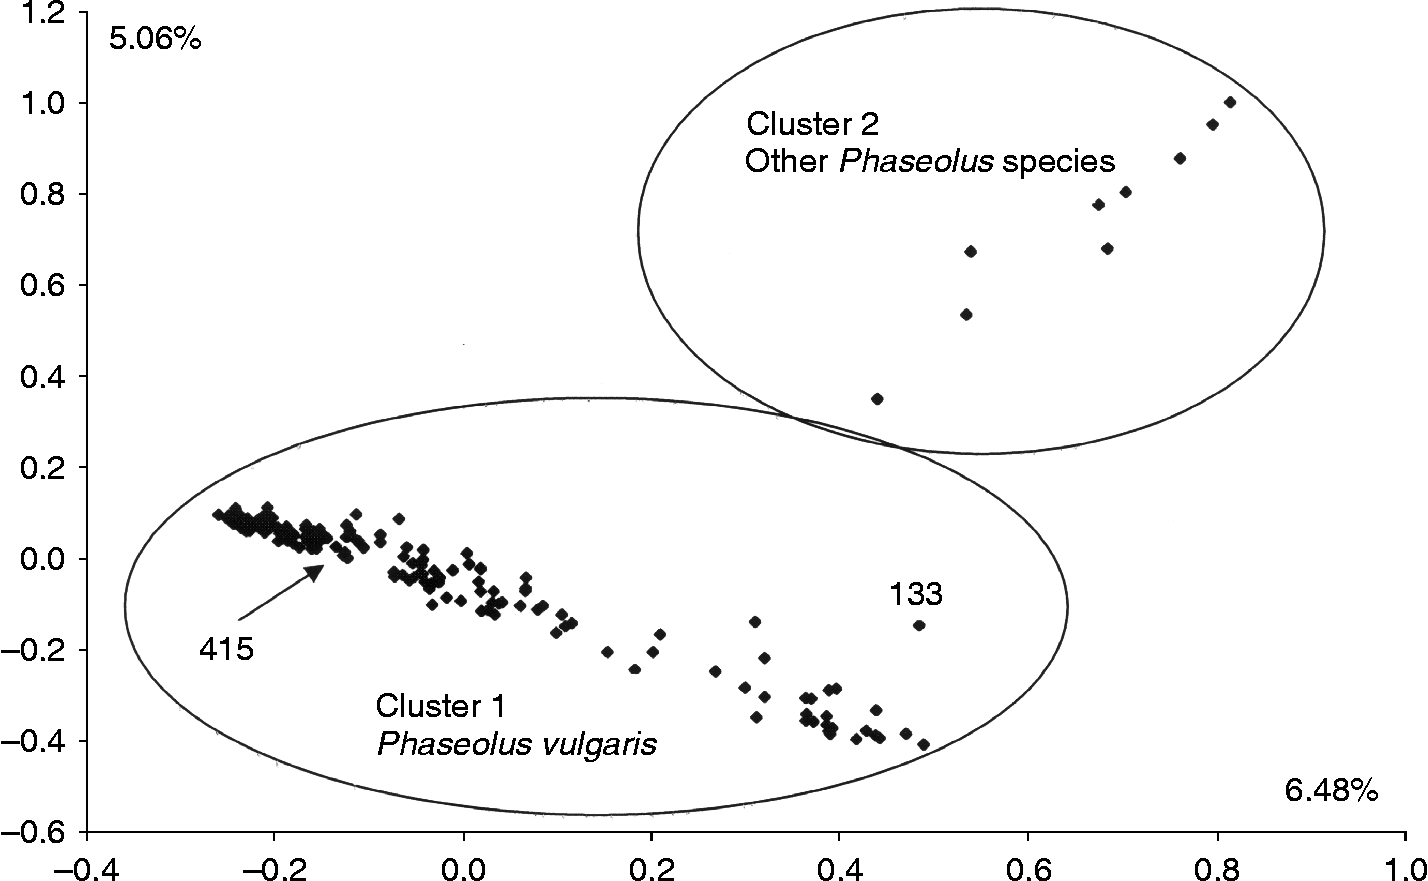
The FCA was first performed on the entire set of accessions (174), separating these into two clusters across the two first dimensions which explained together 11.54% of the variance (Fig. 1). The Euclidian distances from the FCA revealed that all P. vulgaris accessions (cluster 1) were separated from the accessions of other Phaseolus species (cluster 2). However, two accessions, 133 and 415 previously classified as P. lunatus and P. augusti, respectively, clustered inside P. vulgaris.

Fig. 1 FCA using 29 microsatellites for the set of 174 accessions from Bolivia including accessions of P. vulgaris, P. lunatus, P. augusti and P. coccineus. Ellipses were drawn on the basis of clusters obtained from the FCA and UPGMA. Highlighted accessions are numbered specifically and discussed in the text.
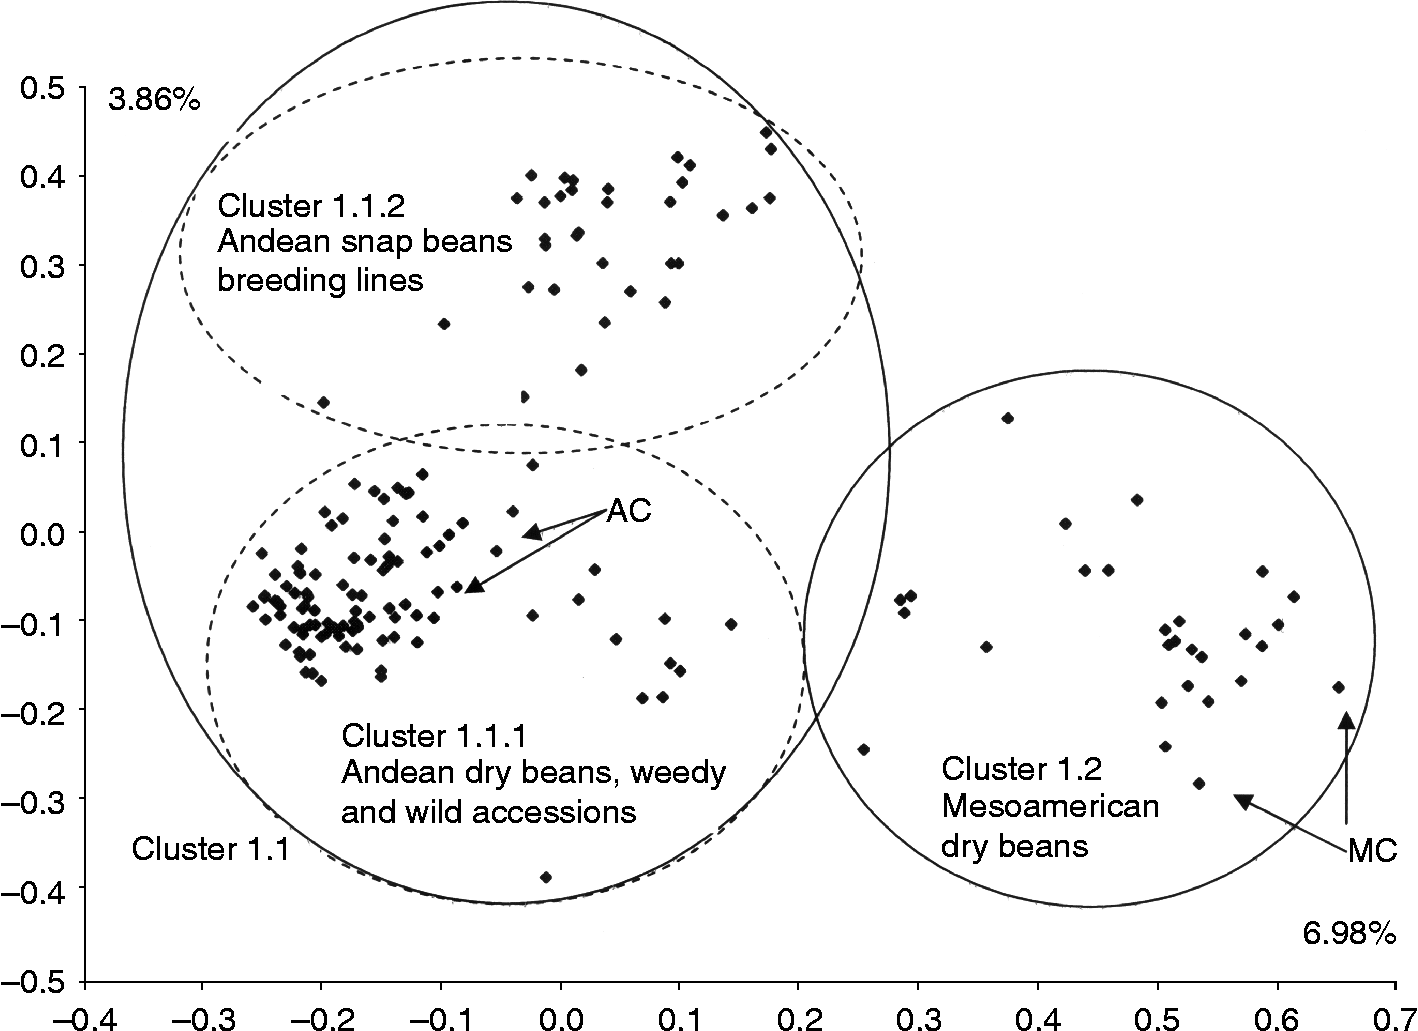
In order to focus the study on the germplasm of P. vulgaris, the 11 accessions confirmed to be of other Phaseolus species were eliminated for a second FCA which was run exclusively on the 163 accessions of P. vulgaris (cluster 1). The results separated P. vulgaris into two groups along the two first axes which explained 10.84% of the variance (Fig. 2): the first group was associated with the Andean controls (cluster 1.1) and the second group with the Mesoamerican controls (cluster 1.2). Cluster 1.1 was further divided into two groups; one subgroup corresponded to the landraces, weedy accessions and all wild beans (cluster 1.1.1) and the other one contained the snap beans from CIFP (cluster 1.1.2) plus three landraces (61, 123 and 264). Two snap beans (368 and 379), on the other hand, clustered with the Mesoamerican controls.
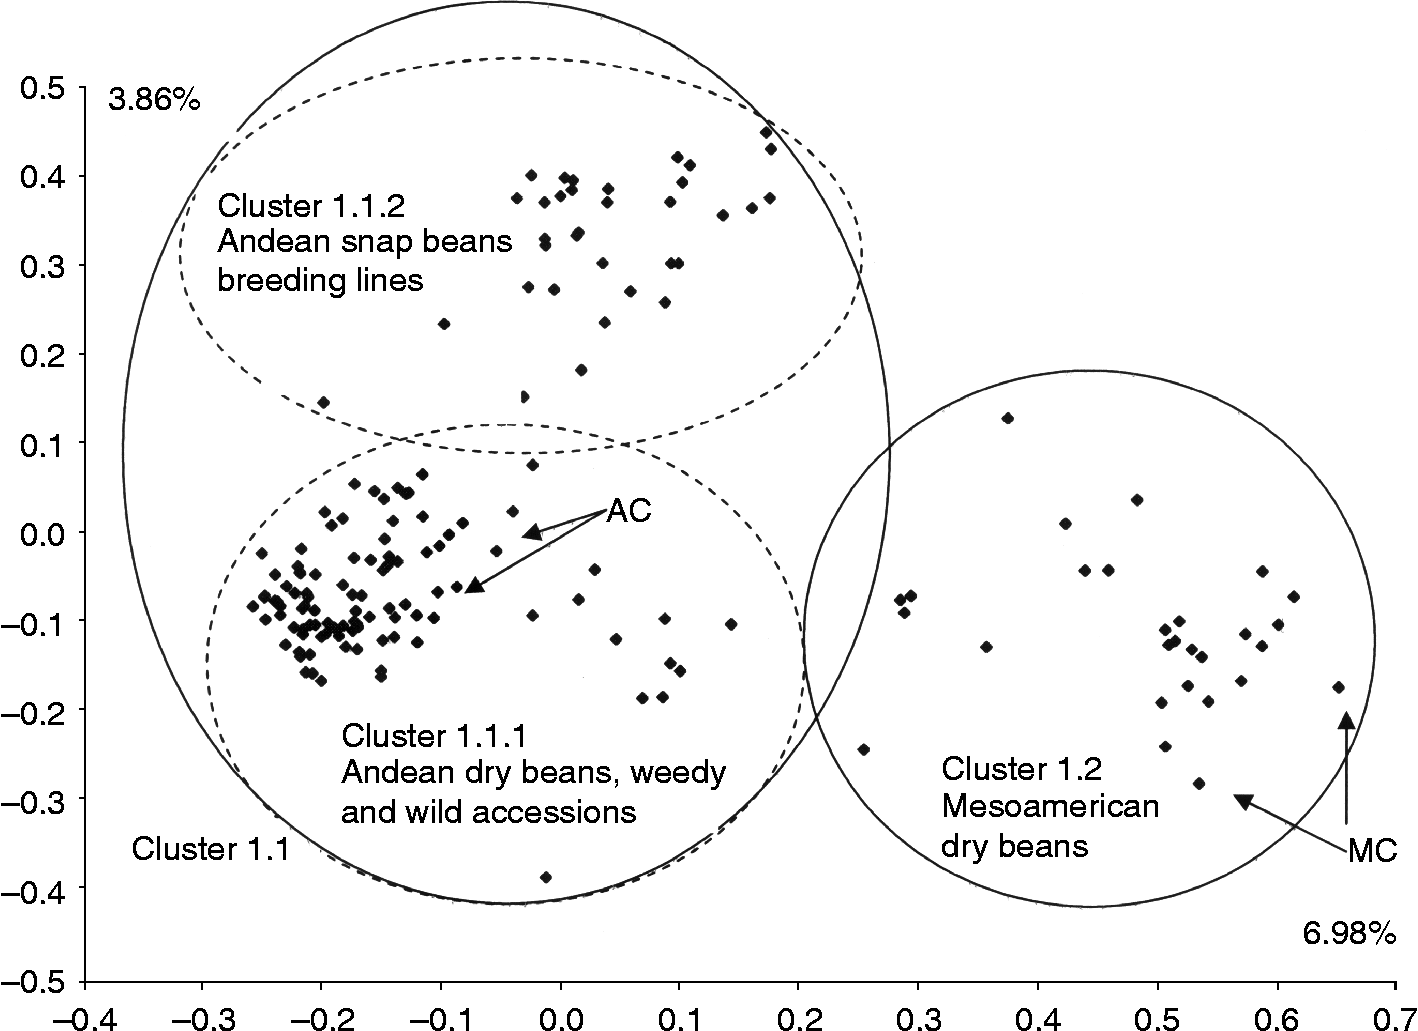
Fig. 2 FCA using 29 microsatellites for the 163 accessions of P. vulgaris only, including wild, weedy and cultivated common bean genotypes. These accessions including the dry beans and snap beans were compared with four controls, two considered as representative of the Andean gene pool (AC) and two of the Mesoamerican gene pool (MC). In all cases, ellipses were drawn on the basis of clusters obtained from the FCA and UPGMA.
In the third and final FCA, the snap bean genotypes (cluster 1.1.2) were eliminated from the analysis and the landraces and wild accessions (cluster 1.1.1) were analysed alone. In these results, the two first axes accounted for 11.69% of the variation with the separation of the Andean and Mesoamerican groups. Within the accessions that grouped with the Andean controls (cluster 1.1.1), the domesticated common bean and weedy genotypes (cluster 1.1.1.1) were separated from the wild accessions (cluster 1.1.1.2); however, the wild accession 416 clustered with the cultivated accessions. Meanwhile, the wild accession 141 was outside of the overall P. vulgaris groups.
Genetic relationships among the accessions
Genetic relationships among the accessions were observed with UPGMA clustering based on the AGD coefficient. A clear separation of P. vulgaris from the nine accessions of the other species of Phaseolus was obtained, except for the accessions 415 (P. augusti) and 133 (P. lunatus) which clustered within the P. vulgaris group, as had occurred in the FCA described above. A mean genetic distance of 0.81 was found between P. vulgaris and the other species. Within the P. vulgaris accessions, two major groups were observed, one associated with the Andean controls and the other with Mesoamerican controls, once again as in the FCA. Accession 133 clustered with the Mesoamerican accessions while 415 clustered with the Andean accessions. Overall, these two gene pools were at a genetic distance of 0.78.
Thirty accessions clustered with the Mesoamerican controls (the same 28 accessions as in the FCA including genotypes 133, 202 and 203). Within the accessions that grouped with both Andean controls, two wild beans (genotypes 150 and 414) were first separated from the rest. All the other wild beans, except one (416), clustered separately from the cultivated Andean genotypes.
Two groups were then formed inside the accessions of cultivated common beans that clustered with the Andean controls. The first was composed of landrace accessions that clustered with the Andean control Calima (G4494). The second group showed the lowest pairwise genetic distances and contained all the snap bean accessions plus accession 264. Meanwhile, P. lunatus accession 415 and wild bean accession 416 were clustered with the dry bean landraces, as in the FCA. Finally, accessions of spherical popping beans clustered in three different subgroups.
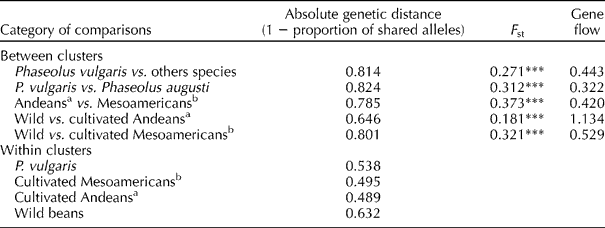
AMOVA showed significant differences at the 0.001 level of probability, among the clusters detected with the UPGMA analysis (Table 2). The F st value between P. vulgaris and the other species was 0.271. Population differentiation was the highest between the cluster containing the Andean controls and the one containing the Mesoamerican controls with an F st value of 0.373, whereas it was only 0.181 between the clusters of Andeans landraces and wild types. N m was low between the Andean and Mesoamerican (0.420) groups and high between the Andean landraces and wild accessions within P. vulgaris (1.134).
Table 2 Results of molecular analyses of variance for Southern Andean accessions

***Significant at the 0.001 level.
a Considering landraces that grouped with Andean controls in UPGMA.
b Considering landraces that grouped with Mesoamericans controls in UPGMA.
Relationship among genetic and geographical information
In addition to characterizing the molecular dataset, geographical data of the collection sites of the accessions (latitude and longitude) were analysed and compared with the genetic distance data to determine the correlation between geographical and genetic distance matrices by means of a Mantel test (Mantel, Reference Mantel1967). The spatial structure of the geographical and genetic diversity was investigated using the autocorrelation method of Smouse and Peakall (Reference Smouse and Peakall1999).
The correlation coefficient among geographical distance classes was summarized in a correlelogram (Fig. 3(a)). The Mantel's test revealed a significant correlation between the geographical distance matrix based on the latitude and longitude data and the genetic distance matrix based on the AGD (r xy = 0.328, P = 0.001). However, for medium and high genetic distances (from about 0.3), all classes of genetic distance were encountered. Spatial autocorrelation confirmed this observation by showing a significant correlation between the geographical and genetic distances (r = 0.063, P = 0.001) at geographical distances at or below 100 km but not above this distance (Fig. 3(b)).

Fig. 3 Correlations between geographical and genetic distances for 130 P. vulgaris accessions (landraces, weedy and wild beans) and (a) results of Mantel's matrix autocorrelation test and (b) best fit of r-values across geographical distance in km with significance thresholds in the upper (U) and lower (L) limits (a colour version of this figure can be found online at http://journals.cambridge.org/pgr).
The correlation value decreased (r = 0.004, − 0.014, − 0.017 and − 0.019) when the distance among the classes increased (200, 300, 500 and 1000 km, respectively). This observation suggested that the variability was correlated with the proximity of the collection site when it was less than 100 km. The relationship among the genetic and geographical information was studied for the landraces and wild accessions of P. vulgaris, disregarding breeding materials and the other species of Phaseolus.
Within-accession genetic diversity
Variability was revealed inside all the accessions of P. vulgaris but not in the accession of P. augusti that was evaluated. The AMOVA showed high molecular variance among the accessions (64%) and low within the accessions (36%) overall. The F st values were high ranging from 0.58 between the groups of P. vulgaris to 0.76 when comparing the accessions from the two species, P. vulgaris with P. augusti. All individuals belonging to the same accession clustered together. Thus, the accessions were considered as clearly distinct from each other, which validated the sampling procedure applied in the study of genetic diversity among the accessions (DNA pooled from three plants per accession).
Discussion
All common bean microsatellites used in this study produced amplification products in P. augusti, P. lunatus and P. coccineus, showing that a considerable level of sequence conservation exists within the primer regions flanking the microsatellite, as was observed by Gaitán-Solís et al. (Reference Gaitán-Solís, Duque, Edwards and Tohme2002) in P. lunatus and P. coccineus with genomic microsatellites. This was the first time that microsatellites developed by Yu et al. (Reference Yu, Park, Poysa and Gepts2000) and Blair et al. (Reference Blair, Pedraza, Buendía, Gaitán, Beebe, Gepts and Tohme2003) were used in the species P. augusti. Variability in allele size between the species was observed and some null alleles were found in the accessions of wild P. vulgaris and the other Phaseolus species. Notably, BM175, BM205, BM160 and BM188 failed to amplify in as much as 50% of the accessions of P. augusti. In terms of genetic differentiation based on the FCA, differences between the species of Phaseolus were significant in this study: for example, all the accessions of P. augusti, P. coccineus and P. lunatus, except two misidentified accessions, clustered away from P. vulgaris.
The taxonomic position of accession 133 should be re-analysed, as it showed smaller and more spherical seeds than the other seeds of P. lunatus found in Bolivia and were more similar to Mesoamerican types of common beans. The accession 415 (P. augusti) was collected in Paibimayu (Chuquisaca) and also grouped inside the cultivated dry beans, indicating that it may be close to the source of wild beans used in the domestication of the Andean gene pool. More studies of the sympatric wild bean accessions are necessary to explain whether accession 415 is a wild or weedy P. vulgaris accession and how closely related it is to cultivated common beans.
The one accession of P. lunatus clustered together with the accessions of P. augusti in both the FCA and the UPGMA dendogram, showing that both species are related and belong to the same lineage as was predicted by Caicedo et al. (Reference Caicedo, Gaitán, Duque, Toro, Debouck and Tohme1999). In contrast, P. vulgaris and P. coccineus, although divergent from each other, belong to another lineage of the genus Phaseolus as was found by Fofana et al. (Reference Fofana, Baudoin, Vekemans, Debouck and du Jardín1999).
The results of the FCA within the confirmed P. vulgaris accessions allowed us to distinguish the Andean and Mesoamerican gene pools based on control accessions used by Blair et al. (Reference Blair, Giraldo, Buendía, Tovar, Duque and Beebe2006, Reference Blair, Díaz, Hidalgo, Díaz and Duque2007) and Díaz and Blair (Reference Díaz and Blair2006). Indeed, accessions that grouped with the Andean controls were many large-seeded dry bean landraces, the snap beans obtained from genetic improvement and all the wild accessions of P. vulgaris. The Andean landraces were mostly of growth habits III and IV with medium (26–40 g/100 seeds) and large seed size (>40 g/100 seeds), varying greatly in shape, colour and pattern. They were mostly collected in the valleys at intermediate altitudes (from 1100 to about 2000 m) and from the highlands (above 2000 m altitude). These developmental and morphological patterns as well as the sites of collection are typical of the Andean gene pool. The snap beans were typical of a breeding programme (type I) with a slender seed of different colours. Meanwhile, the wild beans were small seeded at around 10 g/100 seeds in most cases.
Within the group containing the Mesoamerican controls, two groups of accessions may be highlighted on the basis of agronomic and morphological data. First, one group of accessions included landraces with small seeds ( < 25 g/100 seeds) of uniform colours and variable growth habits but with many type II bush beans. Most of the accessions of this group were collected from tropical lowlands and intermediate altitudes of Pando, Beni, La Paz and Santa Cruz, which have climates more appropriate for the Mesoamerican gene pool than for the Andean gene pool. This may be explained by the fact that varieties for commercial production and export have been introduced into the region of Santa Cruz, mostly from Brazil, where Mesoamerican genotypes are predominant.
Meanwhile, a second group of accessions (45, 55, 63, 198, 199, 201, 204, 429 and 450) clustering with the Mesoamerican controls was characterized by medium (26–40 g/100 seeds) to large multi-coloured seeds (>40 g/100 seeds) and mostly viny type III and IV growth habits. These accessions had some Andean characteristics (Singh et al., Reference Singh, Gepts and Debouck1991) and were collected in the higher altitude valleys between 1670 and 2160 m. As a result, we postulate that these accessions represent introgression between the two gene pools as was observed by Blair et al. (Reference Blair, Giraldo, Buendía, Tovar, Duque and Beebe2006, Reference Blair, Díaz, Hidalgo, Díaz and Duque2007) also using simple sequence repeat (SSR) markers. This may be the result of Mesoamerican beans having been grown along with Andean beans in some regions of Bolivia for a long time (Avila et al., Reference Avila, Avila, Brandolini and Rojas1987).
In the analysis of the whole set of P. vulgaris accessions, wild beans overlapped with the Andean group of dry bean landraces clustering with the Andean control Chaucha Chuga (G19833) that belongs to the race Peru. This would seem to confirm the observation of Beebe et al. (Reference Beebe, Rengifo, Gaitán, Duque and Tohme2001) about the close proximity of the Bolivian wild accessions with cultivated Andean beans. Furthermore, our results show that the Bolivian wild accessions are highly related to cultivated accessions of the race Peru (Blair et al., Reference Blair, Díaz, Hidalgo, Díaz and Duque2007, Reference Blair, Díaz, Buendía and Duque2009). Meanwhile, in the correspondence analysis run on wild types and landraces of P. vulgaris, the wild accession 141 was fairly distant from the rest of the cultivated and wild accessions. This genotype was the northernmost wild accession found in Bolivia (Totora, Cochabamba), and Freyre et al. (Reference Freyre, Ríos, Guzmán, Debouck and Gepts1996) reported that it ‘resembles the Peruvian morphotypes of Cuzco and Apurimac and it is different from the rest of Bolivian wild types’. Thus, the wild genotypes that were most likely to have been domesticated for the Andean cultivated gene pool would be from the southern part of Bolivia and not from the northern part of the country.
High N m between the wild beans and dry bean landraces that grouped with the Andean controls was observed in this study (N m = 1.140). Freyre et al. (Reference Freyre, Ríos, Guzmán, Debouck and Gepts1996) concluded from studies in two sites of Bolivia that ‘the original wild bean may have been genetically absorbed into weedy complexes through repeated hybridizations and may have disappeared as a purely wild material’. It is interesting to note that the two accessions to which Freyre et al. (Reference Freyre, Ríos, Guzmán, Debouck and Gepts1996) referred to occupied an intermediate position between the cultivated and wild beans in our dendrogram. The genetic distance matrix showed that the AGD within the wild type accessions was higher than the AGD within P. augusti, within the Mesoamerican gene pool or within the Andean gene pool and was similar to the AGD among the wild versus cultivated Andean beans. These results suggest wide genetic variability in the wild accessions of P. vulgaris in Bolivia and are in contrast with previous studies with wild Andean populations of common bean from north-western Argentina (Galván et al., Reference Galván, Menéndez-Sevillano, De Ron, Santalla and Balatti2006), which were more limited in diversity.
In the dendrogram, we observed that the accessions coming from the same collection site often tended to cluster together. This was confirmed by the Mantel test that showed a significant and positive correlation between the geographical distance and the genetic distance. Nevertheless, this correlation was low and could have been due to the range in distances between the accessions. For this reason, we analysed the relationship between the genetic distance and the geographical distance, and found this to be significant but only at short distances of less than 100 km. This would cover accessions collected within the same political department rather than between distant regions. Similar results have also been observed in Oxalis tuberosa by Pissard et al. (Reference Pissard, Arbizu, Ghislain, Faux, Paulet and Bertin2008).
The geographical influence on genetic relatedness might be influenced by the exchange of seeds by farmers from one valley to another or the sale seed in local markets. In the spatial correlation, we observed that the r-values decreased when the distance among the genotypes increased (200, 300, 500 and 1000 km). At greater distances, movements of bean seeds would be less frequent, mainly due to the lack of routes between valleys and reduced access to markets especially given the topography high mountain passes in Bolivia, which in general has served to isolate the Andean landraces.
Based on the study of within-accession genetic diversity, we found that although most individuals from the same accession were slightly different from each other, the level of within-accession variability was low compared with the level of inter-accession variability and the separation between the accessions was always clearly defined. This suggests that evaluating a bulk of DNA of three individuals per accession allows within-accession genetic variability to be observed supporting the identity of each accession compared with other accessions in the collection analysis. This has implication in the management of the germplasm bank where the accessions are composed of populations of individuals collected in the same site and must be multiplied in a way that preserves their variability.
In conclusion, our results confirmed the genetic variability of Bolivian accessions by applying a polymorphic set of microsatellites for the study of genetic diversity of the 174 cultivated and wild accessions. The genetic diversity, population structure and the correlation of genetic structure with agromorphological characteristics and geographical information were determined in this study, as necessary steps for germplasm bank management.
Acknowledgements
We are grateful to the Food and Agriculture Organization and the Generation Challenge Program (GCP) for funding. The study was realized as part of T. Avila's doctoral dissertation research at Louvain University and under a GCP grant from Sub-program 1 to M.W.B and T.A. We also acknowledge the farmers and curators of germplasm used in this study.


