Introduction
Barley genetic resources play a key role in dry farming and poverty alleviation in dry areas in Tunisia. In semi-arid regions, barley is mostly cultivated by sheep owners and is grazed one or two times per growing season. It is also grown for grain and hay production in zones of intermediate rainfall. Barley is used mainly for feed (85%) and occasionally for food (10–15%) to prepare special recipes for restricted rural communities (El Felah and Medimagh, Reference El Felah, Medimagh, Grando and Gormez2005). In southern zones, barley landraces are subjected to various constraints, essentially their substitution by improved cultivars, and are threatened by disappearance and extinction (El Felah et al., Reference El Felah, Bettaieb ben Kaab, Chelbi, Jaroslav and Janikova2004). In fact, the mostly grown six-rowed improved barley varieties are Martin, Manel and Rihane and the later is grown on more than 40% of the barley cultivated areas. Fortunately, areas covered by local barley still account for 40% of the cultivated surface (Deghaïs et al., Reference Deghaïs, Gharbi, Faleh, Zarkouna and Chakroun1999). The conservation and use of plant genetic resources are essential for the continued maintenance and improvement of agricultural production, sustainable development and poverty alleviation. However, an efficient conservation of this germplasm requires a prior knowledge of the evolutive forces that contribute to its diversity. In particular, local barley is cultivated in a dynamic situation where human and environmental selection, gene flow through seed exchange and genetic drift all interact to shape genetic diversity. In Tunisia, some farmers reproduce their own seeds leading to the selection of adaptive alleles to their area, thus reinforcing allelic fixation and differentiation, while other farmers generate diversity through cultivation of exchanged seeds that may lead to decrease of the genetic differentiation between populations. It is therefore important to assess the impact of farmer's practices in the structuration of barley populations.
A large collection composed of 423 accessions was made in 1982 from different regions in Tunisia. Morphological and biochemical evaluation revealed considerable variation between and within collection sites for many agronomically important characters and disease reactions (El Felah and Mekni, Reference El Felah, Mekni and Logue2000). This collection contained different landraces named by local farmers; Beldi and Souihli (Littoral), Sfira and Ardhaoui (South) and Jerbi (Island of Jerba). Farmers often select plants with preferred agro-morphological characters and choose specific genotypes for planting in a certain microenvironment. However, the attribution of different name to each geographical population may lead to confusion because it may suggest that these populations are highly differentiated. Therefore, it is of great importance to know about the amount of genetic variation Tunisian barley landraces possess and their degree of differentiation. In a previous study, the genetic diversity of 26 Tunisian barley accessions and varieties was assessed using 17 simple sequence repeats (SSR) markers and the genotypes were differentiated according to their type (local landraces vs. varieties), row number and end use (Hamza et al., Reference Hamza, Ben Hamida, Rebai and Harrabi2004). In this study, the genetic diversity of 120 six-row local barley accessions, collected from different ecogeographical Tunisian regions, was assessed using 20 SSR and 8 expressed sequence tag (EST)-SSR markers. The results are discussed on how management practices by farmers have an effect on population differentiation.
Material and methods
Genetic material
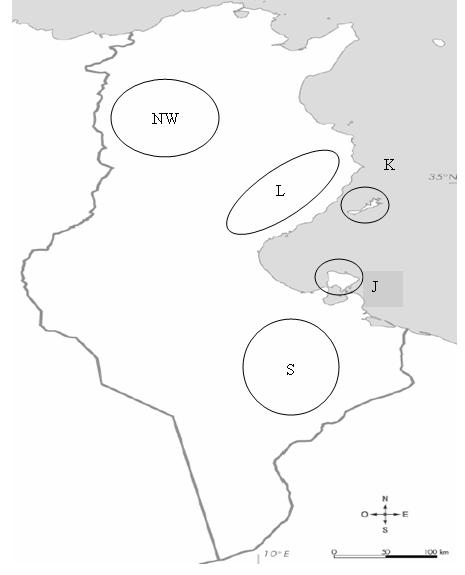
The genetic material stored at International Center of Agriculture Research in Dry Area (ICARDA) consisted of 106 six-row barley genotypes that were obtained by mass selection from local landraces originally collected in 1982 from South, Littoral, Kerkennah and Jerba Islands and 14 accessions collected in 1991 from the North-West region (Supplementary Fig. S1, available online only at http://journals.cambridge.org). South, Littoral and Kerkennah regions were represented by 30 genotypes each; North-West and Jerba were represented by 14 and 16 genotypes, respectively (Supplementary Table S1, available online only at http://journals.cambridge.org).
DNA extraction and SSR analysis
Plant DNA was extracted from fresh leaves according to the method described by Saghai-Maroof et al. (Reference Saghai-Maroof, Soliman, Jorgenson and Allard1984). Twenty barley SSR and eight EST-SSR primer pairs were selected for their random coverage of the whole barley genome with at least three loci per chromosome (Table 1). Primer sequences and chromosomal locations of the amplified loci were mentioned by Saghai-Maroof et al. (Reference Saghai-Maroof, Biyashev, Yang, Zhang and Allard1994), Pillen et al. (Reference Pillen, Binder, Kreuzkam, Ramsay, Waugh, Forster and Léon2000) and Ramsay et al. (Reference Ramsay, Macaulay, Ivanissevich, Maclean, Cardle, Fuller, Edwards, Tuvesson, Morgante, Massari, Maestri, Marmiroli, Sjakste, Ganal, Powell and Waugh2000). The polymerase chain reaction (PCR) amplification was performed with 80 ng DNA in 20 μl reaction volume containing 0.5 μM of each primer pair, 200 μM dNTPs, 4 μl 5 × Taq polymerase buffer (Biogene, Irvine, CA, USA) and 1 Unit Taq polymerase (Biogene). The reaction was run for 35 cycles: denaturation at 94°C for 30 s, annealing at 50, 55 or 60°C (depending on the primer pair) for 1 min and extension at 72°C for 30 s. These cycles were preceded by a denaturing step at 94°C for 5 min and ended by an extension step at 72°C for 10 min. The PCR amplifications were carried out with a GeneAmp PCR system 9700 (Perkin Elmer Applied Biosystem, Foster City, CA, USA). The amplification products were resolved on 6% polyacrylamide gels followed by silver staining according to the protocol described by Hamza et al. (Reference Hamza, Ben Hamida, Rebai and Harrabi2004). The amplified DNA fragments of each SSR locus were assessed based on electrophoretic mobility. Electrophoretic variants at each locus were scored as different alleles.
Table 1 Microsatellite loci diversity (total number of alleles, gene diversity, unique and rare alleles)

a Alleles present only once in the whole set;
b Alleles occurred with a frequency < 5%;
c EST-SSR loci;
d Monomorphic loci are excluded in the computation of the average values.
Data analysis
Genomic diversity was estimated according to the following criteria: (i) number of total alleles, (ii) gene diversity computed according to Nei (Reference Nei1973), (iii) occurrence of unique and rare alleles and (iv) genetic distances between populations. These standard population genetic statistics were calculated using the POPGENE software, v.1.31 (Yeh et al., Reference Yeh, Yang, Boyle, Ye and Mao1997). For each locus, heterogeneity of the allele frequency across populations was calculated by the likelihood ratio (G 2), based on a null hypothesis of no differences in allele frequencies between populations. The genetic differentiation (F ST) among barley accessions collected from different regions was further investigated by an analysis of molecular variance (AMOVA) using ARLEQUIN 3.0 (Excofier et al., Reference Excofier, Laval and Schneider2005). Tolerance was set to 5% of missing per locus. Partitioning of genetic variance among groups was assessed at the 5% level of significance. The correspondence between the two matrices of genetic and geographical distances between populations was tested with the Mantel Z-statistic (Mantel, Reference Mantel1967). The significance of Z was determined by comparing the observed Z-values with a critical Z-value obtained by calculating Z for one matrix with 1000 permuted variants of the second matrix. All computations were performed with the appropriate procedures within NTSYS-pc v.2.1 software (Rohlf, Reference Rohlf2000). The dissimilarities between all pairs of individual accessions were estimated based on the simple matching index. Robustness was estimated by using 1000 bootstrap resampling procedure. Dissimilarity matrices were computed and neighbour-joining (NJ) analyses were performed on them using Darwin software (Perrier et al., Reference Perrier, Flori, Bonnot, Hamon, Seguin, Perrier and Glaszmann2003).
Results
Analysis of genetic diversity and allelic frequency
One-hundred-twenty individuals were genotyped with 28 SSR loci and a total of 98 alleles were detected, ranging from 2 to 10 with a mean of 3.76 alleles per locus (Table 1). The gene diversity varied from 0.09 (for marker HVCMA, 7H) to 0.84 (HVM74, 6H), with the average value of 0.50. Twenty-six SSR markers (92.8%) generated polymorphic patterns and two (HVM44 and HVM63) showed a monomorphic pattern. Null alleles were observed for ten loci. The EST-SSR loci generated an average of 2.62 alleles, while for the genomic ones an average of 3.85 was obtained, and as a result the mean gene diversity values were higher for the latter (0.53) than for the former (0.25).
Three unique and 12 rare alleles were detected corresponding to 15.3% of the available diversity. The total number of alleles varied according to the regions, ranging from 77 (Jerba) to 86 (Littoral), and 59 alleles (60.2%) were shared by all regions. The gene diversity varied slightly between the populations, ranging from 0.38 for the North-West to 0.46 for Kerkennah population (Table 2).
Table 2 Total number of genotypes, allele's number and gene diversity according to the geographical region

The difference observed in frequency distributions of alleles among polymorphic loci in these regions was significant, according to G 2-test for all loci, expected for the markers HVM9, HVSIP1A, HVM64, HVLEU and HVM65. In general, the frequency distribution of alleles can be felled into three patterns. The first, in which the most frequent allele, was the same in all regions with a frequency beyond 0.35, as obtained with locus HVM5, HVCMA, HVBKASI, HVCSG, HVM40, HVM67, HVM11, HVPRP1B and HVM31. The second pattern comprising the locus where some alleles are specific for North-West region, but appeared at low frequency (0.03–0.07) such as, HVDHN7, HVM54 and HVM51 (Fig. 1A). In the last pattern observed, the most frequent allele at each locus differed from one population to another, as in locus HVM49, HVM15, HVM13, HVM68, HVDHN9, HVM43, HVM74 and HVM20. This unequal allelic distribution was well pronounced for HVM49-A allele, where allelic frequency was 0.517 in North-West population compared to the rest of the regions where allelic frequencies were < 0.25 (Fig. 1B).

Fig. 1 Allelic frequency distribution of loci. (A) HVM51, HVDHN7 and HVM54 and (B) HVM49 and HVM40.
Genetic differentiation within and between populations
AMOVA results showed that the highest percentage of SSR variability was attributed to variability within populations (95.27%), and the remaining 4.73% between populations (Table 3). The pairwise F ST values comparisons indicated that the North-West population was significantly differentiated (P < 0.05) from the rest of the populations and the highest genetic differentiation was obtained with the population from the South (F ST = 11.3%). A lower differentiation rate (F ST = 5.11%) but significant at P < 0.05 was obtained between Jerba and the South. Pairwise comparisons of F ST values between the other regions revealed no significant differences at P < 0.05 (Table 4). The genetic and geographical distance matrices, as measured by normalized Mantel statistics, were not significantly correlated with one another (r = 0.55, P = 0.0789).
Table 3 Analysis of molecular variance (AMOVA)

Table 4 Pairwise F ST values between populations
* Significant values of F ST (P < 0.05).
Distinctness among individual genotypes
No obvious clustering according to geographical origin was observed. The NJ tree (Fig. 2) revealed that only few accessions were phylogenetically related by their geographical origin. Among a total of 14 accessions from the North-West region, 7 clustered together.

Fig. 2 NJ tree based on 26 SSRs among 120 barley accessions, using the simple matching index. Accessions are identified by their origin (K, Kerkennah; L, Littoral; S, South; J, Jerba; NW, North-West).
Discussion
The assessment of 120 Tunisian barley accessions using 28 microsatellites markers revealed an average value of 0.50 of genetic diversity. Baek et al. (Reference Baek, Beharav and Nevo2003) using 18 microsatellites (of which 11 SSR in common with our study), found similar levels of polymorphism (0.51) in populations of Hordeum spontaneum sampled from Jordan. Our value is lower than that obtained with 125 barley landraces sampled from Syria and Jordan (0.65) using only 21 SSR markers (Russell et al., Reference Russell, Booth, Fuller, Baum, Ceccarelli, Grando and Powell2003). Nevertheless, the high genetic diversity found in Jordan and Syria was conducted at larger scale than Tunisian scale. In fact the genetic diversity was reduced at a lower level (0.56) when Syria and Jordan regions were decomposed into different ecogeographical regions.
AMOVA analysis showed that most of the genetic diversity was found within populations (95.27%), and no significant differentiation was found between populations except for the population of the North-West resulting in an overall F ST value of 4.73%. Studies on barley landraces showed that the highest proportion of the genetic diversity is within, rather than between barley populations (Papa et al., Reference Papa, Attene, Barcaccia, Ohgata and Konishi1998; Chen et al., Reference Chen, Shaoying, Defu, Pin, Xiangdong and Lijun2006; Feng et al., Reference Feng, Zhang, Zhang and Ling2006; Jaradat and Shahid, Reference Jaradat and Shahid2006). However, significant genetic differentiation between populations was observed in barley populations of the Fertile Crescent, Oman and Nepal (Russell et al., Reference Russell, Booth, Fuller, Baum, Ceccarelli, Grando and Powell2003; Jaradat and Shahid, Reference Jaradat and Shahid2006; Pandey et al., Reference Pandey, Wagner, Friedt and Ordon2006). The differentiation was more pronounced, when distant populations from different ecogeographical regions with limited gene flow were considered (Russell et al., Reference Russell, Booth, Fuller, Baum, Ceccarelli, Grando and Powell2003; Pandey et al., Reference Pandey, Wagner, Friedt and Ordon2006). Recently, partitioning barley landraces among West Asian and North African countries revealed little differentiation between North African landraces ( < 8%), which were found to form an homogeneous group distinct from landraces of the Fertile Crescent countries (Orabi et al., Reference Orabi, Backes, Jahoor and Grandoin press). Therefore, another possible explanation to this limited differentiation would be a common genetic base among the Tunisian barley landraces.
Except for North-West population, no or weak differentiation was observed between the other Tunisian populations despite the relatively wide geographical distance (315 km) among Littoral and South populations. These conclusions are also verified by the test of isolation by distance hypothesis resulting in a non-significant correlation between genetic and geographical distances.
Moreover, insular population of Kerkennah and Jerba showed weak differentiation from the continental populations. The low differentiation obtained in this study may be explained on the basis of seed exchange between farmers (Parzies et al., Reference Parzies, Spoor and Ennos2004). In fact, Tunisian farmers commonly acquire seed from either local or distant farmers or sources, often mixing their seed with seed from other farmers or that purchased from markets. In addition, because some local farmers practice little selection using bulk reproduction of their seeds, effective population sizes stay large, thereby decreasing the opportunity for fixation of any alleles. Similarly, Pressoir and Berthaud (Reference Pressoir and Berthaud2004) showed that seed exchange between villages leads to the absence of isolation by distance in maize populations. The importance of potential gene flow through seed exchange can reduce the effect of drift and selection, which both tend to decrease diversity and to structure landraces (Barnaud et al., Reference Barnaud, Deu, Garine, McKey and Joly2007).
The differentiation observed for the North-West population was due to (i) the presence of three specific alleles, found only in this region, while no specific alleles were found in Littoral, Kerkennah and Jerba, (ii) the unequal distribution of allele HVM49-A and (iii) the uniformity of North-West population shown by low genetic diversity level caused by the predominance of one or two alleles at most loci (Fig. 1B). An explanation for this level of differentiation may be attributed to the temporal separation (i.e. time lag) because landraces from the North-West region were collected 9 years later than the other accessions. The lower genetic diversity could be the result of genetic erosion due to the replacement of local barley with modern cultivars. In fact, farmers in this region have widely introduced modern cultivars due to their larger yield as compared with local barley.
The landraces named by the farmers as Beldi, Souihli, Sfira and Ardhaoui represented in our study were not differentiated. Farmers have defined these landraces according to a particular combination of morphological traits controlled by a few major genes responsible for their morphological distinctiveness. However, the given landraces may show little differentiation based on other loci. For example, the landrace ‘Sfira’ is distinguished from the other landraces by its yellow grain, and this could be obtained by mutation of genes controlling pigmentation of the seed (Smith, Reference Smith1951). A clear and significant drift of the D-hordeins patterns in Jerba accessions was described (El Felah et al., Reference El Felah, Bettaieb ben Kaab, Chelbi, Jaroslav and Janikova2004). In our study, clustering of Jerba accessions was not observed in the NJ tree, probably because hordein loci were restricted on the short arm of chromosome 5 (Sogaard and von Wettestein-Knowles, Reference Sogaard, von Wettestein-Knowles and Rasmussen1987), while SSR loci used in our study were distributed over the whole genome.
In wild barley, associations of SSRs with site of origin, ecological and geographical data were found in other studies, and the patterns of SSR loci were non-random but structured by ecological stresses (Ivandic et al., Reference Ivandic, Hackett, Nevo, Keith, Thomas and Forster2002; Huang et al., Reference Huang, Beharav, Li, Kirzhner and Nevo2002). Contrary to our expectation, unequal distribution of SSR alleles between barley landraces collected from different ecogeographical regions in Tunisia was not observed. Even at a microgeographical scale of Gabes oasis (El Menzel), known for its unique microenvironment, the accessions collected from this area were not distinct and dispersed throughout the phylogenetic tree (Fig. 2). Using STRUCTURE software (Pritchard et al., Reference Pritchard, Stephens and Donnelly2000), Tunisian barley landraces were not structured according to ecogeographical regions (data not shown), indicating that the adaptation of Tunisian barley population to particular environment is probably hindered by the phenomena of gene flow through seed exchange. Sampling in key regions around the Mediterranean basin and the rest of Europe with limited seed exchange, revealed an underlying population substructure that corresponded closely to the geographical regions (Comadran et al., Reference Comadran, Russell, van Eeuwijk, Ceccarelli, Grando, Baum, Stanca, Pecchioni, Mastrangelo, Akar, Al-Yassin, Benbelkacem, Choumane, Ouabbou, Dahan, Bort, Araus, Pswarayi, Romagosa, Hackett and Thomas2008). At a lower scale, the distribution of six-row barley Spanish landraces resembled the distribution of bioclimatic areas (Yahyaoui et al., Reference Yahyaoui, Ernesto, Moralejo, Ramsay, Molina-Cano, Ciudad, Lasa, Gracia and Casas2008). These contrasting observations to our results suggest the importance of the sampling strategy that should target barley landraces from farmers, who reuse their own seeds for several generations without seed exchange to be able to highlight a geographical structuring as evolutionary modifications due to selection and adaptation to different climatic conditions of the north and south of Tunisia. In situ conservation would favour the process of selection of alleles at multiloci genotypes and the assembly of favourably interacting alleles resulting from the adaptation of the landraces to their specific environment. If the adaptive properties of barley to marginal areas lead to allelic selection of drought-responsive genes, it will be interesting to assess functional diversity using these candidate genes in relationship with physiologic parameters for tolerance. This would allow the identification of favourable alleles for drought tolerance and develop new markers for exploitation and conservation of genetic resources.
Acknowledgements
This study was undertaken under the project untitled ‘cereals genetics and breeding’ that was funded by the Secretary of State for Sciences Research and Technology (SERST, Tunisia). We thank Dr M. El Felah from Institut National de la Recherche Agronomique de Tunisie (INRAT) and S. Grando from ICARDA (Syria) for providing material and information on location of barley accessions. We thank Dr A. Rhaiem for her precious help with editing the manuscript.