


Introduction
East Africa, specifically Uganda, is the primary centre of finger millet diversity and therefore the region is presumed to have a wider and richer genetic base for the crop than other regions (Harlan Reference Harlan1971; de Wet, Reference de Wet, Smartt and Simmonds1995). This diversity is important for finger millet productivity improvement through selection for direct commercial use and for breeding to mitigate biotic and abiotic stresses that affect the crop. Effective breeding for target traits requires careful selection of parents with a wide genetic base to enhance genetic gain (Lapitan et al., Reference Lapitan, Brar, Abe and Redona2007). The complementarity of phenotypic and molecular approaches in crop diversity studies helps us to understand not only the variability in the germplasm but also the value of the variability observed. Hilu and de Wet (Reference Hilu and de Wet1976) reported variability in vegetative, floral and seed morphology in finger millet based on ecogeographical origin and were able to distinguish three ecogeographical races, namely African highland race, African lowland race and Indian race. Using morphological data, Upadhyaya et al. (Reference Upadhyaya, Sarma, Ravishankar, Albrecht, Narasimhudu, Singh, Varshney, Reddy, Dwivedi, Wanyera, Oduori, Mgonja, Kisandu, Parzies and Gowda2010) were able to develop a core collection (10% of the total collection) and a minicore (10% of the core collection) to represent the total global diversity held at the International Crops Research Institute for Semi-Arid Tropics (ICRISAT) genebank.
Previous studies of finger millet diversity using molecular approaches are limited due to the limited understanding of the genome of finger millet compared with that of other cereals such as maize (Zea mays), wheat (Triticum aestivum), barley (Hordeum vulgare), rice (Oryza sativa) and sorghum (Sorghum bicolor). Both hybridization-based and polymerase chain reaction (PCR)-based markers have been used in finger millet diversity studies, though not extensively. Panwar et al. (Reference Panwar, Saini, Sharma, Yadav and Kumar2010) compared random amplified polymorphic DNAs (RAPDs) and single-sequence repeats (SSRs) and found the highest polymorphic information content (PIC) value with SRRs (0.89) than with RAPDs (0.280). Dida et al. (Reference Dida, Wanyera, Melanie, Dunn, Bennetzen and Devos2008) used 45 SSR markers to characterize 79 finger millet accessions from Africa and Asia and distinguished three subpopulations, where those from Africa and Asia (Eleusine coracana) were clearly differentiated from a wild subpopulation (Eleusine africana). Upadhyaya et al. (Reference Upadhyaya, Gowda and Sastry2008) used 20 SSR markers to characterize over 959 finger millet accessions at ICRISAT-India, revealing 231 alleles and identifying unique alleles distinguishing accessions from East Africa, Southern Africa and South Asia. Molecular characterization requires the use of precise markers to avoid spurious clustering of genotypes (Kumari and Pande, Reference Kumari and Pande2010). Being single-locus co-dominant markers with a high degree of length polymorphism, SSRs are the most suitable markers for genotyping a highly self-pollinating crop with a narrow genetic base such as finger millet (Dida et al., Reference Dida, Srinivasacary, Ramakrishnan, Bennetzen, Gale and Devos2007). To date, a large number of finger millet collections have been conserved in the genebanks of Kenya, Tanzania and Uganda, and only a small fraction of these collections have been characterized and/or used in breeding programmes. This study was conducted to assess the genetic differentiation among 340 East African finger millet accessions from Kenya, Tanzania and Uganda using five qualitative traits and 23 previously documented SSR markers to inform appropriate conservation and utilization strategies for the germplasm.
Materials and methods
Germplasm
A total of 340 samples, which included 301 accessions from Kenya, Uganda and Tanzania, 15 accessions from the global minicore set and 24 checks (elite and blast-resistant/susceptible lines from the ICRISAT-Nairobi breeding programme), were used in this study. The minicore is 1% (80 accessions) of the global finger millet collection at the ICRISAT genebank, India, constituted by Upadhyaya et al. (Reference Upadhyaya, Sarma, Ravishankar, Albrecht, Narasimhudu, Singh, Varshney, Reddy, Dwivedi, Wanyera, Oduori, Mgonja, Kisandu, Parzies and Gowda2010). The 301 accessions represented nine subregions, viz. eastern Uganda – mid-altitude, subhumid with 240–269 length of growing period (LGP in days); western Uganda – mid-altitude with 270–299 LGP; northern Uganda – mid-altitude with 210–230 LGP; western Kenya – mid-altitude, subhumid with 240–269 LGP; Rift Valley, Kenya – high altitude, low temperature with 120–209 LGP; eastern Kenya – mid-to-low altitude, semi-arid; western Tanzania – mid-altitude with 210–239 LGP; northern Tanzania – mid-altitude, subhumid with 90–149 LGP; and Rukwa subregion, southern Tanzania, high altitude with 120–209 LGP. These subregions also have differential ethnic representation with occasional overlaps. The germplasm was collected from farmers' fields in June/July 2010 in Tanzania and in July 2010 in Uganda, whereas in Kenya it was provided by the National Genebank and was collected between 1988 and 1997. The 15 minicore accessions were selected based on the diversity groups established by Upadhyaya et al. (Reference Upadhyaya, Sarma, Ravishankar, Albrecht, Narasimhudu, Singh, Varshney, Reddy, Dwivedi, Wanyera, Oduori, Mgonja, Kisandu, Parzies and Gowda2010) and were included to ascertain whether the minicore set adequately captured the total global diversity.
Plant cultivation
Finger millet seeds were planted in 8 × 12-well plastic trays in soil that was sterilized at 140°C for 30 min and placed in an incubator at 30°C for 24 h to germinate. The seedlings were then transferred to a greenhouse at the University of Nairobi field station for 2 weeks and were watered regularly.
DNA extraction
Leaf samples of a similar size were taken from 10–14-day-old plants from five seedlings in each accession and bulked per accession. The leaf tissue was placed in 12 × 8-well strip tubes with strip caps (Marsh Biomarket, Foster city, California, USA) together with two 4 mm stainless-steel grinding balls (Spex CertiPrep, Metuchen, New Jersey, USA). To each sample, 450 μL of preheated (65°C) extraction buffer (100 mM Tris–HCL (pH 8), 1.4 M NaCl, 20 mM EDTA: CTAB (3% w/v), and β-mercaptoethanol (0.15% v/v)) were added and secured with eight-strip caps (Marsh Biomarket, USA). The samples were finely ground in a Spex CertiPrep Inc. Geno/grinder 2000® at 500 strokes/min for 10 min and incubated for 30 min at 65°C in a water bath with occasional mixing. DNA extraction was then carried out following the protocol of Mace et al. (Reference Mace, Buhariwalla, Buhariwalla and Crouch2003) by excluding the phenol–chloroform step, as this does not compromise the quality of the DNA (S. de Villiers, unpublished results).
PCR
The PCR procedure was carried out according to the method described by Roux (Reference Roux2009). A 10 μL reaction mix containing ddH2O, Taq buffer (20 mM Tris–HCl (pH 7.6), 100 mM KCl, 0.1 mM EDTA, 1 mM DTT, 0.5% (v/v) Triton X-100 and 50% (v/v) glycerol), 2 mM MgCl2, 0.16 mM dNTPs, 0.16 μM of a labelled M13-sequence, 0.04 μM forward primer, 0.2 μM reverse primer and 0.2 units of Taq DNA polymerase (SibEnzyme Ltd, Novosibirsk, Russia) was prepared. In an optical 384-well reaction plate (Applied Biosystems, Carlsbad, California, USA), 7 μL of the reaction mix were added to 30 ng of the template DNA and amplified in a PCR machine (Thermocycler-GeneAmp PCR system 9700®; Applied Biosystems, USA). Amplification consisted of initial denaturation of the template DNA at 94°C for 5 min, followed by 35 cycles of 94°C for 30 s, and annealing at 59°C for 1 min, with the first extension at 72°C for 2 min and the final extension at 72°C for 20 min. To verify amplification, PCR products were electrophoresed on a 2% agarose gel. The amplified DNA was visualized under UV light after staining with GelRed® (Biotium, Hayward, California, USA). The DNA samples obtained as described above for each accession were subsequently subjected to SSR genotyping using the best 23 markers selected from a reference microsatellite kit of 82 markers that were evaluated across ten finger millet varieties at the ICRISAT-Nairobi molecular laboratory (S. de Villiers, unpublished results) to determine their amplification efficiency, polymorphism and ability to discern genetic diversity in finger millet. All the forward primers contained an M13-tag (5′-CACGACGTTGTAAAACGAC-3′) on the 5′-end that was fluorescently labelled to allow the detection of amplification products (Sheulke, Reference Sheulke2000). Depending on the efficiency of amplification, 1.5–3.5 μL of three different amplification products were co-loaded together with a size standard that ranged from 50 to 500 bp (GeneScan™-500 LIZ®; Applied Biosystems) and Hi-Di™-Formamide (Applied Biosystems) and the amplified fragments were separated by capillary electrophoresis using an ABI Prism® 3730 Genetic analyser (Applied Biosystems) (Kuomi et al., Reference Kuomi, Green, Hartley, Jordan, Lahec, Livett, Tsang and Ward2004). GeneMapper 4.0 (Applied Biosystems) was used to score allele sizes in base pairs.
Phenotypic characterization
A total of 420 finger millet accessions (301 from Kenya, Uganda and Tanzania, all genotyped as described above, and an additional 39 accessions from the three countries, 80 global minicore accessions and five checks) were phenotyped at Kiboko (a dry lowland location 960 m above sea level, 2°20′S 37° 45′E) in eastern Kenya. The five checks were ‘Kahulunge’ – farmer preferred in Tanzania, ‘Nakuru FM1’ – released in Kenya for cool high altitudes, ‘Seremi 2’ – released in Kenya and Uganda for mid-altitudes, ‘KNE 479’ – blast-susceptible check, and ‘KNE 814’ – blast-resistant check. The materials were planted in an augmented design in single row plots of 4 m length with an inter-row spacing of 0.40 m. The trial was arranged in 20 blocks of 26 plots each, with all check varieties being replicated once in each block. Seeds were drilled in 2.5–3 cm-deep furrows and plants were thinned to one plant per hill at intervals of 0.10 m 2 weeks after emergence. Standard fertilizer rates were applied. Qualitative data (plant colour, growth habit, ear shape, ear size and grain colour) were collected according to morphological descriptors for finger millet (IBPGR, 1985).
Data analysis
Marker statistics and clustering
PIC, which measures the discriminatory power of each SSR locus (Anderson et al., Reference Anderson, Churchill, Autrique, Tanksley and Sorrells1993), number of alleles per locus, frequency of the major allele, observed heterozygosity and expected heterozygosity for the 19 polymorphic markers were calculated using PowerMarker 3.2.5 (Liu and Muse, Reference Liu and Muse2005). Principal coordinates analyses (PCoA) were carried out using pairwise genetic dissimilarity coefficients of the accessions using simple matching of the Unweighted Pair Group Method with Arithmetic Mean (UPGMA) with the DARwin v.5.0.158 software (Perrier and Jacquemoud-Collet, Reference Perrier and Jacquemoud-Collet2006). Neighbouring trees were generated based on the matrix of genetic distances with a bootstrapping value of 10 000 (Saitou and Nei, Reference Saitou and Nei1987).
Genetic diversity
Standard parameters of genetic diversity, viz. total number of alleles (A t), number of rare alleles (A r, with allele frequency < 5%), number of private alleles (A p, alleles unique to a group), observed heterozygosity (H o), and expected heterozygosity (or gene diversity, H e), were computed using Arlequin 3.1.1 (Excoffier et al., Reference Excoffier, Laval and Schneider2005). These parameters were compared pairwise for the germplasm at country and subregional levels and tested for their significance using 10,000 permutations (Belkhir et al., Reference Belkhir, Borsa, Chikhi, Raufaste and Bonhomme2002).
Analysis of molecular variance (AMOVA)
AMOVA was used to estimate population differentiation directly from molecular data (Excoffier et al., Reference Excoffier, Laval and Schneider2005) using genetic distances as deviations from a group mean position and squared deviations as variances. Wright's fixation index (F ST) was calculated according to Wright (Reference Wright1965) as follows:
 $$\begin{eqnarray} F _{ST} = \left ( H _{T} - H _{S}\right )/ H _{T}, \end{eqnarray}$$
where H T is the sum of population heterozygosities and H S is the sum of subpopulation heterozygosities. The significance of F ST was tested using Fisher's exact test (Guo and Thompson, Reference Guo and Thompson1992) in Arlequin 3.1.1 (Excoffier et al., Reference Excoffier, Laval and Schneider2005). To test the null hypothesis of no-population structure within and between the groups, the F ST values were compared on a pairwise basis to determine the level of genetic differentiation at country and subregional levels (Fitzpatrick, Reference Fitzpatrick2009). Based on the F ST values, differentiation between the subpopulations was classified as little (0.0–0.05), moderate (0.05–0.15), great (0.15–0.25) and very great (>0.25) (Wright, Reference Wright1965).
Phenotypic diversity
Shannon–Weaver diversity indices (H′) as described by Jain et al. (Reference Jain, Qualset, Bhatt and Wu1975) were calculated based on phenotypic frequencies (proportions) of each trait category to estimate phenotypic diversity between the accessions, across the countries and within each country:
 $$\begin{eqnarray} H = \sum P _{ i }log_{e} P _{ i }, \end{eqnarray}$$
where H is the Shannon diversity index and P i is the proportion of accessions in the ith class of an n class trait in a population. The H value was standardized by dividing it by its natural log loge n (n= number of phenotypic classes in the trait) to obtain H′. Frequencies of the occurrence of each trait category in the germplasm expressed as a percentage of the total number of accessions in the entire germplasm collection and in each country and in the entire germplasm were also calculated. To understand the association of the phenotypic traits with the SSR-based tree derived in DARwin, the phenotypic values (for similar entries) scored for each trait category were overlaid on the SSR-generated tree and the relative importance was assessed by comparing the SSR tree grouping with the distribution of these traits in each group (Sharma et al., Reference Sharma, Deshpande, Senthilvel, Rao, Rajaram, Hash and Thakur2010).
Results
Marker summary statistics and clustering
Four markers (UGEP5, UGEP68, UGEP98 and UGEP96) failed to amplify in the PCR across most samples and were eliminated. One marker (UGEP110) appeared to amplify duplicate loci and was scored as two separate markers, leading to 19 markers amplifying 20 loci. The 19 markers amplified PCR products across 337 accessions (Table S1, available online), with amplification failing or being poor in three samples. Allele sizes ranged from 148 bp (allele from UGEP20) to 474 bp (allele from UGEP57) (Table 1). The UGEP33 marker was monomorphic. The number of alleles per marker ranged from 3 (UGEP110 and UGEP106) to 23 (UGEP24), with an average of 10.3 alleles per marker (Table 1). The average gene diversity for the 337 accessions was 0.604, with a range of 0.035 (UGEP110) to 0.898 (UGEP67), and the PIC values for the 19 polymorphic markers ranged from 0.035 (UGEP110) to 0.889 (UGEP67), with a mean of 0.606.
Table 1 Summary statistics for the 19 polymorphic single-sequence repeat (SSR) loci screened across 337 genotypes

PIC, polymorphic information content.
A neighbour-joining (NJ) tree was constructed based on the UPGMA to visualize genetic dissimilarities detected across the 20 SSR loci, and it differentiated the accessions into three major genetic groups or clusters and eight subclusters (Fig. 1). Cluster 1 had 44 accessions from Kenya, 52 from Tanzania, seven from Uganda, seven from the minicore (four originally from Uganda, one from Kenya and two from Zambia) and 15 checks (elite and blast-resistant parents). Cluster 2 had 75 accessions from Kenya, 13 from Tanzania, 90 from Uganda, eight from the minicore (one originally from Kenya, three from Zimbabwe, one from Nigeria, two from India and one from Nepal) and six checks. Cluster 3 (made up mainly of accessions from high altitudes) had eight accessions from Kenya (seven from the high-altitude Rift Valley subregion), ten from Tanzania (seven from the southern high-altitude subregion), one from Uganda, zero from the minicore and three blast-resistant checks. Subcluster 1A had 17 accessions from Kenya, two from Uganda, 33 from Tanzania, two from the minicore (one originally from Uganda and one from Kenya) and two checks (blast resistant). Subcluster 1B had 12 accessions from Kenya, zero from Uganda, seven from Tanzania, two from the minicore (both originally from Zambia) and four checks (three blast resistant). Subcluster 1C had 14 accessions from Kenya, five from Uganda, 12 from Tanzania, three from the minicore (all originally from Uganda) and nine checks (seven blast susceptible). Subcluster 2A had nine accessions from Kenya, 34 from Uganda, two from Tanzania, zero from the minicore and two checks (all blast susceptible). Subcluster 2B had 21 accessions from Kenya, 28 from Uganda, one from Tanzania, one from the minicore (originally from Kenya) and one blast-susceptible check. Subcluster 2C had 14 accessions from Kenya, ten from Uganda, eight from southern Tanzania, three from the minicore (one originally from Nigeria and two originally from Zimbabwe) and one blast-resistant check. Subcluster 2D had 32 accessions from Kenya, 16 from Uganda, two from Tanzania, three from the minicore (two originally from India and one originally from Nepal) and two checks. There was a close association between the Kenyan and Tanzanian accessions (clusters 1 and 3) and between the Kenyan and Ugandan accessions (cluster 2) (Fig. 1).

Fig. 1 Neighbour-joining tree based on the UPGMA genetic dissimilarities for the 337 accessions (details of accessions in each cluster are seen in supplementary Table S1).
Genetic relationships between countries and subregions
A biplot of the first two axes accounted for 11.13% of the total variation (data not shown). However, there was no clear separation of accessions on the two axes based on the country and subregion of collection. A total of 195 alleles were detected in the 337 accessions, of which 123 (57.7%) were rare (alleles with frequency < 5%) and 37 (17.4%) were private (alleles that appear in individuals from only one subpopulation) (Table 2). Most of the private alleles (21 or 56.8%) were present in the Kenyan accessions. The highest genetic diversity (0.639 ± 0.283) was recorded in the Kenyan accessions followed by the Tanzanian accessions (0.636 ± 0.262) and the least was recorded in the Ugandan accessions (0.583 ± 0.264). The minicore accessions had a mean genetic diversity of 0.638 ± 0.224. At the subregional level, the highest genetic diversity (0.596 ± 0.280) was detected in accessions from eastern Uganda and the lowest in accessions from western Tanzania (0.049 ± 0.335) (Table 2).
Table 2 Genetic diversity estimates for the finger millet accessions at the country and subregional levels
A t, total alleles; A r, rare alleles; A p, private alleles; H e, Expected heterozygosity or gene diversity; H o, Observed heterozygosity.
Genetic differentiation
There was moderate but highly significant (P< 0.001) genetic differentiation between and within the countries and subregions. At the country level, variability within the countries accounted for 76.0% of the genetic differences, whereas that between the countries and within the accessions in each country accounted for 5.4 and 18.5%, respectively (Table S2, available online). Pairwise comparison of variability between the three countries revealed the highest variability between the Ugandan and Tanzanian accessions (F ST= 0.119; P <0.001) and the least between the Kenyan and Ugandan accessions (F ST= 0.031) (Table 3). The Ugandan accessions from the minicore had the highest variability (F ST= 0.092; P <0.001) and the Tanzanian accessions the least (F ST= 0.041; P <0.001). Variability between the subregions accounted for 4.9% of the genetic diversity, that among the accessions in the subregions for 73.7%, and that within the accessions in each subregion for 21.4% (Table S2, available online). The highest diversity was observed between accessions from northern Tanzania and those from northern Uganda (F ST= 0.139; P <0.001) and the least between accessions from northern Uganda and those from western Tanzania (F ST= 0.013; P <0.001) (Table 3).
Table 3 Pairwise F ST estimates between the countries and subregions of origin of finger millet accessions obtained from three East African countries
EK, Eastern Kenya; WK, Western Kenya; RV, Rift Valley; EU, Eastern Uganda; NU, Northern Uganda; WU, Western Uganda; NT, Northern Tanzania; WT, Western Tanzania; ST, Southern Tanzania; Mc, Minicore.
Phenotypic diversity
A wide range of variability was observed in qualitative traits among the accessions (Table 4). The tan plant types (68.6%) were the most predominant across the three countries, with a higher proportion being observed in the Tanzanian accessions (85.5%). Overall, the accessions had 93.2% erect plants and 6.8% decumbent plants, with all the Kenyan accessions being erect. Most of the decumbent plant types were found within the Tanzanian accessions (19.5%). The predominant panicle shape in all the accessions was the compact type (48.3%), largely observed in the Ugandan accessions, followed by the semi-compact (37.8%), fisted (8.1%), open (3.4%) and droopy (2.4%) types. A range of grain colours were observed, with brown being dominant in all the accessions (73.3%) and within the countries of origin. The least prevalent grain colour was white in all the accessions (0.6%), with none being observed in the Ugandan accessions. The minicore accessions had a proportionately lower number of exposed grain types (32.5%) and a higher number of dark-seeded types (22.2%) relative to the total across the germplasm of the three countries. Shannon–Weaver diversity indices indicated an overall moderate allelic richness in the qualitative traits (H′ = 0.66). Relatively though, the highest diversity was observed in panicle shape (H′=0.85) and the least in growth habit (0.27) (Table 4). The highest diversity was recorded in the Tanzanian accessions (H′ = 0.76), followed by the minicore accessions (H′ = 0.74), and the least in the Ugandan accessions (H′ = 0.55). Growth habit, ear shape, grain colour and plant colour scores were associated with the SSR-based genetic diversity results in the NJ tree constructed using DARwin 5.0. When used to assess their importance/value in delineating the diversity detected in the 340 accessions based on molecular data, these morphological traits played no role.
Table 4 Relative percentages of representation per country and Shannon–Weaver diversity indices (H′) of qualitative traits
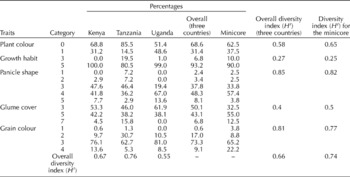
Plant colour: 0 – tan, 2 – pigmented; growth habit: 3 – decumbent, 5 – erect; panicle shape: 1 –droopy, 2 – open, 3 – semi-compact, 4 – compact, 5 – fisted; glume covering: 3 – exposed, 5 –intermediate, 7 – enclosed; and grain colour: 1 – white, 2 – light brown, 3 – brown, 4 – dark brown.
Discussion
The PIC and gene diversity values obtained using the 19 primer pairs revealed high diversity in the germplasm. An average of 60.6% polymorphism revealed by the 19 SSR markers was comparable to 70.2% reported by Panwar et al. (Reference Panwar, Saini, Sharma, Yadav and Kumar2010), whereas the mean genetic diversity value, 0.636, and the mean number of alleles per locus, 10.3, across the 340 accessions were higher than 0.330 and 3.4, respectively, reported by Dida et al. (Reference Dida, Wanyera, Melanie, Dunn, Bennetzen and Devos2008) across 79 accessions from Africa. The differences in diversity and alleles could be attributed to population type and size used and marker polymorphism, respectively. The lowest number of alleles per locus (1.0) was reported by Naga et al. (Reference Naga, Mangamoori and Subramanyam2011) using 20 SSR primers. With a heterozygosity range of 0.0–0.5 in the germplasm in this study, it is likely that some markers might have detected/amplified more than a single locus or amplified segments on two different genomes, considering that finger millet is an allotetraploid with two genomes (AA and BB) (Dida et al., Reference Dida, Wanyera, Melanie, Dunn, Bennetzen and Devos2008). The high percentage of rare alleles in the germplasm (57.5%) coupled with a high number of private alleles in the Kenyan germplasm (56.8%) confirms the existing potential in the germplasm for selection of genetically diverse parental lines for breeding.
Genetic differentiation
Genetic distances based on the UPGMA clustering and PCoA revealed no distinct differentiation among the countries and subregions of collection. The three major clusters observed were made up of a mix of accessions from all the countries and subregions. This undefined clustering was supported by the AMOVA, where a higher level of variability was detected among the accessions within countries and subregions than among the countries and subregions. This could be attributed to agroecological and LGP differences within the countries and subregions. Non-differentiation of the subregions could also be attributed to the lack of a link between political boundaries and ecological separation. In addition, there is a similarity between ethnic communities occupying both sides of neighbouring countries, such as the Luhya and Teso ethnic groups that occupy western Kenya and eastern Uganda. These communities retain their cultures and food habits irrespective of the political borders and regularly share seed and grain markets. A lack of separation of accessions relative to the subregion of collection was also reported by Naga et al. (Reference Naga, Mangamoori and Subramanyam2011) using 20 SSR primers to characterize 15 finger millet accessions from Africa and Asia and Bezawelataw (Reference Bezawelataw2011) using 15 RAPD primers to characterize 66 Ethiopian finger millet landraces. Earlier genetic diversity studies carried out by Dida et al. (Reference Dida, Wanyera, Melanie, Dunn, Bennetzen and Devos2008) using isozyme and DNA markers also revealed a limited genetic variation in finger millet among the cultivated varieties from varying agroecological adaptation. This finding is further supported by molecular diversity studies in other crops, where an overlap of accessions from different geographical regions was reported by Kimani et al. (Reference Kimani, Wachira and Kinyua2012) using 15 RAPD primer pairs to characterize 50 lablab bean (Lablab purpureus) accessions collected in Kenya. In Mali, Barro-Kodombo et al. (Reference Barro-Kodombo, Sagnard, Chantereau, Deu, vom Brocke, Durand, Gozé and Zongo2010) found a weakly stratified diversity in sorghum germplasm that could not be explained by any biophysical criteria with higher variability within populations as opposed to regions/zones. However, these findings differ from those of Fakrudin et al. (Reference Fakrudin, Kulkarni, Shashidhar and Hittalmani2004), who found variability based on regional origin in 12 finger millet accessions in India using 35 RAPD primers. Pairwise comparisons of countries and subregions clearly revealed that the highest variability was within the countries and subregions than between the countries and subregions of collection. Cluster analysis, F ST and PCoA did not correlate the diversity detected by the 19 SSR markers with the country of origin. The high genetic diversity observed within the Kenyan accessions and the least differentiation between the Tanzanian accessions from the minicore are indicative of the potential in this germplasm for finger millet improvement.
The low genetic differentiation observed between the countries with regard to the East African finger millet germplasm could be historical in nature due to the crop's origin from the eastern African region and hence these accessions share a common gene pool. The role and impact of seed-mediated gene flow, as evidenced by the regular cross-border finger millet trade and grain market seed sourcing, could explain the close relationship between most of the Kenyan and Ugandan accessions and the Kenyan and Tanzanian accessions, in addition to the close similarity in agroecologies between western Kenya and the three finger millet production subregions of Uganda. However, selections within countries and subregions for agroecological adaptation and end use play a key role in the variability observed within countries and subregions. Conversely, the overall wide diversity observed between the Uganda and Tanzania germplasm could be explained by the wide geographical separation; hence, any genetic commonality is largely due to farmer-to-farmer interactions in terms of seed exchanges and grain trade. The surprisingly low variability in the accessions from Uganda (despite the country being the primary centre of finger millet diversity) is a pointer to potential genetic erosion that could be due to the adoption of improved cultivars, high selection pressure to satisfy a growing commercial market (leading to genetic drift) and/or diversity loss during the recent period of war. Low polymorphism was also reported among highly inbred cultivated finger millet types in India by Fakrudin et al. (Reference Fakrudin, Kulkarni, Shashidhar and Hittalmani2004). There was almost an even distribution of the eight subclusters of major clusters 1 and 2 in the selected global minicore set groupings in the DARwin tree grouping, but no genotypes from cluster 3 were represented in the minicore accessions, pointing to a possibility of unique accessions in this germplasm not being captured in the global germplasm at the ICRISAT genebank. This is in agreement with the conclusions drawn by Upadhyaya et al. (Reference Upadhyaya, Gowda, Pundir, Reddy and Singh2006) that the composition of the core collection is subject to change as additional accessions become available. According to Ramu et al. (Reference Ramu, Billot, Rami, Senthilvel, Upadhyaya, Ananda Reddy and Hash2013), effective population structure assessment depends on the type of markers and how representative they are across the crop's genome. As only seven of the markers used in this study have been fully mapped, it is not known to what extent they provided adequate genome coverage across the linkage groups, which probably limited the ability to fully capture the existing variability in the germplasm.
Qualitative traits
Panicle shape and grain colour are often used by farmers in cultivar differentiation (de Wet et al., Reference de Wet, Prasada Rao, Brink and Mengesha1984). The predominance of brown grain types is based on quality acceptance dictated by farmer and industry preferences. During a survey carried out in Kenya and Uganda in 2002 (Sreenivasaprasad et al., Reference Sreenivasaprasad, Takan, Obilana, Manyasa, Brown, Bandyopadhyay and Muthumeenakshi2004), it was established that brown/red grain types were the most preferred because they made good beer and blended well with cassava for ugali (a stiff porridge eaten in East Africa). These were also mostly preferred by industry/processors for making composite and pure flours for weaning foods and porridges. These types also suffer less bird damage compared with the white grain types. Brown grain types with compact panicles have been reported to have resistance to finger blast (Pande, Reference Pande1992; Takan et al., Reference Takan, Akello, Esele, Manyasa, Obilana, Audi, Kibuka, Odendo, Oduori, Ajanga, Bandyopadhyay, Muthumeenakshi, Coll, Brown, Talbot and Sreenivasaprasad2004). The very low frequency of the occurrence of white grain types observed in this study was also reported by Tsehaye and Kebebew (Reference Tsehaye and Kebebew2002) and Bezawelataw et al. (Reference Bezawelataw, Sripichitt, Wongyai and Hongtrakul2007). The susceptibility of the white-seeded types to bird attack and grain mould (Fusarium spp.) in humid environments, especially in Ugandan and Kenyan agroecologies where finger millet is mainly grown, may have contributed to their low frequency. However, the morphological (qualitative) traits of panicle shape and both grain and plant colour seemed not to play a role in the delineation of diversity in this germplasm, as there was no correlation between genetic variability and phenotypic traits. This, however, was not unexpected, as the 19 markers used in the study are not known to be linked to any of these morphological traits. This was similarly observed in fonio (Digitaria exilis) by Adoukonou-Sagbadja et al. (Reference Adoukonou-Sagbadja, Wagner, Dansi, Ahlemeyer, Daïnou, Akpagana, Ordon and Friedt2007).
Conclusion
This study has shown that although there is a close relationship between the three East African countries' finger millet germplasm, substantial diversity exists within each country's germplasm. The Kenyan germplasm is more closely related to the Ugandan and Tanzanian germplasm and there is a wide variability between the Ugandan and Tanzanian germplasm. This could be attributed to geographical proximities, ethnic similarities and cross-border seed exchanges between neighbouring communities. The low diversity observed in the Ugandan accessions could point to genetic diversity loss due to the promotion and use of a few improved cultivars. The genetic diversity and high number of rare and private alleles detected could be attributed to the high diversity in the germplasm, considering that East Africa is the primary centre of finger millet diversity. The lack of representation of accessions from cluster 3 (largely represented by accessions adapted to cool high-elevation agroecologies) in the minicore set could provide an opportunity to enrich the global finger millet germplasm. No correlations between qualitative traits and genotypic diversity were observed. The diversity revealed in this germplasm will be valuable for conservation and for breeding programmes to develop diverse populations and lines to respond to prevalent abiotic and biotic stresses. The extent of the variability measured in the accessions in this study corresponds with that reported by the few other studies that have been conducted, and overall these studies provide incentive to develop more robust, trait-associated markers in finger millet.
Supplementary material
To view supplementary material for this article, please visit http://dx.doi.org/10.1017/S1479262114000628
Acknowledgements
This study was carried out with financial support from the Bill and Melinda Gates Foundation through the Harnessing Opportunities for Productivity Enhancement of Sorghums and Millets (HOPE) project and the Bio-resources Innovations Network for Eastern Africa Development (Bio-Innovate) Program supported by the Swedish International Development Cooperation Agency (SIDA). The authors thank Drs Henry Ojulong and Santosh Deshpande for their valuable comments, Dr Abhishek Rathore for biometrical support and Annis Saiyiorri and Vincent Njunge for assistance in laboratory analysis.


