Introduction
Oilseed rape (Brassica napus L.; genome AACC, 2n= 38) is originated through spontaneous interspecific hybridizations between turnip rape (Brassica rapa L., syn. campestris; AA, 2n= 20) and cabbage (Brassica oleracea L.; CC, 2n= 18) (Palmer et al., Reference Palmer, Shields, Cohen and Orton1983; Iñiguez Luy and Federico, Reference Iñiguez Luy, Federico, Bancroft and Schmidt2010). The oilseed rape gene pool is subdivided into winter and spring types (Becker et al., Reference Becker, Engqvist and Karlsson1995; Bus et al., Reference Bus, Körber, Snowdon and Stich2011). Within winter oilseed rape types, a decay of genetic diversity with reduced levels of erucic acid and glucosinolates has been observed (Bus et al., Reference Bus, Körber, Snowdon and Stich2011). Spring type is grown extensively in Canada, Australia, Southeast Asia and Scandinavia. Canola-type cultivars (low levels of erucic acid ( < 2%) and glucosinolate ( < 30 μM)) of B. napus and B. rapa (Downey and Rimmer, Reference Downey and Rimmer1993) are widely grown commercially.
The prominent breeding system in Australia since 1970 has been the open-pollinated (OP) pedigree selection (Cowling, Reference Cowling2007). For genetic improvement of B. napus, development of hybrids (having high levels of heterosis) is being preferred over OP varieties (Sernyk and Stefansson, Reference Sernyk and Stefansson1983; Grant and Beversdorf, Reference Grant and Beversdorf1985; Ahmad et al., Reference Ahmad, Farhatullah and Carlos2011). Canola hybrids are getting increased market share worldwide due to a high seed yield under normal, dry and nutrient-poor conditions (Gehringer et al., Reference Gehringer, Snowdon, Spiller, Basunanda and Friedt2007; Malhi et al., Reference Malhi, Brandt, Ulrich, Lafond, Johnston and Zentner2007). In hybrid brassica breeding programmes, cytoplasmic male sterility (CMS) lines are crossed with a large number of promising breeding lines. Parents that give complete pollen sterility are identified as maintainers (M) and used for further backcrossing to CMS sources, while those parents that give 100% pollen fertility are identified as restorers (R) of sterility and are further tested for combining ability.
The knowledge of genetic diversity is indispensable in the development of commercial hybrids. In addition to morphological characterizations, molecular characterization is essential for elucidating the genetic relationship among accessions. Genetic diversity and cultivar relatedness in Brassica can be assessed using various tools including, isozyme and DNA-based markers such as restriction fragment length polymorphism (RFLPs), Random Amplification of Polymorphic DNA (RAPDs), simple sequence repeats and Amplified fragment length polymorphism (AFLPs) (Figdore et al., Reference Figdore, Kennard, Song, Slocum and Osborn1988; Hu and Quiros, Reference Hu and Quiros1991; Song and Osborn, Reference Song and Osborn1992; Hasan et al., Reference Hasan, Seyis, Badani, Pons-Kuhnemann, Friedt, Lühs and Snowdon2006; Chen et al., Reference Chen, Nelson, Ghamkhar, Fu and Cowling2008; Turi et al., Reference Turi, Farhatullah, Malik and Zabta2012).
For the present study, we selected a marker system called sequence-related amplified polymorphism (SRAP) because of its simplicity, reproducibility and disclosure of multiple markers from a single two-primer reaction (Li and Quiros, Reference Li and Quiros2001; Ahmad et al., Reference Ahmad, Potter and Southwick2004; Wu et al., Reference Wu, Chen, Lu, Wang, Xu and Guizhan2009; Ahmad et al., Reference Ahmad, Farhatullah, Khan and Carlos2013). SRAP molecular markers are more concordant with the morphological variability and evolutionary history of morphotypes than AFLP markers (Ferriol et al., Reference Ferriol, Pico and Nuez2003).
The objectives of the present study were to assess and characterize the pattern of genetic diversity in B. napus OP cultivars, M and R lines, and to identify potential parents for the development of commercial hybrids using SRAP molecular markers. We also studied the extent of molecular marker variations between OP cultivars and their respective selfed inbred lines. This information would help breeders and geneticists understand the structure of B. napus germplasm and help them predict which parents have the best chance for cross-combination to give more heterosis.
Materials and methods
Plant material
A set of 60 B. napus accessions including 11 maintainers, 23 restorers and 26 OP cultivars were included in the present study (Supplementary Table S1, available online). The OP cultivars were mostly named cultivars from Australia, Canada, Europe and Pakistan and included spring types either with or without canola quality (Supplementary Table S1, available online). The M lines were confirmed by crossing with CMS lines and then selfed for at least five to seven generations. Similarly, the R lines were confirmed after 100% restoration of CMS lines and then selfed for at least five to seven generations.
DNA extraction
The plant material was grown in pots at the green house facility at the University of California, Davis, USA. DNA was extracted from fresh leaves by the cetyltrimethylammonium bromide (CTAB) method of Doyle and Doyle (Reference Doyle and Doyle1990) with some modifications. A 300–400 mg sample was added into a 1.5 ml microcentrifuge tube and crushed into powder under liquid nitrogen. Preheated extraction buffer (500 μl of 2% CTAB, 100 mM Tris–HCl, pH 8.0, 1.4 M NaCl, 20 mM EDTA, 1% PVP-40 and 10 mM DTT) and 10 μl proteinase K (50 μg/ml) were then added and the tube was incubated at 65°C for 90 min in a water bath. The tube was cooled to room temperature and 500 μl of chloroform–isoamyl alcohol (24:1) were added. The solution was mixed gently and centrifuged at 13,000 × g for 5 min. The supernatant was transferred to a fresh tube, 0.6 volumes of isopropanol were added and mixed gently to precipitate the DNA. The mixture was centrifuged at 13,000 × g for 5 min, the supernatant was removed and the DNA pellet was washed with 70% (v/v) ethanol. The pellet was then air-dried and resuspended in 100 μl of Tris–EDTA buffer. DNA quality and quantity was determined by electrophoresis in an ethidium bromide-stained 1.0 % (w/v) agarose gel.
Molecular markers
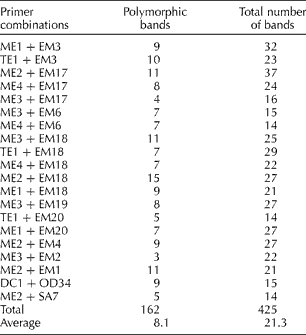
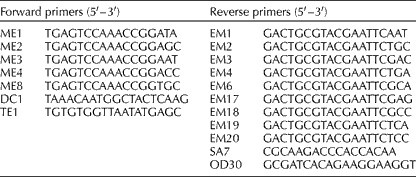
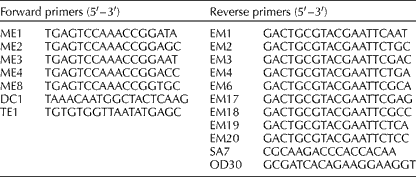
A PCR-based technique, SRAP, which preferentially amplifies each open reading frame, was tested on the B. napus accessions (Li and Quiros, Reference Li and Quiros2001). Initially, 45 SRAP primer combinations were tested on eight diverse B. napus accessions from different origins. Of these, 20 primer combinations were selected, as they provided the greatest reproducibility and the number of markers per gel (Table 1). Eight forward primers, with the one labelled with IRD800 or IRD700 to be detected in a Li-Cor DNA sequencer (Long Readir 4200), and 11 reverse primers were used (Table 2).
Table 1 Sequence-related amplified polymorphism primers used for the analysis of Brassica napus accessions and the number of polymorphic fragments revealed by each primer combination
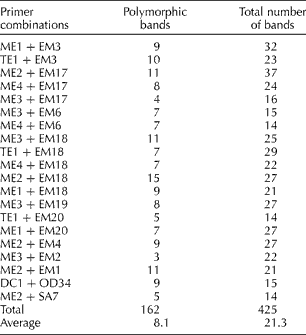
Table 2 List of eight forward primers, with the one labelled with IRD800 or IRD700 to be detected in a Li-Cor DNA sequencer, and 11 reverse primers
At the beginning of the PCR reaction, the annealing temperature was set at 35°C and run for five cycles. Then, the annealing temperature was raised to 50°C for another 35 cycles. Denaturing was done at 94°C for 1 min, while extension was at 72°C for 1 min in both the first five cycles and the last 35 cycles. Thereafter, 1 μl of the reaction products was mixed with 6 μl of formamide dye, denatured at 94°C for 3 min and rapidly cooled on ice for 5 min. Amplicons were separated in denaturing 5.5 % (w/v) polyacrylamide gels (0.25 mm spacer thickness) and detected by a DNA sequencer (Gene Readir 4200; Li-Cor). Only bright, clearly distinguishable bands were used in the genetic analysis. Apparent polymorphisms appearing with band sizes below 50 bp or above 600–700 bp were rejected due to the inconsistency of amplification and the weakness of bands. To test the reproducibility of the SRAP banding patterns, two independent PCR amplifications were performed for each of the same samples and run side by side.
Data collection and analysis
Only fragments that were polymorphic among the accessions and could be clearly scored were used in the data analysis. Each of these fragments was scored independently. The fragment data were entered into a spreadsheet to form a 0–1 matrix, with 1 representing the presence of a fragment and 0 representing the absence of a fragment for each fragment accession combination. Genetic similarity (GS) among the accessions was calculated according to the method of Nei and Li (Reference Nei and Li1979):
where N ij is the number of bands in common between lines i and j, and N i and N j are the total number of bands in lines i and j, respectively. Thus, GSij reflects the proportion of bands in common between two accessions and may range from 0 (no common bands) to 1 (identical profiles of two lines). Cluster analysis based on the unweighted pair-group method with arithmetic average (UPGMA; Sneath and Sokal, Reference Sneath and Sokal1973) was performed on the matrix of GS estimates and a dendrogram constructed using NTSYS pc 2.0. Bootstrap values of 1000 were calculated and only numbers above 500 were indicated on the tree branches.
Results
B. napus accessions including 11 maintainers, 23 restorers and 26 OP cultivars (Supplementary Table S1, available online) were evaluated for genetic diversity study using 20 SRAP primer combinations (Table 1). These primers were selected because they revealed polymorphisms among the eight B. napus accessions in a preliminary screening. The 20 SRAP primer combinations produced sufficient polymorphism in the tested 60 accessions, which was used for calculating similarity coefficient. A total of 425 bands ranging in size from 50 to 650 bp, with an average of 21 bands per individual per primer combination were produced, of which 162 were polymorphic with an average of eight polymorphic bands per primer combination (Table 1). The primer combination Me2+Em18 was highly effective in generating polymorphism (15 polymorphic bands in the 60 lines tested), whereas the combination Me3+Em2 produced only three polymorphic bands. The majority of the accessions were uniquely identified by the markers with the exception of near-isogenic M lines and their corresponding OP cultivars. No marker difference was observed between the two R inbred lines R-159 and R-16. The percentage of polymorphic fragments was greater in the M lines since these were mostly originated from diverse sources.
The molecular data of 162 markers were used to calculate genetic similarity coefficient for all pairs of accessions and a phenogram was constructed from these values with the UPGMA (Fig. 1). Genetic similarity estimates calculated among the accessions varied from 0.40 to 0.97 for all the accessions except for two identical R inbred lines R-159 and R-161. Cluster analysis placed all the accessions into five main groups (Fig. 1). The first group (cluster 1) included mainly Australian OP cultivars and some of their respective selfed inbred lines. This cluster was further divided into three sub-clusters (I-a, I-b and I-c). Sub-cluster I-a included six canola-type M lines (Dunkeld, Dunkeld-S6, Bulbul, Bulbul-S6, Rainbow and Rainbow-S6) and one R inbred line (R-115). Sub-cluster I-b included two restorer lines (R-128 and R-117) of the same origin and ten accessions of both canola and non-canola types (Oscar, Oscar-S6, Maluka, Maluka-S6, Eureka, Marnoo, Taparoo, Altex, Altex-S6 and Galaxy) of Australian origin and identified as the M of CMS. Sub-cluster I-c included only four canola-type M lines (Shiralee, Shiralee-S5, Range and Narendara). The second cluster mainly included accessions of Canadian origin and was further divided into two sub-clusters: II-a (Siren, Tower, Tower-S5, Triton, Siren-S6) and II-b (Wester, Wester-S7, Regent, Golden and Excel) and two R lines (R-110 and R-121). The third cluster mainly included R lines and was further sub-divided into two sub-clusters: III-a (R-111, R-111-1, R-111-2, R-111-3, R-111-4, R-111–10, R-111-5, R-111-7 and R-111-9) and III-b (R-101, R-101-1, R-101-2, R-101-3, R-101-4 and R-101-9). The fourth cluster included mostly OP cultivars of Scandinavian origin from Europe (Topas, Global, Crystal, Stallion and Delta). The last two accessions ‘Salam’ and its respective inbred line are the most divergent and are separate from the rest of the samples.

Fig. 1 (colour online) Dendrogram showing the relationships among the 60 B. napus maintainers, restorers and OP cultivars using SRAP molecular markers. Numbers on the branches indicate bootstrap values above 500.
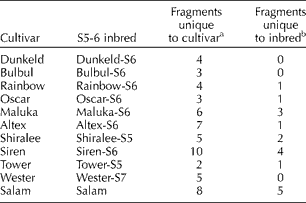
Analyses of a set of 11 OP cultivars and their respective inbreds selfed for five to seven generations indicated a range of marker differences between the cultivars and inbreds (Table 3). Most of the inbreds clustered with their respective cultivars. The maximum number of markers was lost in the cultivar Siren followed by Salam.
Table 3 Number of marker differences between open-pollinated cultivars and their respective selfed lines (for five to seven generations)
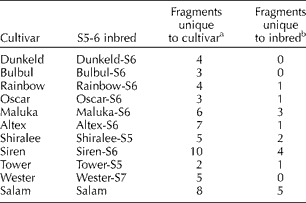
a Number of markers present in the cultivar that were absent in the inbred line.
b Number of markers present in the inbred line that were absent in the cultivar.
Discussion
SRAP molecular markers resulted in eight markers per primer combination, which is more than the RAPD markers of four per gel as observed by Mailer et al. (Reference Mailer, Scarth and Fristensky1994) in rapeseed cultivars and less than 19.1 per gel of the AFLP markers as reported by Lombard et al. (Reference Lombard, Baril, Dubreuil, Blouet and Zhang2000) in spring- and winter-type accessions. The large number of markers in the AFLP study may be in part due to testing of highly divergent spring- and winter-type Brassica accessions. Our results are in accordance with other researchers using SRAP molecular markers (Budak et al., Reference Budak, Shearman, Parmaksiz, Gaussoin, Riordan and Dweikat2004; Guo and Luo, Reference Guo and Luo2006; Sun et al., Reference Sun, Gao, Lin, Zhu, Xie and Lin2006), where they also found a moderate level of polymorphism using SRAP molecular markers.
The SRAP molecular markers were quite useful in the discrimination of B. napus accessions. In general, most of the lines closely related by pedigree and/or derived from germplasm having specific traits clustered together (Wu et al., Reference Wu, Chen, Lu, Wang, Xu and Guizhan2009; Ahmad et al., Reference Ahmad, Farhatullah, Khan and Carlos2013). The cluster analyses separated the accessions into five major groups. The accessions from Australia, Canada and Europe were grouped separately. The genetic diversity within the cluster was very narrow. This may be due to the increased selection pressure resulting in a number of high oil and protein content of canola-type varieties (e.g. Dunkeld, Rainbow and Oscar). Second, by looking to the pedigree of Australian accessions, they mainly contain genetic material from few cultivars such as Zephyr, Bronowski, and Chisaya and in some cases Norin20 from Japan and Cresus-o-Precose. This has made the genetic background of these cultivars very narrow and molecular markers have grouped these accessions into a single large cluster. All of the Australian and Canadian OP cultivars were M of the CMS and thus most probably carry the same cytoplasm. Diers and Osborn (Reference Diers and Osborn1994) showed that the Australian cultivars Taparoo, Galaxy, Maluka and Marnoo clustered together as was observed in our study.
The University of Manitoba, Canada, B. napus cultivars ‘Tower’ and ’Regent’, clustered together and have the same pedigree as noted by Sernyk (Reference Sernyk1990). Similarly, Mailer et al. (Reference Mailer, Scarth and Fristensky1994) noted that the Canadian cultivars Westar, Excel and Regent also clustered together using RAPD markers. Results of 43 RFLP markers of Diers and Osborn (Reference Diers and Osborn1994) also indicated the close association of the Canadian cultivars Regent, Wester, Triton and Tower. However, their study could not separate the cultivars ‘Triton’ and ‘Tower’ from each other.
The four Scandinavian cultivars Crystal and Stallion (Sweden, Sval6f Seed Ltd), Global (Denmark, Sval6f Seed Ltd), Delta (Sweden, Pioneer Hibred International) and Topas clustered closely. These are distant from Australian accessions since none of the Australian or Canadian accessions has genetic material from these lines. Mailer et al. (Reference Mailer, Scarth and Fristensky1994) also reached the same conclusion of clustering of the Sweden cultivars, Delta, Stallion, Crystal and Global using RAPD markers and concluded that the relationships among some of the cultivars are closer for those from the same breeding programme than for those from different programmes. Similarly, the most distant accessions were the white-flowered cultivar ‘Salam’ and its corresponding inbred line (obtained by crossing B. oleracea and B. napus; Quazi, Reference Quazi1988).
The two R lines R-111 and R-101 along with their corresponding backcross and F5–6 progeny made the third cluster and further divided into two sub-clusters. The accessions within these clusters display poor genetic diversity because most of them have been derived locally and one or both of their parents are common in their pedigrees. In sub-cluster III-a, one of the common parents is R-111, while for another sub-cluster (III-b), the R line R-101 is one of the parent in their pedigree. The fact that these R lines are separated from the M inbred lines could be useful for a possible hybrid combination. Restorer lines such as R-115 and R-128 grouped within the same cluster with maintainer lines and having comparatively more genetic similarity indicated their limited utility for hybrid development within the same cluster. Restorer, exhibiting high genetic dissimilarity with most of the M lines, could be promising in hybrid development.
A set of 11 OP cultivars and their respective inbreds selfed for five to seven generations were also analysed in the present study. The inbreds were developed to be used as M or R for hybrid seed production. We used molecular markers to determine the extent of similarity between OP cultivars and their respective selfed inbreds. In addition to the morphological differences such as reduced height and loss of vigour, the marker analysis also revealed a range of marker differences between the cultivars and inbreds (Table 3). In the phylogenetic tree, most of the inbreds were near to their respective cultivars except for the inbred line from the cultivar ‘Siren’. The maximum number of extra fragments was present in the cultivar ‘Siren’ but was not present in the inbred line. This scenario was observed for most of the inbred lines where an extra marker was present in the cultivar, but not present in the inbred line. The same observation was also reported by Diers and Osborn (Reference Diers and Osborn1994). According to these authors, loss of fragments resulted from inbreeding when inbreds were made from heterozygous or heterogeneous cultivars. We also had a similar situation where inbreds had an extra fragment but the cultivar did not possess it. The extra marker in the inbred line might be explained by the fact that the plants selected for inbreeding contained fragments from the cultivar that were not present in those selected for SRAP analysis. The number of fragments present in the cultivar that were absent in the inbred line and that of fragments present in the inbred line that were absent in the cultivar are possible because the cultivars are somewhat heterogeneous (Diers and Osborn, Reference Diers and Osborn1994).
Conclusions
The present study showed that SRAP molecular markers functioned well in exploring the genetic diversity among B. napus accessions. The study revealed that considerable genetic diversity was detected between the maintainer and restorer inbred lines, but not within the same cluster. The SRAP molecular markers were more concordant with the morphological variability and pedigree of the lines. The recurrent parent-backcross line pairs and the cultivar inbred pairs were each clustered closely together as expected. The R lines in different clusters could be potential pollinators for the elite CMS/M lines in different clusters. Furthermore, the diversity assessed can be manipulated to broaden the genetic base of elite maintainer and CMS lines for the development of commercial hybrid varieties.
Supplementary material
To view supplementary material for this article, please visit http://dx.doi.org/10.1017/S147926211300021X
Acknowledgements
The authors thank Victor Wutor, Lethbridge Research Center, Agri-Food Canada and Janssens Marc, University of Bonn, Germany, for technical review of the manuscript. They also thank Genyi Li Assistant Professor, Department of Plant Sciences, University of Manitoba, Canada, for his help in the SRAP molecular marker system. The authors are indebted to Doug Walker, Vince D. Antonio, University of California at Davis, USA for maintaining the plant material in the greenhouse and Yasir Khan for his valuable help in formatting the manuscript. The authors are grateful to two anonymous reviewers for their technical inputs.


