


Introduction
Safflower (Carthamus tinctorius L.) is a traditional oilseed crop in the world. Its seeds, flowers and foliage are used for diverse human needs. Its seed oil is a healthy edible oil due to high unsaturated fatty acid content (~90%) (Li and Mündel, Reference Li and Mündel1996). It originated in the Fertile Crescent region over 4000 years ago and domesticated in the Far East, India, Pakistan, the Middle East, Egypt, Sudan, Ethiopia and Europe (Chapman and Burke, Reference Chapman and Burke2007). Currently, it is grown commercially in 15 countries including India, Mexico, the USA and Argentina as major producers (FAOSTAT, 2012). Though safflower is a valuable crop, the cultivation is rapidly decreasing in India due to low productivity (~800 kg/ha). Furthermore, the popular cultivars are low oil (~30%) and high linoleic (~70%) types, which are less attractive to food industry. Considering the emerging markets, concerted efforts are required in India to breed cultivars with high oil yield potential coupled with high oleic acid content and to achieve greater profitability for safflower cultivation.
Genetic diversity in the germplasm collection is crucial to achieve these goals through targeted breeding programmes. Excellent variability for seed yield related traits, oil content (13–46%) and unsaturated fatty acids (oleic or linoleic) (~20 or ~70%) have been preserved in the global safflower germplasm collection (Fernández-Martinez et al., Reference Fernández-Martinez, del Rio and de Haro1993; Johnson et al., Reference Johnson, Bergman and Flynn1999; Usha Kiran et al., Reference Usha Kiran, Mukta, Kadirvel, Alivelu, Senthilvel, Kishore and Varaprasad2015). However, among trait specific germplasm sources, the exotic varieties that are genetically diverse and show no genotype × environment (G × E) interaction for the target traits could be highly valuable because they could contribute unique alleles and could be readily deployed without much pre-breeding efforts (Holland, Reference Holland2004). For instance, the safflower varieties of the USA were used to develop improved varieties in Mexico (Muñoz-Valenzuela et al., Reference Muñoz-Valenzuela, Musa, Montoya-Coronado, Rivera-Rojas, Janick and Whipkey2007) and Morocco (Nabloussi and Boujghagh, Reference Nabloussi and Boujghagh2006). Some of the Mexican safflower varieties are reported to be high oil (~40%) and high oleic (~70%) types (Montoya-Coronado, Reference Montoya-Coronado, Knights and Potter2008) which may have the potential to contribute for safflower improvement in India. Understanding the genetic relatedness of the Mexican cultivars with the Indian counterparts would be helpful for their utilization in Indian breeding programmes. Simple sequence repeat (SSR) markers are considered the best among genetic markers to reveal genetic diversity and relatedness in crop germplasm and cultivar collections due to desirable properties (Powell et al., Reference Powell, Morgante, Andre, Hanafey, Vogel, Tingey and Rafalski1996). Extensive information on SSR markers is available in safflower (Chapman et al., Reference Chapman, Hvala, Strever, Matvienko, Kozik, Michelmore, Tang, Knapp and Burke2009; Ambreen et al., Reference Ambreen, Kumar, Variath, Joshi, Bali, Agarwal, Kumar, Jagannath and Goel2015). However, only two skeleton SSR linkage maps have so far been reported (Mayerhofer et al., Reference Mayerhofer, Archibald, Bowles and Good2010), which are useful for selection of SSR loci for diversity studies (Usha Kiran et al., Reference Usha Kiran, Mukta, Kadirvel, Alivelu, Senthilvel, Kishore and Varaprasad2015). To date, no high-density genetic map and reference genome sequence have been developed. In this study, our objectives were to investigate genetic distinctiveness between Indian and Mexican safflower cultivars (a set of 53 genotypes consisting of varieties, hybrids and advanced lines developed over 50 years), using SSR markers and to assess the potential of Mexican varieties and advanced lines for improvement of oil and oleic acid contents in the Indian safflower cultivars.
Materials and methods
Plant material
A panel of 53 safflower genotypes consisting of 30 Indian cultivars/advanced lines and 23 varieties/advanced lines from Mexico was used for molecular characterization. The Indian group included varieties, hybrids and advanced lines developed at breeding centres: Annigeri, University of Agriculture Sciences-Dharwad (UAS-D) (Karnataka); Phaltan, Nimbkar Agricultural Research Institute (NARI) (Maharashtra); Solapur, Mahatma Phule Krishi Vidyapeeth (MPKV) (Maharashtra); Akola, Dr Panjabrao Deshmukh Krishi Vidyapeeth (Dr PDKV) (Maharashtra); Parbhani, Vasantrao Naik Marathwada Krishi Vidyapeeth (VNMKV), (Maharashtra) and Indore, Rajmata Vijayaraje Scindia Krishi Vishwa Vidyalaya (RVSKVV) (Madhya Pradesh). The Mexican safflower varieties and advanced lines were obtained from Instituto Nacional de Investigaciones Forestales, Agricolas y Pecuarias (INIFAP), Campo Experimental Valle del Yaqui, Sonora. More details of the genotypes are provided in Table 1.
Table 1. List of safflower cultivars/advanced lines used in the study
Genotyping using SSR markers
DNA was extracted using pooled leaf samples (ten plants per genotype) following the procedure described by Doyle and Doyle (Reference Doyle and Doyle1987). A set of 38 SSR primer-pairs published by Mayerhofer et al. (Reference Mayerhofer, Archibald, Bowles and Good2010) were synthesized for genotyping work. These primers were derived from expressed sequence tag (EST) sequences of safflower. The repeat motif types were perfect dinucleotide (at 28 loci), trinucleotide (at one locus), hexanucleotide (at one locus) and compound (at eight loci). The primers were chosen based on genetic linkage map positions (Mayerhofer et al., Reference Mayerhofer, Archibald, Bowles and Good2010) and random coverage on linkage groups (LG) (10 out of 12) was ensured. Distribution of SSR loci on different LG was as follows: LG1-5, LG2-2, LG3-3, LG4-6, LG5-7, LG6-5, LG7-2, LG8-3, LG9-2 and LG10-3. Details of SSR primer sequences are provided in online Supplementary Table S1. PCR conditions were as follows: 94°C for 5 min for initial denaturation, 35 cycles of 94°C for 30 s for denaturation, 55°C for 30 s for annealing and 72°C for 30 s for extension followed by 72°C for 5 min for final extension in a thermocycler (BioRad Laboratories Inc). Different annealing temperatures were maintained depending upon the requirement for a specific primer pair. The PCR products were resolved in 6% polyacrylamide gel electrophoresis (PAGE) (BioRad Laboratories Inc.) and the polymorphisms were visualized after silver staining. The polymorphic SSR alleles were scored as codominant markers using different characters such as 1 (allele number 1), 2 (allele number 2), 3 (allele number 3), etc.
Genetic diversity analysis
The genetic diversity measures namely number of alleles (N A), gene diversity (expected heterozygosity; H e) and polymorphism information content (PIC) were obtained using the software program PowerMarker version 3.25 (Liu and Muse, Reference Liu and Muse2005). The N A refers to total number of alleles detected at a single SSR locus across individuals in the population. The H e refers to the probability that two randomly chosen alleles from the population are different. The PIC refers to the value of a marker for detecting polymorphism within a population, which is derived from the number of detectable alleles and the distribution across individuals.
Distance-based cluster analysis
The genetic distinctness among genotypes was determined by weighted neighbour-joining (NJ) tree-based cluster analysis using dissimilarity coefficient (simple matching) as implemented in DARwin (Dissimilarity Analysis and Representation for windows) V.5.0.158 (Perrier and Jacquemoud-Collet, Reference Perrier and Jacquemoud-Collet2006). The statistical support for the branching points in the dendrogram was obtained by bootstrap analysis with 1000 replications.
Kinship analysis
Pairwise kinship coefficients were obtained by regression analysis (Ritland, Reference Ritland1996) as implemented in the statistical programme SPAGeDi 1.4c – a program for spatial pattern analysis of genetic diversity (Hardy and Vekemans, Reference Hardy and Vekemans2002). Negative values of the coefficients were considered zero.
Model based structure analysis
The genotypic data of 38 SSR loci were analysed in the STRUCTURE 2.3.3 program (Pritchard et al., Reference Pritchard, Stephens and Donnelly2000) to detect the possible number of sub-populations (K) within the collection of 53 genotypes. Number of possible clusters was assumed to be 1–10. The mean posterior probability [LnP(D)] values per cluster (K) were obtained based on ten replicates. The delta K measure (Evanno et al., Reference Evanno, Regnaut and Goudet2005) was used to determine the number of populations as implemented in the online version of STRUCTURE HARVESTER (http://tayloro.biologyucla.edu/Struct_harvest) (Earl and VonHoldt, Reference Earl and vonHoldt2012). The membership coefficient of each genotype in the putative number of sub-populations was obtained using the admixture model with a burn-in period of 200,000 and replications of 500,000. The genotypes with membership coefficient more than 0.75 were assigned to the respective sub-population and less than 0.75 were assigned to the admixture group.
Analysis of molecular variance
Hierarchical analysis of molecular variance (AMOVA) partitions genetic variation among or within groups in order to understand the amount of population differentiation. The AMOVA and pairwise Fst estimates were obtained using the software Arlequin 3.11 with the permutations of 1000 (Excoffier et al., Reference Excoffier, Laval and Schneider2005). The Arlequin creates a distance matrix and partitions the sum of squared deviations from distance matrix into hierarchical variance components, which are tested for significance using permutation tests.
Agronomic evaluation
A subset of ten Mexican varieties/advanced breeding lines, which showed more than 35% oil content in a preliminary field trial at Indian Council of Agricultural Research (ICAR)-Indian Institute of Oilseeds Research (IIOR), Hyderabad during 2012–2013 (data not shown), was evaluated for agronomic performance at three major safflower breeding centres (vertisols) in India: IIOR-Hyderabad (17.37°N, 78.48°E), RVSKVV-Indore (20.43°N, 76.54°E) and VNMKV-Parbhani (19.16°N, 76.54°E) during 2013–2014. A recently developed high oil variety NARI-57 was included as a local check. Randomized Complete Block Design (RCBD) was followed with three replications. The trial plot consisted of five rows of 5 m length with the spacing of 45 cm (between rows) × 20 cm (between plants). The field was irrigated once either by flooding or by sprinkler after seed sowing. Weather conditions during post-sowing period (October 2013–April 2014) at the locations were as follows: Hyderabad (rainfall 326 mm, maximum temperature range 29.4–37.1°C, minimum temperature range 11.4–23.2°C), Indore (rainfall 198 mm, maximum temperature range 30.3–38.1°C, minimum temperature range 12.2–20.0 °C) and Parbhani (rainfall 268 mm, maximum temperature range 31.5–39.1°C, minimum temperature range 20.7–20.8 °C). Data on days to 50% flowering, days to maturity, seed yield per plant (g) and oil content (%) were collected using the standard evaluation procedures (IBPGR, 1983). The oil content (%) was measured in nuclear magnetic resonance (NMR) spectroscopy using 20 g of pooled seed samples from each plot (Yadav and Murthy, Reference Yadav and Murthy2016).
Data on fatty acid composition of a subset of eight Mexican varieties and advanced lines were obtained from a separate trial (RCBD with three replications) at Hyderabad using Indian varieties: A-1, Bhima and NARI-57 as checks. Oil from seed was extracted in hexane on soxhlet apparatus (Extraction unit, E-816, Buchi). Methyl esters were obtained by a two-step catalytic process according to slightly modified method of Ghadge and Raheman (Reference Ghadge and Raheman2005). In the first step, the oil (100–150 mg) was treated with 2% sulphuric acid in methanol (5 ml) for 2 h at 60°C. After the reaction, the mixture was allowed to settle for an hour and methanol–water mixture that separated at the top was removed. In the second step, product at the bottom was transesterified using 2 ml of 13% methanolic KOH for 30 min at 55°C. The organic phase was extracted with hexane and washed with water till it reached neutral pH. The hexane was dried over anhydrous sodium sulphate and concentrated with nitrogen to get methyl esters.
Fatty acid composition was determined using an Agilent 7860A gas chromatograph equipped with a flame ionization detector (FID), a split injection port and an auto-sampler. Peak separation was performed on a DB-225 fused silica capillary column (diameter 250 µm, length 30 meter and film thickness 0.25 µm) from Agilent Technologies. The samples (0.2 µl) were injected in split mode (split ratio 1:20). The initial oven temperature was set at 160°C for 2 min, raised to 220°C (at a rate of 6°C/min) and held at 220°C for 10 min. Both inlet and detector were set to 230°C. The carrier gas was nitrogen set to a constant flow rate of 1.2 ml/min. Peak identification was performed by comparing the relative retention times with those of a commercial standard mixture of FAME (Supelco 37 Component FAME Mix). Fatty acid composition [palmitic acid (C16:0), stearic acid (C18:0), oleic acid (C18:1) and linoleic acid (C18:2)] was determined by calculating relative peak areas per cent by GC post run analysis using EZChrom elite compact software.
Data were subjected to analysis of variance (ANOVA) and mean comparison (LSD5%) using the statistical analysis package Plant Breeding Tools (PBTools) v 1.3 (IRRI, 2013).
Results
Genetic diversity estimates
Range and mean of genetic diversity measures: N A, H e and PIC of the total safflower cultivar group of India and Mexico, Indian group alone and Mexican group alone based on 38 SSR loci are presented in Table 2. All 38 loci were polymorphic in the total group, whereas 30 loci were polymorphic in the Indian group and 35 were polymorphic in the Mexican group. Overall, a total of 120 alleles were detected across 38 loci. The allele number per SSR locus ranged from 2 to 10 for the total group and from 2 to 8 for the Indian as well as the Mexican group with the mean of 3.2, 3.1 and 2.6, respectively. Out of 120 alleles, 23 (19%) specific to Indian group and 19 (16%) specific to Mexican group were detected at 23 loci. The expected heterozygosity (H e) ranged from 0.04 to 0.77 for the total group, from 0.06 to 0.66 for the Indian group and from 0.08 to 0.85 for the Mexican group with the mean of 0.42, 0.37 and 0.37, respectively. The PIC values for SSR primer pair ranged from 0.04 to 0.75 for the total group, from 0.06 to 0.61 for the Indian group and from 0.08 to 0.83 for the Mexican group with the mean of 0.36, 0.33 and 0.32, respectively.
Table 2. Genetic diversity estimates within and between Indian and Mexican safflower cultivar groups based on 38 SSR loci
N A, number of alleles at a SSR locus; H e, expected heterozygosity (gene diversity); PIC, polymorphism information content.
‘–’ indicates monomorphic locus.
Genetic distinctness
NJ tree based on pairwise dissimilarity coefficients revealed three major clusters of cultivars. Indian cultivars grouped in two clusters: cluster-I consisted of 26 cultivars and cluster-II consisted of four cultivars (NARI-57, RVS-113, JSI-99 and NARI-6). The Mexican cultivars grouped in a single cluster, which was clearly distinct from the cluster-I of the Indian cultivars with high bootstrap support (64%). Very low bootstrap value (8%) did not support distinctness of the Indian cluster-II from both the Indian cluster-I and the Mexican cluster. Dendrogram showing the clusters of cultivars is presented in Fig. 1.
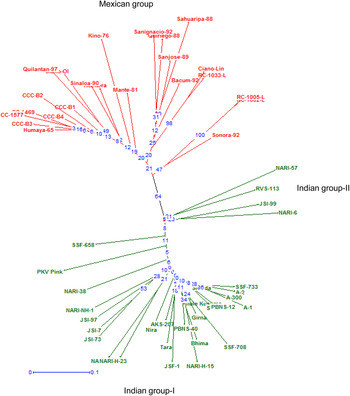
Fig. 1. Neighbour-joining tree showing genetic distinctiveness of Indian and Mexican safflower cultivars/advanced lines based on 38 SSR loci. Bootstrap percentage values are shown on the branches.
In the total group, pairwise dissimilarity coefficients ranged from 0.03 (RC-1002-L and RC-1005-L) to 0.69 (JSI-97 and Kino-76) with an average of 0.40. In Indian group, the pairwise dissimilarity coefficients ranged from 0.05 (SSF-748 and Sharda) to 0.50 (Phule Kusuma and NARI-57, PKV-Pink and NARI-57, SSF-708 and NARI-57, PKV-Pink and JSI-73) with an average of 0.31. In Mexican group, the pairwise dissimilarity coefficients ranged from 0.03 (RC-1002-L and RC-1005-L) to 0.51 (Humaya-65 and San Ignacio-92, Kino-76 and San Ignacio-92, CCC-B2 and Ciano-Lin, Quilantan-97 and Ciano-Lin) with an average of 0.32.
Kinship
Twenty-two of the Indian safflower cultivars and advanced lines had either zero or negative kinship coefficients with Mexican safflower varieties. Eight cultivars had positive kinship values: NARI-6 (range 0.004–0.15), NARI-57 (range 0.01–0.33), NARI-NH-1 (range 0.01–0.16), PKV Pink (0.12), SSF-658 (range 0.04–0.14), SSF-708 (range 0.02–0.06), JSI-99 (0.15) and RVS-113 (0.16). NARI-57 shared the maximum kinship with Ciano-Lin (0.33) and JSF-1 (0.32). Within Indian group, JSF-1 and NARI-57 had the highest kinship coefficient of 0.43. The other Indian cultivar pairs that shared substantial kinship were NARI-6 and PKV Pink (0.31), JSI-7 and JSI-73 (0.35), A-1 and A-300 (0.28), NARI-52 and NARI-57 (0.28), NARI-6 and JSI-99 (0.27), NARI-38 and SSF-733 (0.27), JSI-97 and JSI-73 (0.27), and RVS-113 and NARI-57 (0.26). Within Mexican group, RC-1002-L and RC-1005-L (0.89) and RC-1033-L and Ciano-Lin (0.81) had high kinship coefficients. The other Mexican varietal pairs that shared substantial kinship were Sahuaripa-88 and Sanjose-89 (0.35), Quiriego-88 and San Ignacio-92 (0.34), San Ignacio-92 and Bacum-92 (0.31), Quiriego-88 and Bacum-92 (0.27), Sanjose-89 and San Ignacio-92 (0.27), and Humaya-65 and Aceitera (0.27).
Population structure
The delta-K (DK) analysis of LnP(D) values showed a sharp peak at K = 2, suggesting two sub-populations (Indian group and Mexican group) within a collection of 53 genotypes (Fig. 2). The genotypes were assigned to specific population group based on the threshold value (≥0.75) of membership coefficients. In the Indian group, 26 cultivars had the membership coefficients more than the threshold value of 0.75, while NARI-6, NARI-57, SSF-658 and RVS-113 showed admixture. All Mexican cultivars and advanced lines had the membership coefficients more than the threshold value of 0.75, which ranged from 0.835 to 0.997. The Indian variety NARI-57 had the maximum admixture (towards Mexican group-0.619 and towards Indian group-0.381) followed by NARI-6 (towards Mexican group-0.532 and towards Indian group-0.468). The STRUCTURE plot is presented in Fig 2.
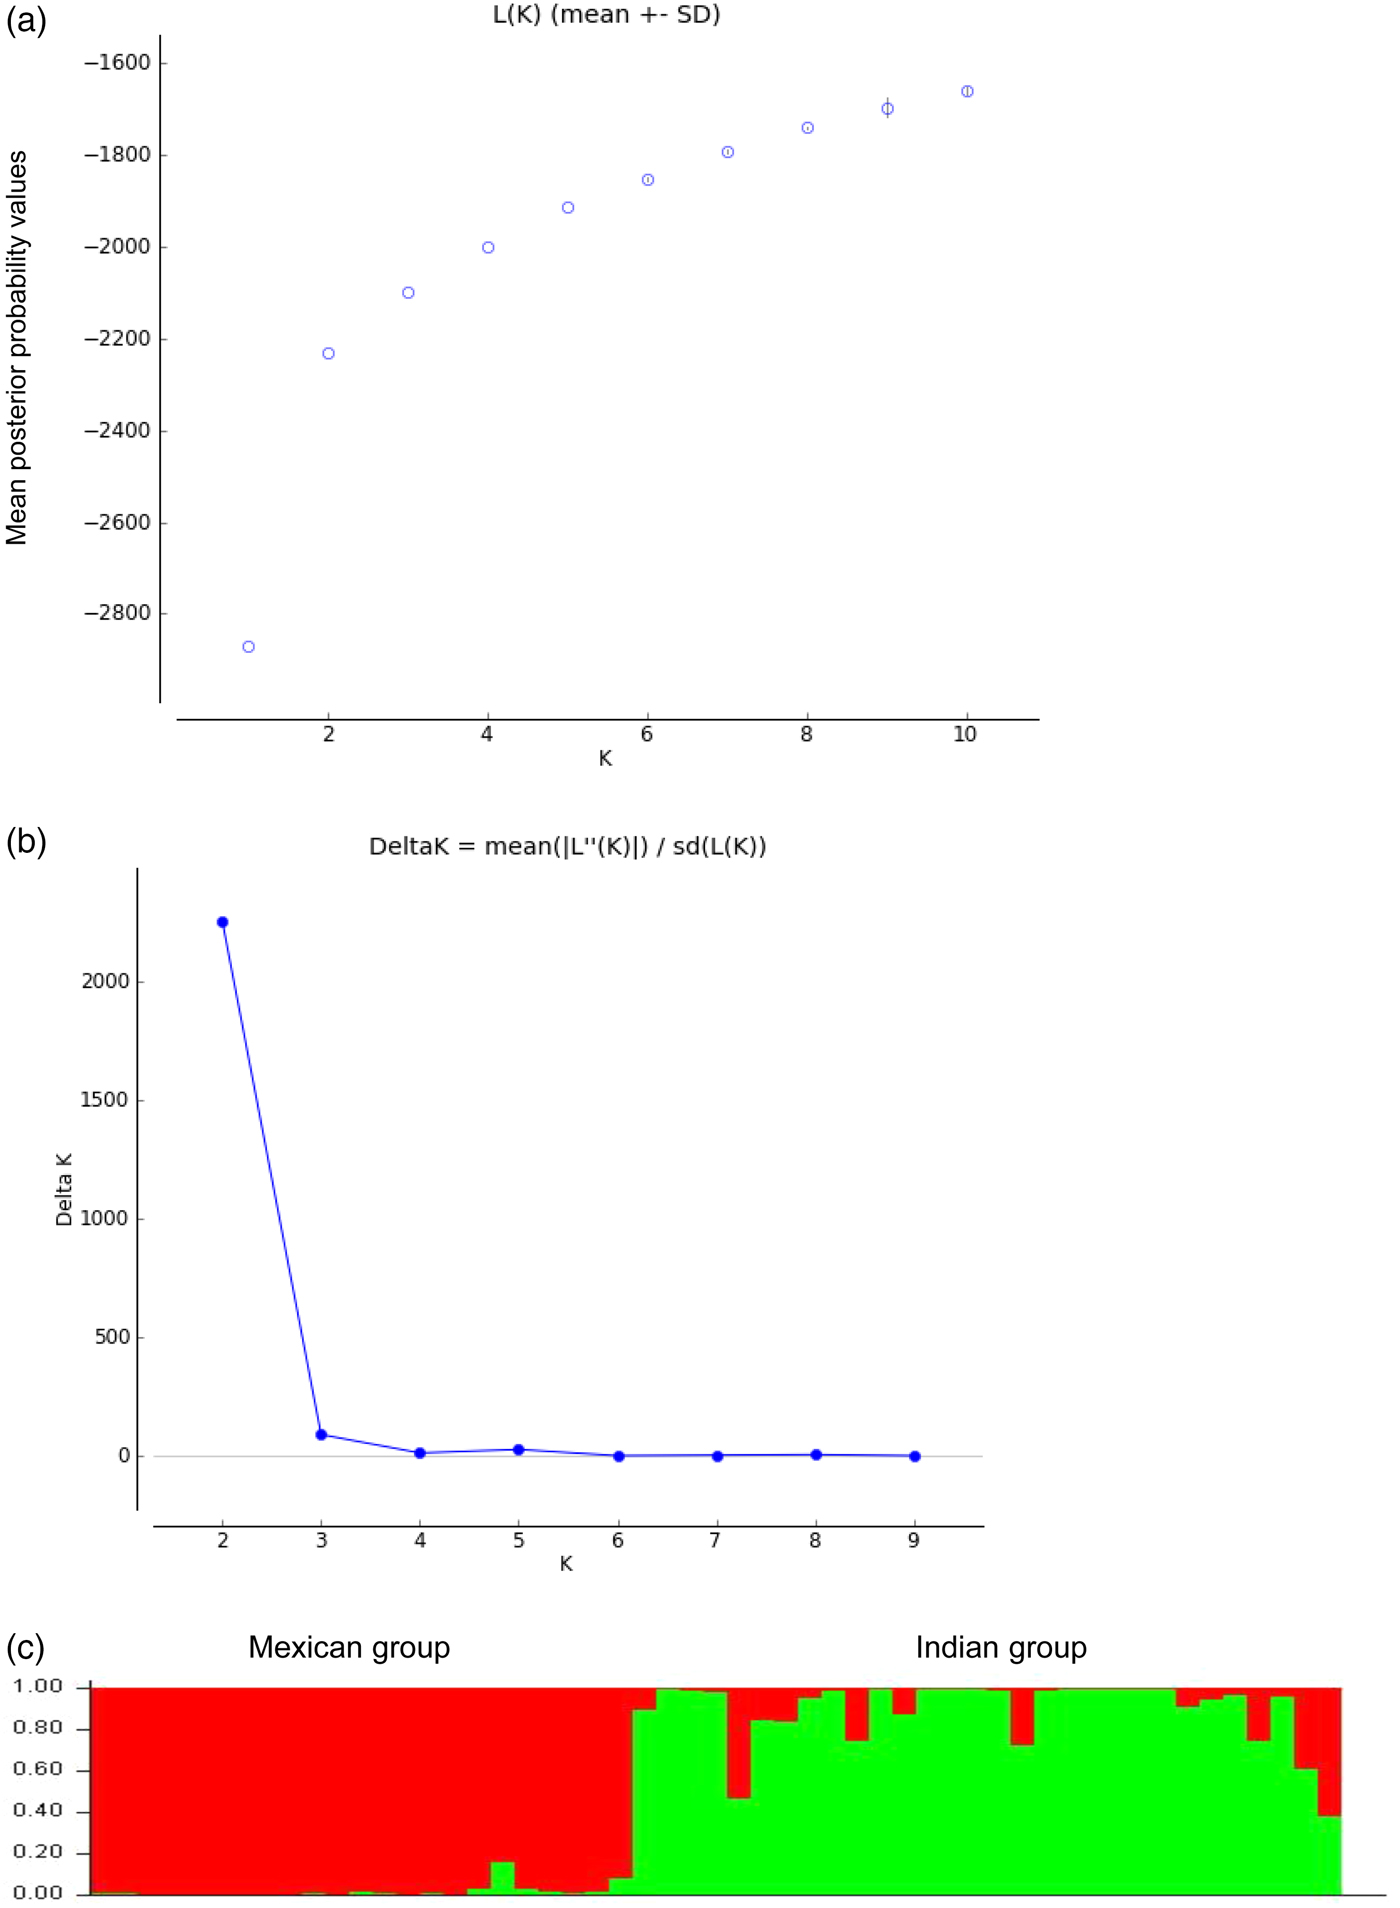
Fig. 2. Number of sub-populations (K) within a collection of 53 safflower cultivars/advanced lines detected in STRUCTURE as per the procedures described by (a) Pritchard et al. (Reference Pritchard, Stephens and Donnelly2000) and (b) Evanno et al. (Reference Evanno, Regnaut and Goudet2005). (c) STRUCTURE Plot showing model-based clustering of safflower cultivars into two distinct groups with a few admixtures.
Analysis of molecular variance
Partitioning of variation through hierarchical AMOVA showed that about 40% of variation is explained between populations and 60% between individuals within the population. The pairwise Fst estimate between Mexican and Indian groups was 0.40.
Agronomic performance of Mexican genotypes
To check for variance homogeneity in ANOVA test, the residuals were plotted against the predicted values. This produced a band of nearly constant width centred near zero over the whole range of fitted values with no patterns for all traits in all trials. The histogram of residuals represented an approximate normal distribution. In the QQ-plot the points fell nearly on a straight diagonal line from bottom left to top right.
In ANOVA, genotypic effects were significant (at 5% probability level) for days to 50% flowering and maturity at all three locations, for seed yield per plant at Indore and Parbhani, and for oil content only at Hyderabad (Table 3). Days to 50% flowering of the Mexican genotypes ranged from 87 to 97 at Hyderabad, from 118 to 121 at Indore and from 98 to 101 at Parbhani, while the check NARI-57 recorded days to 50% flowering of 88 at Hyderabad, 119 at Indore and 101 at Parbhani. Days to maturity of the Mexican genotypes ranged from 129 to 137 at Hyderabad, from 149 to 152 at Indore and from 136 to 140 at Parbhani, while the check NARI-57 recorded days to maturity of 133 at Hyderabad, 149 at Indore and 139 at Parbhani. The seed yield per plant of the Mexican genotypes ranged from 4.4 to 15.5 g at Hyderabad, from 9.7 to 25 g at Indore and from 12.5 to 16 g at Parbhani. The oil content of the Mexican genotypes ranged from 35.9 to 40% at Hyderabad, from 37 to 38.9% at Indore and from 36.3 to 38.5% at Parbhani, while the check NARI-57 recorded the oil content of 39% at Hyderabad, 38% at Indore and 37% at Parbhani.
Table 3. Agronomic performance of Mexican safflower genotypes at major safflower breeding centres in India
NS indicates non-significant.
*indicates significance at 5% probability level.
**indicates significance at 1% probability level.
Genotypic effects on the fatty acid composition were very large in ANOVA (Table 4). The Mexican genotypes RC-1002-L, RC-1033-L and Ciano-Lin recorded high linoleic acid content (range 75–79%) and Quilantan-97, Ciano-OL, CC-1469, CCC-B2 and CCC-B4 recorded high oleic acid content (range 73–79%). The Indian popular varieties A-1, Bhima and NARI-57 recorded high linoleic acid content (76%). Palmitic acid content ranged from 4.4 to 6.7% in the Mexican genotypes and from 5.6 to 7.6% in the Indian varieties. Stearic acid content was the lowest, which ranged from 1.8 to 2.6% in the Mexican genotypes and from 2.4 to 3.1% in the Indian varieties. Data on fatty acid composition are presented in Table 4.
Table 4. Fatty acid composition of Mexican safflower genotypes in an evaluation trial at Hyderabad, India
**indicates significance at 1% probability level.
Discussion
In this study, genetic distinctiveness between safflower cultivar groups of India and Mexico was established using SSR markers. The cultivar groups represented a set of 53 genotypes comprising released varieties, hybrids and advanced lines developed over 50 years in India and Mexico, which are the major safflower breeding countries in the world. Genetic diversity in worldwide collection of cultivated safflower germplasm has been extensively investigated using molecular markers (Johnson et al., Reference Johnson, Kisha and Evans2007; Yang et al., Reference Yang, Wu, Zheng, Chen, Liu and Huang2007; Khan et al., Reference Khan, Witzke-Ehbrecht, Maass and Becker2009; Sehgal et al., Reference Sehgal, Rajpal, Raina, Sasanuma and Sasakuma2009; Derakhshan et al., Reference Derakhshan, Majidi, Sharafi and Mirlohi2014; Lee et al., Reference Lee, Sung, Lee, Chung, Yi, Kim and Lee2014; Pearl and Burke, Reference Pearl and Burke2014; Kumar et al., Reference Ambreen, Kumar, Variath, Joshi, Bali, Agarwal, Kumar, Jagannath and Goel2015). However, studies on genetic characterization of safflower cultivars from different countries are very limited. Sehgal and Raina (Reference Sehgal and Raina2005) analysed the efficiency of multi-locus randomly amplified polymorphic DNA (RAPD), inter-SSR and amplified fragment length polymorphic (AFLP) markers for their ability to discriminate safflower varieties and found that AFLP markers had more discriminative power. However, SSRs are considered highly informative and discriminative markers for the characterization of plant genetic diversity due to desirable properties: abundance, locus specific, multi-allelic and codominant nature. For instance, Powell et al. (Reference Powell, Morgante, Andre, Hanafey, Vogel, Tingey and Rafalski1996) reported that SSR markers revealed highest He in soybean germplasm when compared with restriction fragment length polymorphic (RFLP), RAPD and AFLP markers. Use of SSR markers to map genetic diversity in safflower has become feasible with the availability of extensive information on SSR markers (Chapman et al., Reference Chapman, Hvala, Strever, Matvienko, Kozik, Michelmore, Tang, Knapp and Burke2009; Mayerhofer et al., Reference Mayerhofer, Archibald, Bowles and Good2010; Hamdan et al., Reference Hamdan, Garcia-Moreno, Redondo-Nevado, Velasco and Perez-Vich2011; Yamini et al., Reference Yamini, Ramesh, Naresh, Rajendrakumar, Anjani and Dinesh Kumar2013; Lee et al., Reference Lee, Sung, Lee, Chung, Yi, Kim and Lee2014; Ambreen et al., Reference Ambreen, Kumar, Variath, Joshi, Bali, Agarwal, Kumar, Jagannath and Goel2015). For the first time, Pearl and Burke (Reference Pearl and Burke2014) have used single nucleotide polymorphism (SNPs) markers to characterize genetic diversity in a worldwide collection of safflower germplasm, which included 25 commercial varieties from North America.
The estimates of N A (mean range 2.6–3.2), H e (0.37–0.42) and PIC (0.32–0.36) of SSR loci across safflower cultivar groups of India and Mexico suggested low SSR allelic diversity within each cultivar collection. However, the total cultivar group showed a slight increase in N A, H e and PIC than the respective country groups suggesting that both the cultivar groups have preserved specific alleles. The SSR markers have long been used to analyse the extent of diversity within the crop varietal collections. Roussel et al. (Reference Roussel, Leisova, Exbrayat, Stehno and Balfourier2005) found that the SSR allelic diversity in the European wheat varieties released over a period of 160 years (1840–2000) reflected the time and place of their development. Choudhary et al. (Reference Choudhary, Ranjitkumar, Surapaneni, Deborah, Vipparla, Anuradha, Siddiq and Vemireddy2013) compared the diversity of major Indian rice varieties released at different time periods using SSR markers and found that recently released varieties were more diverse than the older ones. In contrast, Wu et al. (Reference Wu, Yang, Liu, Tao, Mei and Zhao2014) reported that genetic diversity of improved sesame varieties was lower than landraces.
The current study provided an opportunity to compare genetic diversity levels between a cultivar collection and a regional core germplasm collection in safflower. In our previous study (Usha Kiran et al., Reference Usha Kiran, Mukta, Kadirvel, Alivelu, Senthilvel, Kishore and Varaprasad2015), we examined the genetic diversity in a sub-core collection (148 accessions) of Indian safflower germplasm (N A 3.6, H e 0.31, PIC 0.28) based on a set of 44 SSR loci. In this study, using 38 loci of the same set, slightly higher level of genetic diversity (H e 0.42 and PIC 0.36) was detected in the cultivar collection of India and Mexico but with little decrease in N A (3.2). More alleles could be detected in the sub-core collection probably due to larger sample size. Overall, it appears that genetic diversity in the safflower cultivar collection does not strikingly differ from the germplasm collections. Narrow range of N A, H e and PIC estimates from different germplasm collections using SSRs: 2.8–3.81, 0.31–0.39, 0.30–0.33, respectively (Hamdan et al., Reference Hamdan, Garcia-Moreno, Redondo-Nevado, Velasco and Perez-Vich2011; Barati and Arzani, Reference Barati and Arzani2012; Derakhshan et al., Reference Derakhshan, Majidi, Sharafi and Mirlohi2014; Lee et al., Reference Lee, Sung, Lee, Chung, Yi, Kim and Lee2014) and H e (0.256) using SNPs (Pearl and Burke, Reference Pearl and Burke2014) indicate a similar trend.
Low genetic diversity estimates in safflower cultivar groups could perhaps be due to choice of SSRs, which were derived from conserved EST sequences. Mayerhofer et al. (Reference Mayerhofer, Archibald, Bowles and Good2010) reported that these EST-SSRs were less polymorphic than genomic SSRs. However, it seems difficult to associate EST-SSRs with low genetic diversity in safflower because Hamdan et al. (Reference Hamdan, Garcia-Moreno, Redondo-Nevado, Velasco and Perez-Vich2011) and Lee et al. (Reference Lee, Sung, Lee, Chung, Yi, Kim and Lee2014) reported low diversity estimates using genomic SSRs. Furthermore, it is important to note that type, length and position of SSRs are some of the factors that would affect SSR diversity in populations. Perfect and compound SSRs tend to reveal different pattern of genetic diversity due to differences in their evolutionary process. A longer repeat is expected to be highly polymorphic due to more chances of mutability. The SSRs located in the centromeric region would be less polymorphic due to recombination suppression (Li et al., Reference Li, Fahima, Korol, Peng, Röder, Kirzhner, Beiles and Nevo2000). The SSRs analysed in this study were predominantly of perfect dinucleotide repeat type with the repeat length ranging from 7 to 25 (online Supplementary Table S1). Comparisons of the repeat length and number of alleles at different SSR loci indicated no relationship between them. For instance, the SSR locus ct-381 with the repeat length of (AG)14 had maximum of ten alleles, while ct-047 with the repeat length of (GA)25 had five alleles and ct-520 with the repeat length of (AG)24 had only two alleles. Overall, average number of alleles was 3 and 3.4 for perfect and compound SSRs, respectively. Similar results suggesting inconsistency of the relationship between repeat length and the amount of expected diversity have been reported in other studies as well (Plaschke et al., Reference Plaschke, Ganal and Röder1995). The SSRs used in this study have been genetically mapped (Mayerhofer et al., Reference Mayerhofer, Archibald, Bowles and Good2010) but their position and distance from the centromere is not available; therefore, it was not possible to verify if centromeric suppression could have caused low SSR diversity. Though choice of SSRs could influence genetic diversity estimates, narrow genetic base of the breeding programmes cannot be ruled out. However, Fu (Reference Fu2015) cautions that such conclusion would be risky unless a thorough study is made with careful sampling of the cultivars and high-throughput genome-wide markers.
Though SSR allelic diversity was low within Indian and Mexican safflower cultivar groups, clear distinction between them emerged from the genetic distance-based cluster analysis (NJ tree) with the exception of four Indian varieties: NARI-6, JSI-99, RVS-113 and NARI-57 (Indian group-II) (Fig. 1). Genetic relationships revealed by SSR markers showed congruence with the pedigree information of the cultivars suggesting the usefulness of the clusters. Within Indian group, NJ tree revealed strong genetic similarity of A-1 with A-300 (86% bootstrap support) and JSI-73 with JSI-7 (52% bootstrap support), which clearly reflected their pedigree. The highly popular spiny variety A-1 was developed by pedigree method of selection from the cross between A-482-1 x A-300 (Sehgal and Raina, Reference Sehgal and Raina2005). The spineless variety JSI-73 was developed by pedigree method of selection from the cross involving JSI-7 (Saxena et al., Reference Saxena, Singh, Deshpande, Choudhari, Knights and Potter2008). Similarly, within Mexican group, strong similarity of RC-1002-L with RC-1005-L (100% bootstrap support) and Ciano-Lin with RC-1033-L (98% bootstrap support) was observed, which is also supported by pedigree information. Ciano-Lin has been derived from the crosses involving RC Original (Borbón-Gracia et al., Reference Borbón-Gracia, Ochoa-Espinoza, Montoya-Coronado, Márquez and Camarena2011). However, no clear pattern of classification of Indian safflower cultivars was found according to the location of their origin, which suggested that the breeding centres shared a common source of germplasm and parental lines. This is expected because the Indian safflower breeding is highly networked through its coordinated research programmes on safflower since 1972 (DOR, 2006). The Indian varieties from Phaltan centre: NARI-6 and NARI-57 and Indore centre: JSI-99 and RVS-113 clustered separately but were not distinct enough from the Indian group-I and the Mexican group of cultivars as indicated by low bootstrap support, which suggested that breeding of these varieties involved exotic germplasm sources. For instance, NARI-57, a high oil variety has been derived from the cross involving Carmex, which is an American cultivar giving high yield and oil content (41%) (Gonzalez et al., Reference Gonzalez, Schneiter, Riveland and Johnson1994). Similarly, JSI-99, a dwarf and extra early duration variety has been derived from the cross involving a Mexican dwarf germplasm (Saxena et al., Reference Saxena, Singh, Deshpande, Choudhari, Knights and Potter2008). Relative kinship values among cultivar pairs also supported the genetic relationships. None of the Indian cultivars except NARI-57 had higher kinship coefficient (>0.25) with the Mexican varieties suggesting that they are highly unrelated and possibly have unique pedigree. The relative kinship estimates provide useful guidance to group genotypes according to their genetic similarity levels especially when the pedigree information is not available or incomplete.
Model-based STRUCTURE analysis also supported strong genetic structuring between Indian and Mexican safflower cultivar groups as two distinct populations with the exception of a few admixed Indian cultivars NARI-6, NARI-57, NARI-H-23, JSI-99 and RVS-113. High proportion of genetic variance (40%) explained between the populations and the high pairwise F st estimate (0.40) in AMOVA suggested that Indian and Mexican safflower cultivar groups are highly differentiated and the gene flow between them would have been very limited. Therefore, the Mexican safflower varieties could be valuable sources to generate more useful diversity in Indian safflower breeding programmes. The admixed cultivars may carry mixed ancestry involving exotic and indigenous germplasm sources. This is expected because the global safflower germplasm collection of the United States Department of Agriculture (USDA) has been the common source for safflower breeders across the world (Li and Mündel, Reference Li and Mündel1996). Contrary to the cultivar groups, the safflower germplasm collections did not show strong genetic structuring as per the geographical origin (Johnson et al., Reference Johnson, Kisha and Evans2007; Khan et al., Reference Khan, Witzke-Ehbrecht, Maass and Becker2009; Chapman et al., Reference Chapman, Hvala, Strever and Burke2010; Majidi and Zadhoush, Reference Majidi and Zadhoush2014; Usha Kiran et al., Reference Usha Kiran, Mukta, Kadirvel, Alivelu, Senthilvel, Kishore and Varaprasad2015), which suggests that the regional breeding programmes would accumulate unique alleles. This observation is supported by the results of this study that 19% of the SSR alleles were found to be specifically present in the Indian group and 16% were present in the Mexican group.
The results of field evaluation indicated a good agronomic potential of the Mexican safflower varieties for the Indian situations. The flowering duration of the Mexican safflower varieties was similar with the Indian check variety NARI-57 at all three locations. The cultivars reached 50% flowering at about 92 days after sowing at Hyderabad, 100 days at Parbhani and 120 days at Indore. Similarly, the cultivars reached maturity at about 134 days after sowing at Hyderabad, 138 days at Parbhani and 150 days at Indore. Overall, late flowering and maturity of about 2 to 3 weeks was observed at Indore, which corresponded with Sonora. Days to 50% flowering of Ciano-Lin, RC-1005-L, RC-1002-L and RC-1033-L at Sonora were 121, 117, 125 and 121 (Montoya-Coronado, Reference Montoya-Coronado, Knights and Potter2008).
Mean seed yield per plant of the Mexican safflower genotypes was highest at Indore followed by Parbhani and the least at Hyderabad. Large variation in seed yield performance of genotypes among locations indicate severe influence of G × E interactions. Use of RCBD when number of entries exceeded 10 would have been a limitation in this study because maintaining homogeneity conditions within the block in such situations is very difficult. However, RCBD is still considered effective when the number of treatments is up to 20 (Casler, Reference Casler2015). Therefore, the results presented in this study are only indicative and a thorough field evaluation at different locations is warranted to obtain more dependable data on the seed yield performance of the Mexican safflower varieties in India. Interestingly, mean seed oil content (~38%) of the Mexican safflower genotypes did not differ across three Indian locations and was also comparable with the Indian high oil check variety NARI-57 (38%). However, those genotypes were reported to be showing about 3% higher oil content at Sonora. The oil content of Ciano-Lin, RC-1002-L, RC-1005-L and RC-1033-L at Sonora were 41.5, 40.5, 41.9 and 40.8%, respectively (Montoya-Coronado, Reference Montoya-Coronado, Knights and Potter2008). Discrepancies in seed oil content of safflower genotypes across countries have been observed by other researchers as well. For instance, safflower varieties of the USA namely Centennial and Montola-2000 recorded 42.3 and 38.3%, respectively at Sidney, Montana (Armah-Agyeman et al., Reference Armah-Agyeman, Loiland, Karow and Hang2002) while the same varieties recorded 29 and 35.2%, respectively in Turkey (Arslan, Reference Arslan2007). This is expected because the seed oil content in safflower is reported to be a quantitative trait, low heritable (Golkar et al., Reference Golkar, Arzani and Rezaei2011) and influenced by environments (Coşge et al., Reference Coşge, Gürbüz and Kiralan2007; Ashrafi and Razmjoo Reference Ashrafi and Razmjoo2010; Yeilaghi et al., Reference Yeilaghi, Arzani, Ghaderian, Fotovat, Feizi and Pourdad2012). Nevertheless, it is encouraging to note that the oil content of the Mexican genotypes did not vary in three important locations within India but only Indore had the potential for obtaining high seed yield. Contrary to oil content, distinct genetic variation exists for fatty acid composition particularly linoleic acid and oleic acid content in safflower (Fernández-Martinez et al., Reference Fernández-Martinez, del Rio and de Haro1993) and is highly heritable (Golkar et al., Reference Golkar, Arzani and Rezaei2011). The present study also found that fatty acid composition of the Mexican safflower varieties is stable under Indian conditions. High linoleic acid content in Ciano-Lin, RC-1002-L, RC-1005-L and RC-1033-L (75–79%) and high oleic acid content in Ciano-OL (75%) at Hyderabad was highly comparable with the data from Sonora (Montoya-Coronado, Reference Montoya-Coronado, Knights and Potter2008).
Genetic enhancement of safflower for oil yield and quality requires simultaneous improvements in seed yield, oil content and fatty acids. Though the fatty acid content can be easily manipulated in breeding programmes, it might be a great challenge to combine seed yield and oil content to achieve desirable oil yield due to genetic complexities (Rao et al., Reference Rao, Ramachandram and Arunachalam1977; Golkar et al., Reference Golkar, Arzani and Rezaei2011). Therefore, it would be essential to know the combining ability of the high oil genotypes with the high seed yielding cultivars to exploit them in breeding programmes to improve oil yield potential (Golkar et al., Reference Golkar, Arzani and Rezaei2011).
Breaking the low productivity and profitability scenario of the safflower cultivation in India would warrant diverse strategies including broadening the genetic base of the breeding programmes. Concerted efforts are required to develop safflower cultivars with resistance to wilt, Alternaria blight and aphid, tolerance to moisture stress, high oil content (5–8% more than the current levels) and high nutritional quality with increased oleic acid and antioxidants (tocopherol) (Nimbkar, Reference Nimbkar, Knights and Potter2008; Anjani, Reference Anjani, Murthy, Basappa, Varaprasad and Padmavathi2012). Currently, most of the released safflower cultivars in India possess low oil content of about 30% except HUS-305 (~36%) and NARI-57 (~38%) (DOR 2006, 2014). Furthermore, all the Indian safflower cultivars are high linoleic types (~75%). High linoleic (polyunsaturated fatty acid) oil is considered healthy as it reduces blood cholesterol level but its poor shelf life makes it unsuitable for frying purpose. High oleic (monounsaturated fatty acid) oil (~80%) is naturally more stable and is highly preferred by the food industry. Till date, no high oleic safflower cultivar has been released for cultivation in India. The high oil and high oleic safflower varieties and advanced lines of Mexico that are genetically distinct and stable across different locations in India, as reported in this study, could contribute for achieving the breeding goals for development of safflower cultivars with these specific traits in India.
Supplementary material
The supplementary material for this article can be found at http://dx.doi.org/10.1017/S1479262116000186.
Acknowledgements
The authors thank Dr Senthilvel Senapathy, IIOR and Anitha Raman, IRRI for statistical analysis support and critical discussions; Dr Rajesh S. Patil, Plant Breeder, UAS-D for sharing seeds of the safflower varieties developed at Annigeri; Mr. P. Kishore for technical assistance; ICAR for financial support.


