


Introduction
Nutrient levels will influence both yield and fruit quality in tomato production. Uptake and use of potassium, magnesium, calcium and sodium is a complex process that is dependent on environmental factors such as light, temperature, humidity, moisture, soil pH and the levels of other nutrients (Davies et al., Reference Davies, Hobson and McGlasson1981; Adams, Reference Adams, Atherton and Rudich1986). Potassium, magnesium and calcium are essential elements that influence fruit quality traits such as colour, uniformity of ripening, hollow fruit, fruit shape, firmness and acidity (Adams, Reference Adams, Atherton and Rudich1986 and references therein, Hartz et al., Reference Hartz, Johnstone, Francis and Miyao2005).
Potassium is an essential element that helps regulate many metabolic processes (Adams, Reference Adams, Atherton and Rudich1986). Measured as % dry matter in parts of a tomato plant, the highest potassium content was associated with the fruit, while % calcium and magnesium were relatively lowest in the fruit (Kidson et al., Reference Kidson, Watson and Hodgson1953). Fruit titratable acidity, and hence flavour, is dependent on potassium (Davies et al., Reference Davies, Hobson and McGlasson1981). Magnesium is the central atom of a chlorophyll molecule, is involved in phosphate transfer and is an activator for certain enzymatic reactions. Magnesium has not been directly associated with fruit quality except under conditions of severe deficiency, which will reduce the size and overall attractiveness of the fruit (Passam et al., Reference Passam, Karapanos, Bebeli and Savvas2007). Calcium is an important constituent of cell membranes and cell walls. A localized calcium deficiency in the distal end of the fruit can cause blossom end rot, a blackening around the stylar scar (Adams, Reference Adams, Atherton and Rudich1986; Adams, Reference Adams, Savvas and Passam2002). Sufficient calcium levels can help prevent shoulder check crack (Lichter et al., Reference Lichter, Dvir, Fallik, Cohen, Golan, Shemer and Sagi2002; Huang and Snapp, Reference Huang and Snapp2004). Sodium is not an essential nutrient although in some tomato genotypes it can serve to compensate for potassium deficiency (Walker et al., Reference Walker, Cerdá and Martínez2000).
Micronutrients and minerals provided by fruits and vegetables are important to human health and nutrition. A survey of 13 essential elements in 20 diverse human diets showed that on average, sodium was consumed at the highest levels, followed by potassium, calcium and magnesium (Mir-Marqués et al., Reference Mir-Marqués, Cervera and de la Guardia2016). Many physiological and pathological processes in the body are dependent and influenced by electrolytes such as sodium and potassium (Pohl et al., Reference Pohl, Wheeler and Murray2013). Blood pressure and cardiovascular health are closely connected to sodium, potassium, calcium and magnesium intake (Karppanen et al., Reference Karppanen, Karppanen and Mervaala2005). Tomatoes serve as a major source of nutrients in human diets because they are widely cultivated and consumed in many forms (e.g. fresh, canned, sundried, paste, sauce, juice and soup).
A better understanding of the genetic diversity of mineral concentrations in tomato cultivars will help breeders to improve their content to benefit human health and plant health (Stommel, Reference Stommel, Razdan and Matoo2007; Capel et al., Reference Capel, Yuste-Lisbona, López-Casado, Angosto, Heredia, Cuartero, Fernández-Muñoz, Lozano and Capel2017). The objectives of this study were to (i) characterize a diverse set of 52 USA commercially important tomato varieties for their macro-element content (K+, Ca2+, Mg2+, Na+) using replicated trials across two environments; (ii) gain insight regarding the interrelationships among K+, Ca2+, Mg2+ and Na+ concentrations; and (iii) identify those varieties useful for developing new cultivars with enhanced macro-element profiles or for exploring the genetic basis controlling the accumulation of macro-elements in tomato fruits.
Materials and methods
Plant materials
Fifty-two phenotypically diverse tomato varieties (Table 1, online Supplementary Table S1) were sampled from the USDA-ARS Plant Genetic Resources Unit (PGRU) germplasm collection. The varieties were commercially important in the USA between the 1930s and 1990s. Seventeen were considered highly unique based on PVP (plant variety protection) certificates (http://www.ars-grin.gov/cgi-bin/npgs/html/pvplist.pl; online Supplementary Table S1) as processing, fresh market or breeding types. The tomatoes were produced in experimental trials in Geneva, NY in 2010 and 2011. Two plots of five plants of each entry were planted in a randomized complete block design. Fully ripe fruits were harvested from random positions on the vines, rinsed with reverse osmosis water and blotted dry. Pieces of one to ten fruits per plot were homogenized in a Waring Commercial blender (model 51BL30 7010*, Torrington, CT) after removing scars and any diseased or damaged tissue. Homogenates were immediately flash-frozen in 15 ml aliquots using liquid nitrogen and a SPEX SamplePrep 2600 Cryo-Station (NJ), stored at −80°C and shipped overnight on dry ice to Albany, CA for analysis. Additional details of field conditions and sample preparation were reported in Breksa et al. (Reference Breksa, Robertson, Labate, King and King2015).
Table 1. Germplasm of 52 varieties of tomato (Solanum lycopersicum) accessions grown in field trials and sampled for fruit cation concentrations
Materials and chemicals
Methanesulfonic acid was obtained from Sigma-Aldrich (St. Louis, MO). Standard solutions used for the cation determinations by HPLC were purchased from Thermo Scientific (Waltham, MA, USA) and Inorganic Ventures (Christiansburg, Virginia). Water was deionized to ≥18.1 MΩ/cm resistance using a Barnstead NANOpure Deionization System (Dubuque, IA). Water was further filtered through a 0.45 µm-type HA membrane filter (Millipore, Billerica, MA) prior to use.
Determination of cation concentrations
Cryopreserved tomato homogenates were thawed in a 20°C water bath for 30 min and then transferred to centrifuge tubes to be clarified by centrifugation at 38,729 g (4°C) for 10 min using a Sorvall RC 5 Plus centrifuge (Thermo Scientific, Waltham, MA, USA). The clarified liquid was collected and filtered through a 0.2 µm Nalgene syringe filter (Thermo Fisher Scientific, Fair Lawn, NJ) and used for ion chromatography (IC) analysis. The filtered solution was diluted 2× with water prior to IC analysis.
The HPLC system consisted of a Paradigm MS-4 pump (Michrom Bioresources, Inc., Auburn, CA) and HP 1050 Series Autosampler (Agilent, Foster City, CA). The separation of cations was performed using a Dionex IonPac CS12A column (250 × 2 mm2) and a guard column of the same material maintaining at 40°C, with an isocratic mobile phase of 18 mM methanesulfonic acid. The eluant was directed into a Dionex CSRS 300 2 mm suppressor (self-regenerating suppressor) to remove the conductive eluant. A Dionex SRC-1 SRS controller controlled the suppressor. A Pharmacia Biotech Conductivity Monitor (GE Health Care Piscataway, NJ) equipped with 0.2 µl conductivity flow cell was used to perform the detection and quantification of the cations. The flow was 0.250 ml/min and an injection volume of samples and standards was 2.5 µl. Total runtime for each sample was 20 and 17 min for the standards, blank and controls. The system was controlled using Xcalibur (version 1.4) and an SS-420× A/D converter was used to capture the signal from the conductivity detector. Integration of individual peak areas was done using Xcalibur and quantification was based on external calibration curves of each cation (3.125–1500 mg/l). Values are reported as mg/l ± SD and represent the average of a triplicate analysis with a standard curve.
Statistical analyses
Statistical analyses were performed in SAS ver. 9 (SAS Institute Inc, 2011). To test for significant differences in cation concentration among entries, PROC GLM was used for an analysis of variance (ANOVA) with cation concentration used as the dependent variable (208 observations per cation). Because genotype × environment (G × E) (i.e. entry × year) was non-significant, the G × E term was pooled with the error term for significance testing to improve statistical power. Differences between environments were tested using ‘replication within a year’ as the error term.
Principal components analysis (PCA) was used to find the number of components (combinations of variables) that explained as much of the total variance as possible. Correlations (PROC CORR) were performed between the principal components (PCs) and their original variables to illustrate which variables contributed the most to the major PCs. PCA results of 52 entries by two environments were plotted using a 95% prediction ellipse. A prediction ellipse defines a region for predicting a new observation in a population. It also approximates a region containing a specified percentage of the population (SAS Institute Inc, 2011). We used the prediction ellipses to identify potential outliers and to visualize the consistency of an accession's cation profile between the two environments.
Factor analysis (PROC FACTOR) was performed to find the factors, which are combinations of the four cation variables that explained interrelationships among the original variables. Pearson correlation (PROC CORR) was used to test whether two traits varied together for the six possible pairwise comparisons among the four cations.
The STANDARD procedure was used to standardize the four cation variables to mean = 0 and variance = 1 and fast cluster (PROC FASTCLUS) was used to perform cluster analysis of the 52 entries. This method uses an algorithm to assign each observation into one and only one cluster based on distance from the mean. This is a good method to detect outliers (cluster of one). Hierarchical clustering of the 52 entries based on their means was performed using PROC CLUSTER and the average linkage method.
A two-sample t-test assuming unequal variances (Sokal and Rohlf, Reference Sokal and Rohlf1981) was used to test for significant differences between mean concentrations of K+, Ca2+, Mg2+ and Na+ in fresh market versus processing types.
Results
Cation concentrations
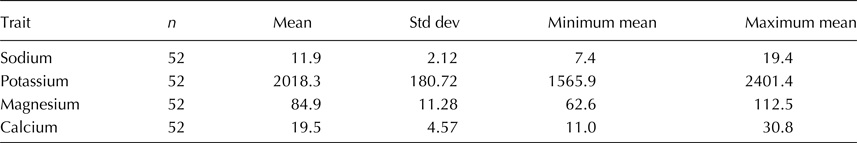
All concentration estimates for the four cations are reported in online Supplementary Table S2. Concentrations of K+ ranged from 1378.4 mg/l (CMVF 232) to 2960.0 mg/l (Walter) in 2010, and from 1337.1 mg/l (Wabash) to 2628.7 mg/l (UC 82B) in 2011. The averages for 2010 (1993.1 ± 305.16 mg/l) and 2011 (2043.5 ± 249.50 mg/l) were not significantly different. Averaged across all four experimental replicates, Wabash (1565.9 ± 180.99 mg/l) and Jubilee (2401.4 ± 290.30 mg/l) were the samples with the lowest and highest K+ concentrations, respectively. Cultivars with the least and greatest variability were Coldset (2.3% CV) and 466 Jung's Improved Wayahead (27.6%CV), respectively.
Mg2+ concentrations were 16–50-fold less than K+ concentrations and ranged from 51.4 mg/l (Vision) to 135.1 mg/l (High Crimson) in 2010, and from 44.7 mg/l (Venus) to 145.1 mg/l (Cherokee) in 2011. The averages for 2010 (87.3 ± 19.33 mg/l) and 2011 (82.42 ± 17.72 mg/l) were not significantly different. Averaged across all four experimental replicates, Baxter's Early (62.6 ± 10.77 mg/l) and Rosa (62.6 ± 9.13 mg/l) were the samples with the lowest Mg2+ concentrations. Sunray (112.5 ± 10.77 mg/l) had the highest average Mg2+ concentration. Cultivars with the least and greatest variability were Colusa (6.0% CV) and Venus (38.7% CV).
Concentrations of Ca2+ ranged from 9.0 mg/l (Horizon) to 47.7 mg/l (H 02990) in 2010, and from 6.9 mg/l (Rosa) to 33.6 mg/l (Sub-artic Maxi) in 2011. The averages for 2010 (19.9 ± 7.37 mg/l) and 2011 (19.0 ± 5.52 mg/l) were not significantly different. Averaged across all four experimental replicates, Tioga (11.0 ± 2.32 mg/l) and H 2990 (30.8 ± 11.36 mg/l) were the samples with the lowest and highest Ca2+ concentrations, respectively. Cultivars with the least and greatest variability were Vendor (5.9% CV) and Manapal (48.6% CV), respectively.
Concentrations of Na+ ranged from 5.2 mg/l (Allure) to 27.7 mg/l (H 1350) in 2010, and from 5.8 mg/l (NC 50-7) to 22.5 mg/l (466 Jung's Improved Wayahead) in 2011. The averages for 2010 (12.4 ± 3.99 mg/l) and 2011 (11.4 ± 2.79 mg/l) were not significantly different. Averaged across all four experimental replicates, NC 50-7 (7.4 ± 1.47 mg/l) and H 1350 (19.4 ± 6.52 mg/l) were the samples with the lowest and highest Na+ concentrations, respectively. Cultivars with the least and greatest variability were Colusa (5.9% CV) and Vision (46.7% CV), respectively.
Calcium was the only cation that showed a significant difference in concentration (df = 28, P < 0.0001) between fresh market (n = 34, mean = 20.9 mg/l) and processing (n = 14, mean = 15.5 mg/l) accessions. However, the ranges of the means were similar for the two groups (11.9–30.6 versus 11.0–24.6, respectively).
Multivariate statistical analyses
The 52 tomato accessions consisted of 14 processing, 34 fresh market or garden types, three lines developed primarily for breeding (888, CMVF 232 and H 2990) and one ornamental type (Allure) (online Supplementary Table S1), although these descriptive categories were not mutually exclusive. Average concentrations of K+, Ca2+, Mg2+ and Na+ varied widely among the 52 tomato accessions (online Supplementary Table S3). ANOVA showed significant differences among accessions for all four traits (df = 51, P < 0.0001–0.0034) and no significant differences between years for any trait (df = 1, P = 0.3432–0.6770).
The first two PCs explained 75.4% of the total variation among the 52 replicated plots (online Supplementary Fig. S1). All four cations were significantly correlated with PC1 (r = 0.57 to 0.83, P < 0.0001) and with PC2 (r = – 0.41–0.61, P < 0.0001) (online Supplementary Fig. S2). The negative r values for K+ and Mg2+ indicated that PC2 was correlated with decreasing levels of those two cations. Of 104 observations, only four (H 2990, Heinz 1350, Hotset and Wabash) fell slightly outside of the 95% prediction ellipse in the PCA plot (online Supplementary Fig. S1). No extreme outliers were observed.
Factor analysis showed a strong interrelationship between K+ and Mg2+ that was independent of Ca2+ and Na+ (Fig. 1). K+ and Mg2+ were highly significantly correlated with each other (r = 0.64, P < 0.0001). No other correlations between pairs of traits were observed.
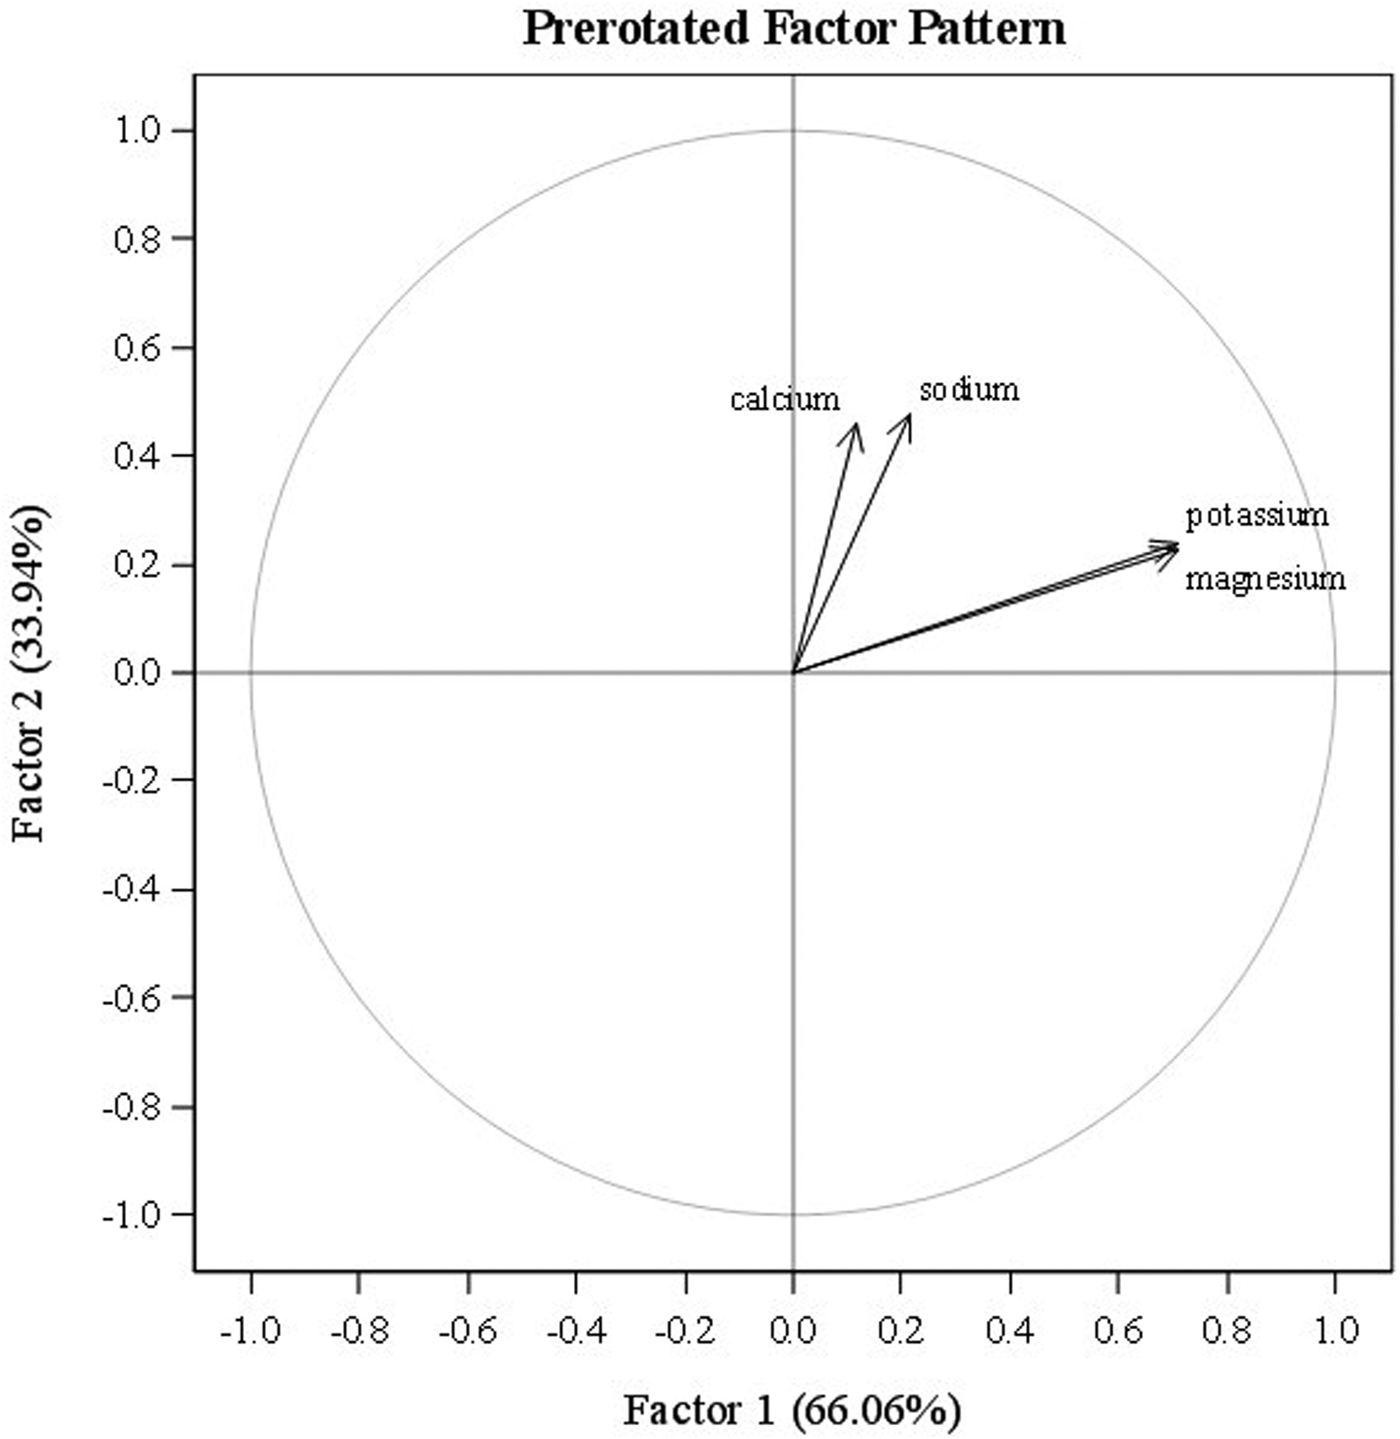
Fig. 1. Factor analysis of four cation traits (sodium, potassium, magnesium and calcium) for 52 tomato accessions grown in replicated plots in two environments (n = 208). Prerotation method: varimax.
Three or four clusters were used in fast cluster analysis to discover whether a priori designated categories (fresh, processing, other) or (fresh, processing, breeding, ornamental) clustered together. Three clusters gave the best separation although the categories did not cleanly separate (Fig. 2). Fresh-consumption types were widely dispersed across the x and y-axes while processing types mostly clustered in the lower left-hand quadrant (Fig. 3). Online Supplementary Fig. S3 showed that when visualized as a hierarchical set of clusters, H 2990, Heinz 1350 and Hotset were most distinct (consistent with the 95% prediction ellipse), but no pattern of fresh-consumption versus processing types was observed.
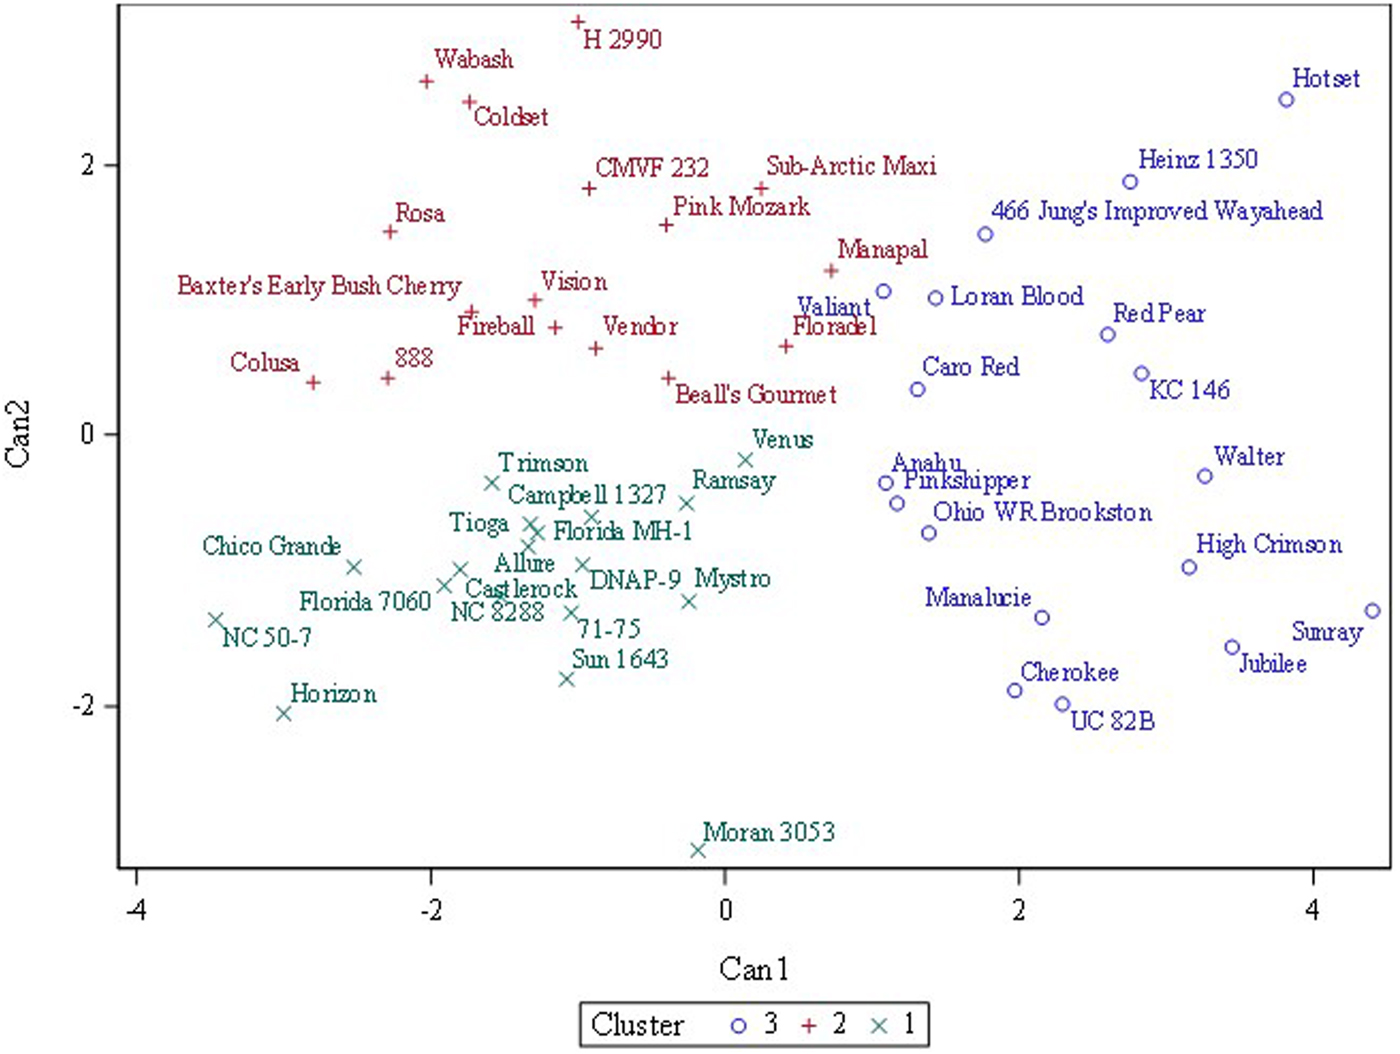
Fig. 2. Fast cluster results for three clusters of 52 tomato accessions grown in replicated plots in two environments (n = 208) based on four cation traits (sodium, potassium, magnesium and calcium). The statistical method identifies initial predefined number of clusters and then applies an iterative algorithm that minimizes the sum of squared distances from the cluster means.
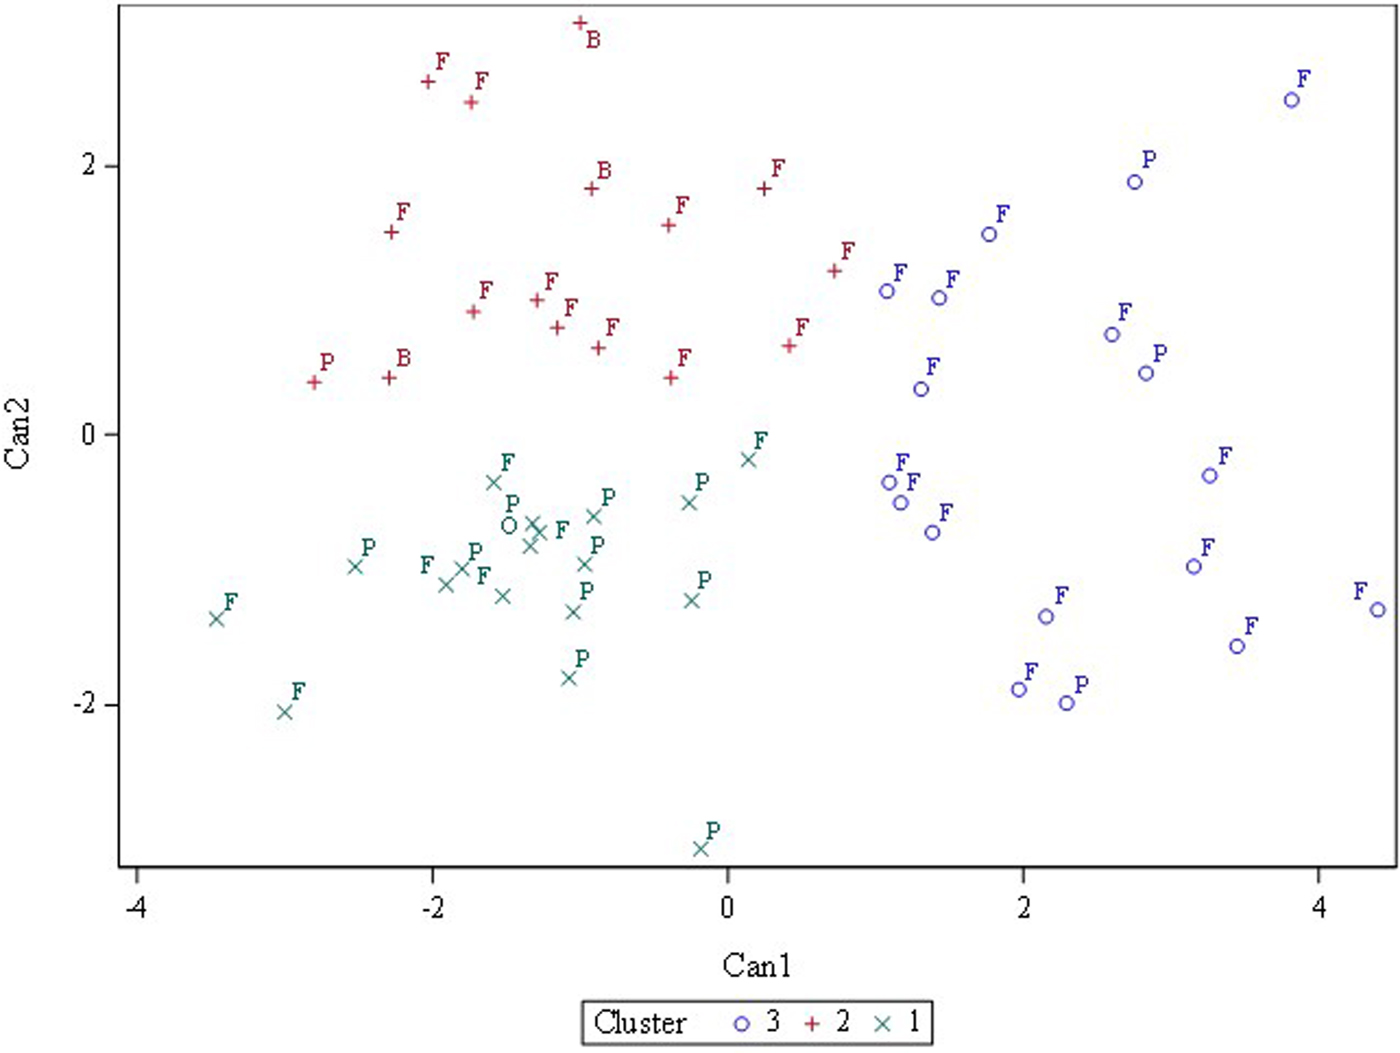
Fig. 3. Fast cluster results for three clusters with accessions labelled based on primary usage: P, processing; F, fresh market; B, breeding; O, ornamental.
Discussion
Vegetable crops are potentially rich sources with which to improve nutritional components of diets, and biochemical profiling of GeneBank collections can support these efforts (Akundabweni et al., Reference Akundabweni, Mulokozi and Maina2010; Kaushik et al., Reference Kaushik, Andújar, Vilanova, Plazas, Gramazio, Herraiz, Brar and Prohens2015; Rahim, Reference Rahim2015). Cations K+, Mg2+, Ca2+ and Na+ were at measureable concentrations in all of the sampled tomato varieties in our study. The difference between the lowest and highest average concentrations of each cation was approximately two- to threefolds (Table 2). K+ was the most abundant cation. Comparisons of ranges of concentrations showed that Mg2+ levels were 3–7% those of K+, and Ca2+ levels were 10–49% those of Mg2+ (Table 2). Overall, Na+ concentrations were slightly more than half the concentration Ca2+ (64% on average, online Supplementary Table S3). Samples with the highest average K+ concentrations did not contain the highest average concentrations of the other three cations.
Table 2. Means, sample sizes, standard deviations, and ranges of each of four cations measured in 52 tomato accessions
Concentrations were measured in mg/l.
Calcium and magnesium are well known as mineral elements that are frequently deficient in human diets (White and Broadley, Reference White and Broadley2009). Calcium was reported to be inadequately supplied for 3.5 billion people globally (Kumssa et al., Reference Kumssa, Joy, Ander, Watts, Young, Walker and Broadley2015). Potassium has also been reported to be grossly deficient due to processing and preparation practices that increase sodium and consequently decrease natural levels of potassium in foods. Daily sodium consumption exceeded recommended amounts in an estimated 99% of the adult population globally (Powles et al., Reference Powles, Fahimi, Micha, Khatibzadeh, Shi, Ezzati, Engell, Lim, Danaei and Mozaffarian2013; Webb et al., Reference Webb, Fahimi, Singh, Khatibzadeh, Micha, Powles and Mozaffarian2017).
In pounds of vegetables consumed on average per capita per year, tomato ranks second in the USA, after potato and followed by onion and lettuce (Economic Research Service/USDA, 2017). Although calcium content in fresh tomato was estimated to be approximately one-quarter of the amounts found in lettuce and onion (Mayer, Reference Mayer1997), the tomato is consumed at greater than fourfold level relative to lettuce or onion (32£ versus 7£ per capita) (Economic Research Service/USDA, 2017). Tomato ranked slightly higher relative to lettuce and onion in magnesium and potassium (Mayer, Reference Mayer1997). Tomato paste and juice are both recognized as rich sources of dietary potassium (Weaver, Reference Weaver2013), and nutrients are concentrated in these processed forms relative to fresh fruit. Compared with two other major solanaceous crops, eggplant and pepper, the tomato was higher in potassium and similar in calcium, magnesium and sodium content (online Supplementary Table S4).
Mineral deficiencies in the human diet are a problem in both developing and industrialized nations. Fruits and vegetables with low mineral contents are aggravating this problem (Sands et al., Reference Sands, Morris, Dratz and Pilgeram2009), and even in situations where consumers are obtaining sufficient caloric intake, they are not in many cases obtaining sufficient minerals. Results from the analysis of historic micronutrient content of foods in the USA (Davis et al., Reference Davis, Epp and Riordan2004) and UK (Mayer, Reference Mayer1997) suggested that nutritional and mineral content of commercial cultivars decreased over the last 60 years. The authors of these reports hypothesized that the apparent decrease may be an unintended consequence of modern agricultural practices (reliance on chemical fertilization and intensive cultivation), as well as breeding programmes directed at improving yield, appearance, and shelf-life, at the cost of other characteristics.
We grouped the cultivars in our study by decade (1940–1990) using their approximate date of release or commercial introduction to see if our results supported a trend in decline in nutrient content over time as was observed in similar studies (Mayer, Reference Mayer1997; Davis et al., Reference Davis, Epp and Riordan2004). We found no relationship between decade and K+, Mg2+, Ca2+ and Na+ content (results not shown). It is possible that a larger sample size is needed to detect a correlation. Alternatively, the results may depend on sample selection (e.g. cultivar, harvest season, location) or analytical methods. This possibility is supported by an investigation of mineral levels in 44 types of Australian fruits and vegetables in which it was reported that no significant differences or changes occurred over time from 1980 and 2000 (Cunningham et al., Reference Cunningham, Milligan and Trevisan2001).
Regardless of measurable trends, there is an opportunity to improve the mineral content of fruits and vegetables through the development of new varieties through breeding or optimized production methods, or a combination of both. Biofortification of fruits and vegetables may be accomplished through breeding targeting higher mineral contents or varieties that uptake minerals placed in the soil with higher efficiency. In an analysis of modern soyabean cultivars, Kusano et al. (Reference Kusano, Baxter, Fukushima, Oikawa, Okazaki, Nakabayashi, Bouvrette, Achard, Jakubowski and Ballam2015) reported that seed mineral profile was a discerning factor for identifying varieties and the environment in which they were grown.
The nutritional content of tomato fruits is influenced by both genotype and environment. An overabundance of other cations will lead to the reduced uptake of more desirable cations. For example, excessive ammonium concentrations were shown to reduce calcium, but not potassium and magnesium contents of tomato fruits (Barker and Ready, Reference Barker and Ready1994), and excessive potassium uptake can reduce calcium and magnesium uptake (Adams, Reference Adams, Atherton and Rudich1986). Sodium can inhibit adequate absorption of potassium and calcium and is generally studied in terms of salt stress and improvement of salt tolerance (Apse and Blumwald, Reference Apse and Blumwald2002; Giuffrida et al., Reference Giuffrida, Martorana and Leonardi2009). Kleiber (Reference Kleiber2014) recently reported increasing levels of manganese resulted in reduced fruit levels of potassium (up to 30% reduction), magnesium (two to threefold decrease) and calcium (three to fourfold decrease). Organic production of tomatoes was associated with the increased content of calcium, magnesium and potassium (Zoran et al., Reference Zoran, Nikolaos, Ljubomir and Pilipavicius2014). However, cultivar was a greater factor than growing conditions when comparing organic versus conventional production methods (Ordóñe-Santos et al., Reference Ordóñe-Santos, Vázque-Odériz and Romer-Rodríguez2011; Zoran et al., Reference Zoran, Nikolaos, Ljubomir and Pilipavicius2014).
Based on all evidence, surveying tomato germplasm for nutrient content is a useful strategy to identify varieties with alleles that markedly alter the relative levels found in fruit. Many tomato QTL or association mapping studies have benefitted from diversity between species, which circumvents the lack of genetic variation within Solanum lycopersicum (e.g. Capel et al., Reference Capel, Yuste-Lisbona, López-Casado, Angosto, Heredia, Cuartero, Fernández-Muñoz, Lozano and Capel2017), however, intraspecific variation can be successfully used if a broad array of genotypes is sampled (Chaïb et al., Reference Chaïb, Lecomte, Buret and Causse2006; Prarthana et al., Reference Prarthana, Prasad and Shivanna2014; Zhang et al., Reference Zhang, Zhao, Liang and Zou2016). In the current study, Wabash, a fresh market type adapted to the Midwestern USA, was very low in K+ relative to the other accessions (online Supplementary Fig. S4). Breeding line H 2990 and fresh market type Hotset were high in Ca2+, and processing type Heinz 1350 was high in Na+ (online Supplementary Fig. S4). Although our study revealed a strong interrelationship between K+ and Mg2+ concentrations, other cultivars in other environments revealed different patterns of relative ratios or correlations among K+, Mg2+, Ca2+ and Na+ (Fernández-Ruiz et al., Reference Fernández-Ruiz, Olives, Cámara, de Cortes Sánchez-Mata and Torija2011; Nour et al., Reference Nour, Trandafir and Ionica2013; Ozturkoglu-Budak and Aksahin, Reference Ozturkoglu-Budak and Aksahin2016; Watanabe et al., Reference Watanabe, Maejima, Yoshimura, Urayama, Yamauchi, Owadano, Okada, Osaki, Kanayama and Shinano2016; Sager, Reference Sager2017). These studies have all shown that nutrient contents fall below concentrations required to easily consume daily recommended levels of fresh fruit. However, the differences among genotypes can serve as a tool with which to study genes and regulatory factors necessary for the development of biofortified cultivars (Watanabe et al., Reference Watanabe, Maejima, Yoshimura, Urayama, Yamauchi, Owadano, Okada, Osaki, Kanayama and Shinano2016; Capel et al., Reference Capel, Yuste-Lisbona, López-Casado, Angosto, Heredia, Cuartero, Fernández-Muñoz, Lozano and Capel2017).
Supplementary material
The supplementary material for this article can be found at https://doi.org/10.1017/S1479262117000417
Acknowledgements
We thank Susan Srmack, William Garman, Jonathan Spencer, Paul Kisly, Teri Balch and Marlene Hidalgo for excellent technical support. USDA is an equal opportunity provider and employer. The use of trade, firm or corporation names in this publication is for the information and convenience of the reader. Such use does not constitute an official endorsement or approval by the US Department of Agriculture or the Agricultural Research Service of any product or service to the exclusion of others that may be suitable.


