Introduction
Yam bean (Pachrhizus spp) belonging to the family Leguminosae, sub family Fabaceae (Papilionaceae), closely related to the subtribes Glycininae and Phaseolinae (Ingham, Reference Ingham1990; Sørensen, Reference Sørensen1996). It is one of the few leguminous crops which produces 0.5–3 kg starchy tubers with a sweet pleasant flavour, with an average yield of 80 t/ha (Juarez and Paredes-López, Reference Juarez and Paredes-López1994). Yam bean seeds are not used due to the presence of the alkaloid rotenone, which is used for insecticides, pesticides and piscicides (Gosálvez, Reference Gosálvez1983).
Before starting the mapping of plant genomes, accurate estimation of nuclear genome sizes are pre-requisites (Arumuganathan and Earle, Reference Arumuganathan and Earle1991). However, there are no data available for the genome size of the yam bean, as well as no data available for genome size variation in the different genotypes of the compatible species or their interspecific hybrids.
Flow cytometry has been successfully applied to characterize the genome size of different legume crops including lupins (Naganowska et al., Reference Naganowska, Wolko, Śliwińska and Kaczmarek2003), soybean (Greilhuber and Obermayer, Reference Greilhuber and Obermayer1997) and Adzuki bean (Kang et al., Reference Kang, Satyawan, Shim, Lee, Lee, Hwang, Kim, Lestari, Laosatit and Kim2015). In this study, nine genotypes were selected from two cultivated species of yam bean (P. erosus and P. tuberosus) to estimate the ploidy, as well as nuclear DNA content and genome size, by using flow cytometry.
Experimental
Nuclei were extracted from young leaf samples of six genotypes of P. erosus and three genotypes of P. tuberosus (Table 1) according to the Galbraith method (Galbraith et al., Reference Galbraith, Harkins, Maddox, Ayres, Sharma and Firoozabady1983). Rice (Oryza sativa, 2n = 2x = 24) cv Nipponbare (2C DNA = 0.91 pg) (Ammiraju et al., Reference Ammiraju, Luo, Goicoechea, Wang, Kudrna, Mueller, Talag, Kim, Sisneros and Blackmon2006) and Mung bean (Vigna radiata, 2n = 2x = 22) cv Berken (2C DNA = 1.05 pg) (Draper et al., Reference Draper, Mur, Jenkins, Ghosh-Biswas, Bablak, Hasterok and Routledge2001) were used as standards. Leaves from each sample and the standards were chopped with a razor blade in a petri dish containing 500 µl cold lysis buffer LB01 (Doležel et al., Reference Doležel, Binarová and Lcretti1989) which comprises 15 mM Tris, 2 mM Na2EDTA, 0.5 mM spermine tetrahydrochloride, 80 mM KCL, 20 mM NaCl and 0.1% (V/V) Triton x-100. The pH was adjusted to 7.5 with 1 N HCl. Fifteen mM β-mercaptoethanol was added. A microcentrifuge tube containing 500 µl sample, RNase (2 µl) and 1.5 ml of propidium iodide (PI) stain solution (1 mg/ml) was incubated in the dark for 1 h before going for flow cytometry analysis. The stained nuclei of samples and standards were run through the flow cytometer (BDFACSCanto II, BD Bioscience San Jose, CA, USA) with an excitation wavelength of 488 nm. PI fluorescence was measured in a 528 nm band pass filter. Five thousand PI cell signals were detected per sample per replicate and PI-fluorescence histograms were used to see the ploidy. Data were analysed and the coefficient of variation (CV%) was calculated using Flow Jo V10.0 software (Tree Star Inc., Ashland, OR, USA).
Table 1. Description of the nine accessions of P. erosus and P. tuberosus with ploidy and genome size

Results and discussion
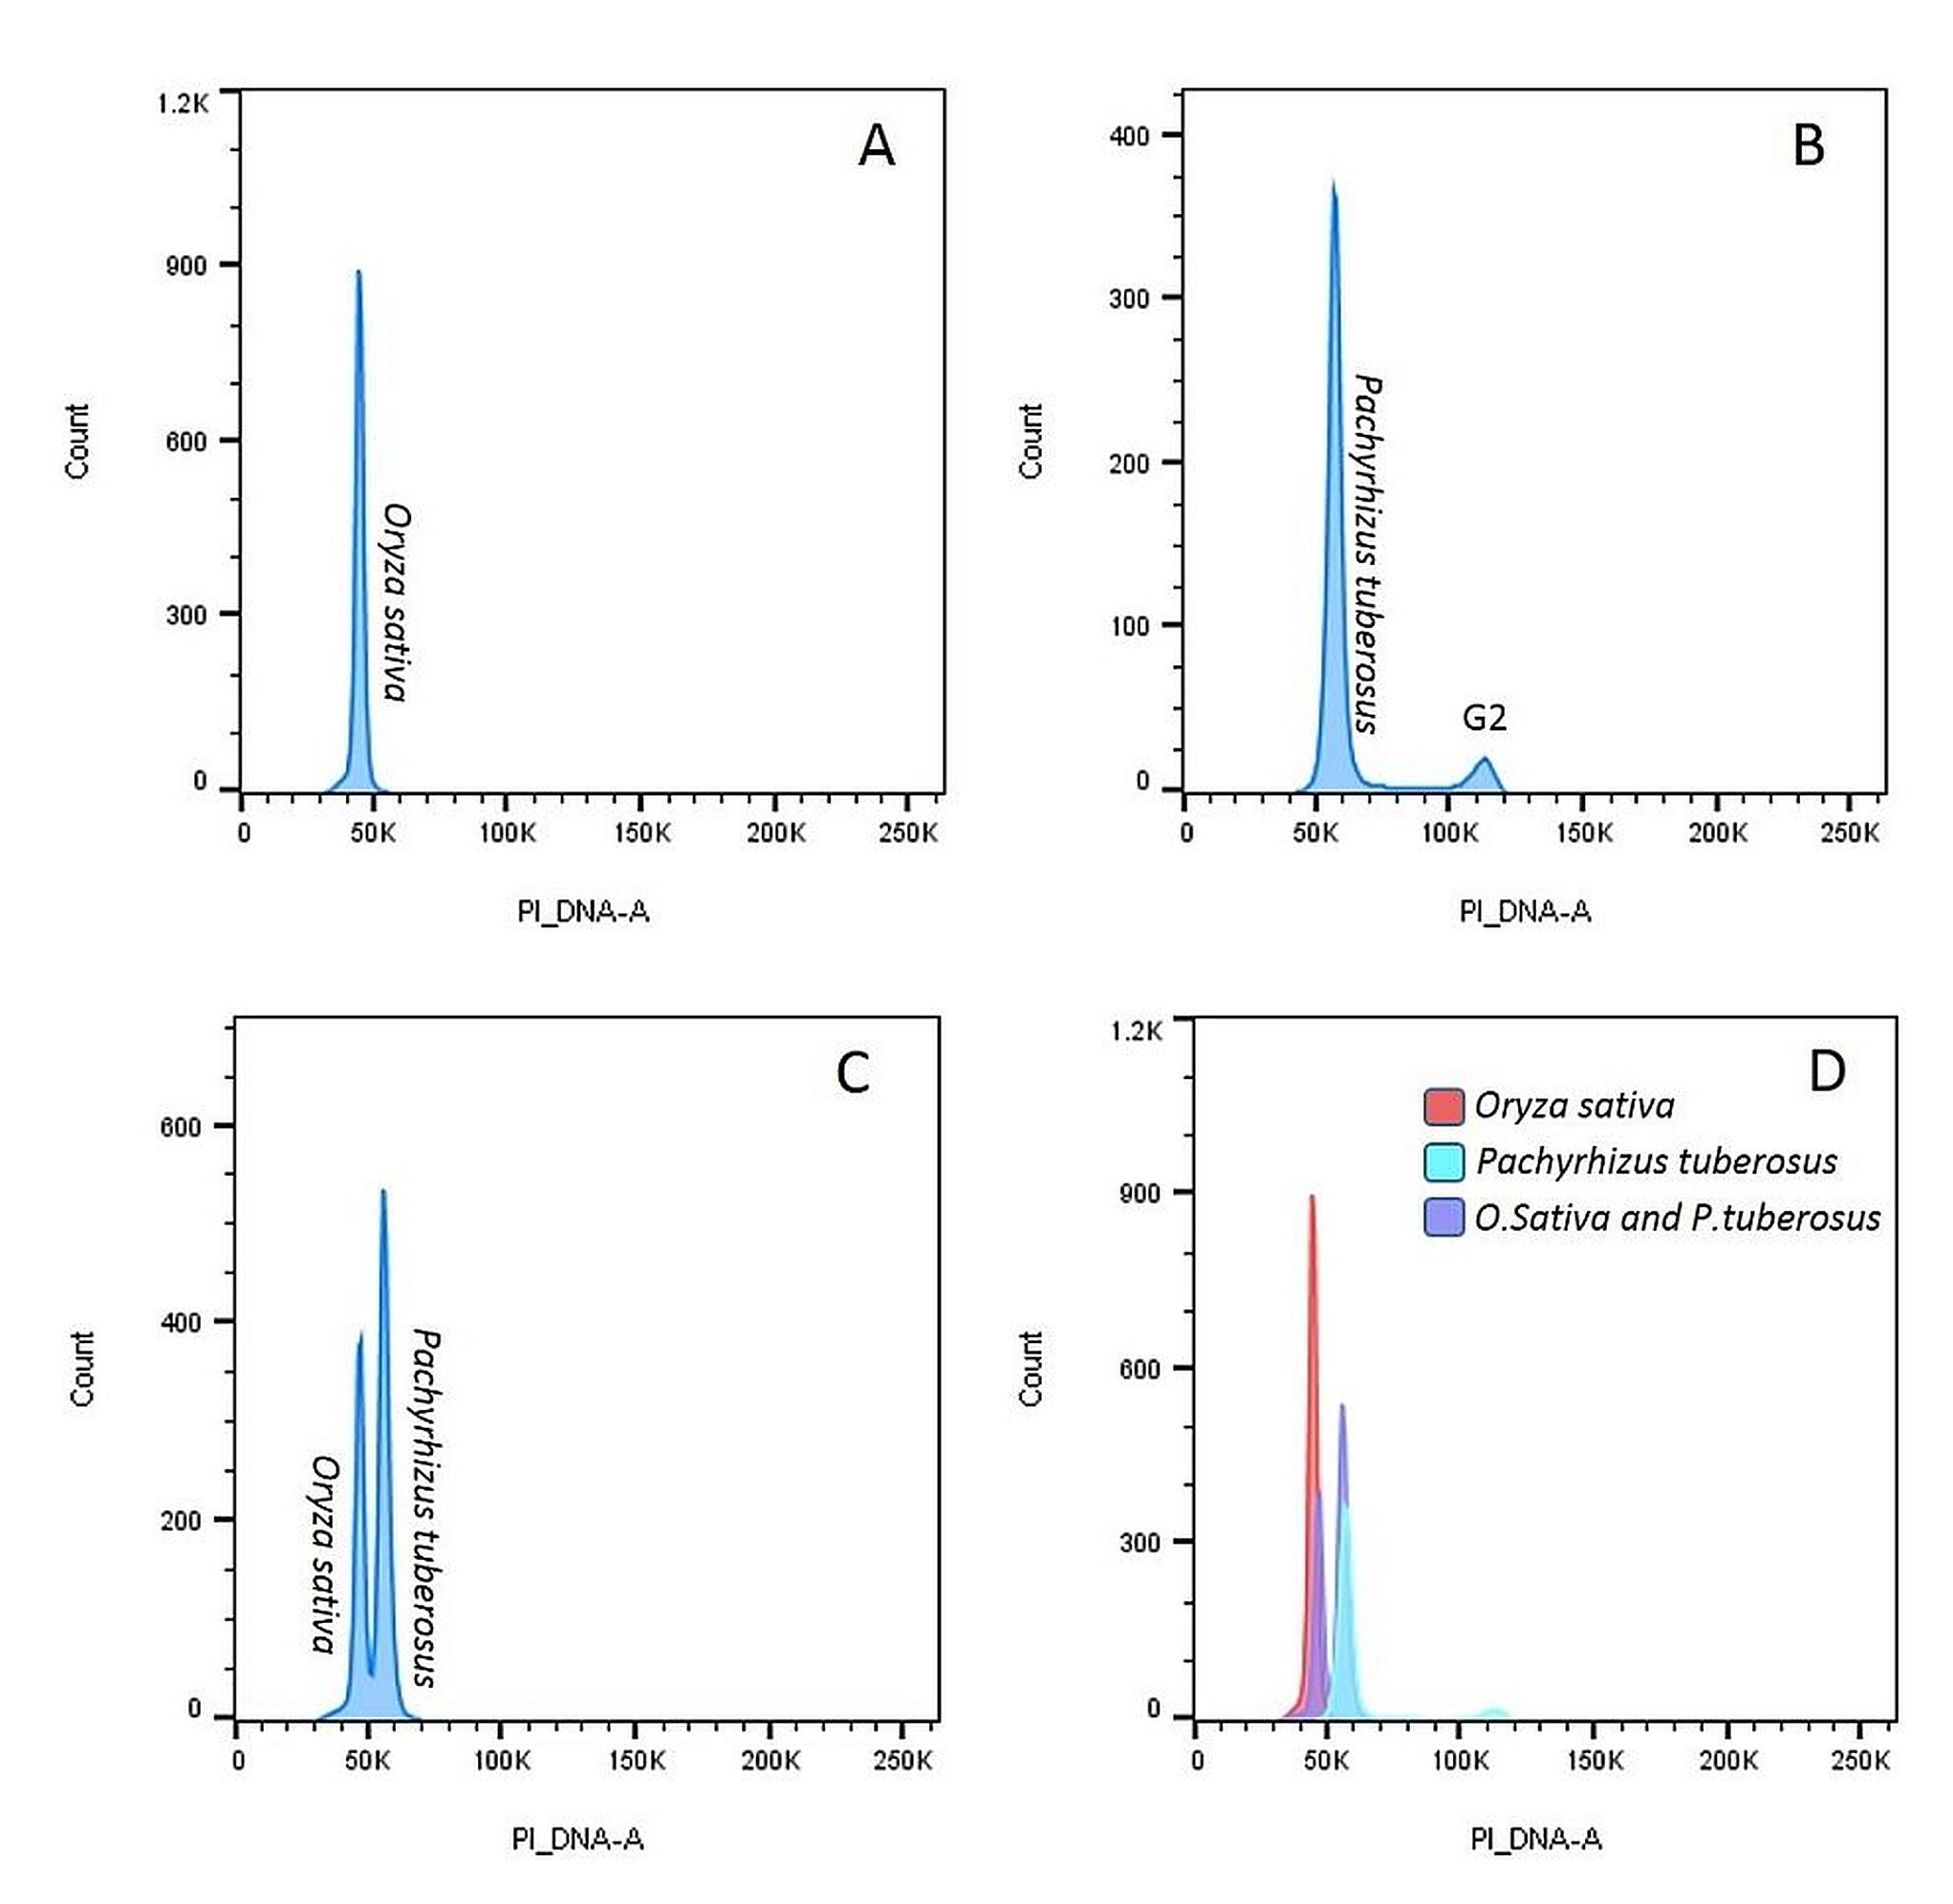
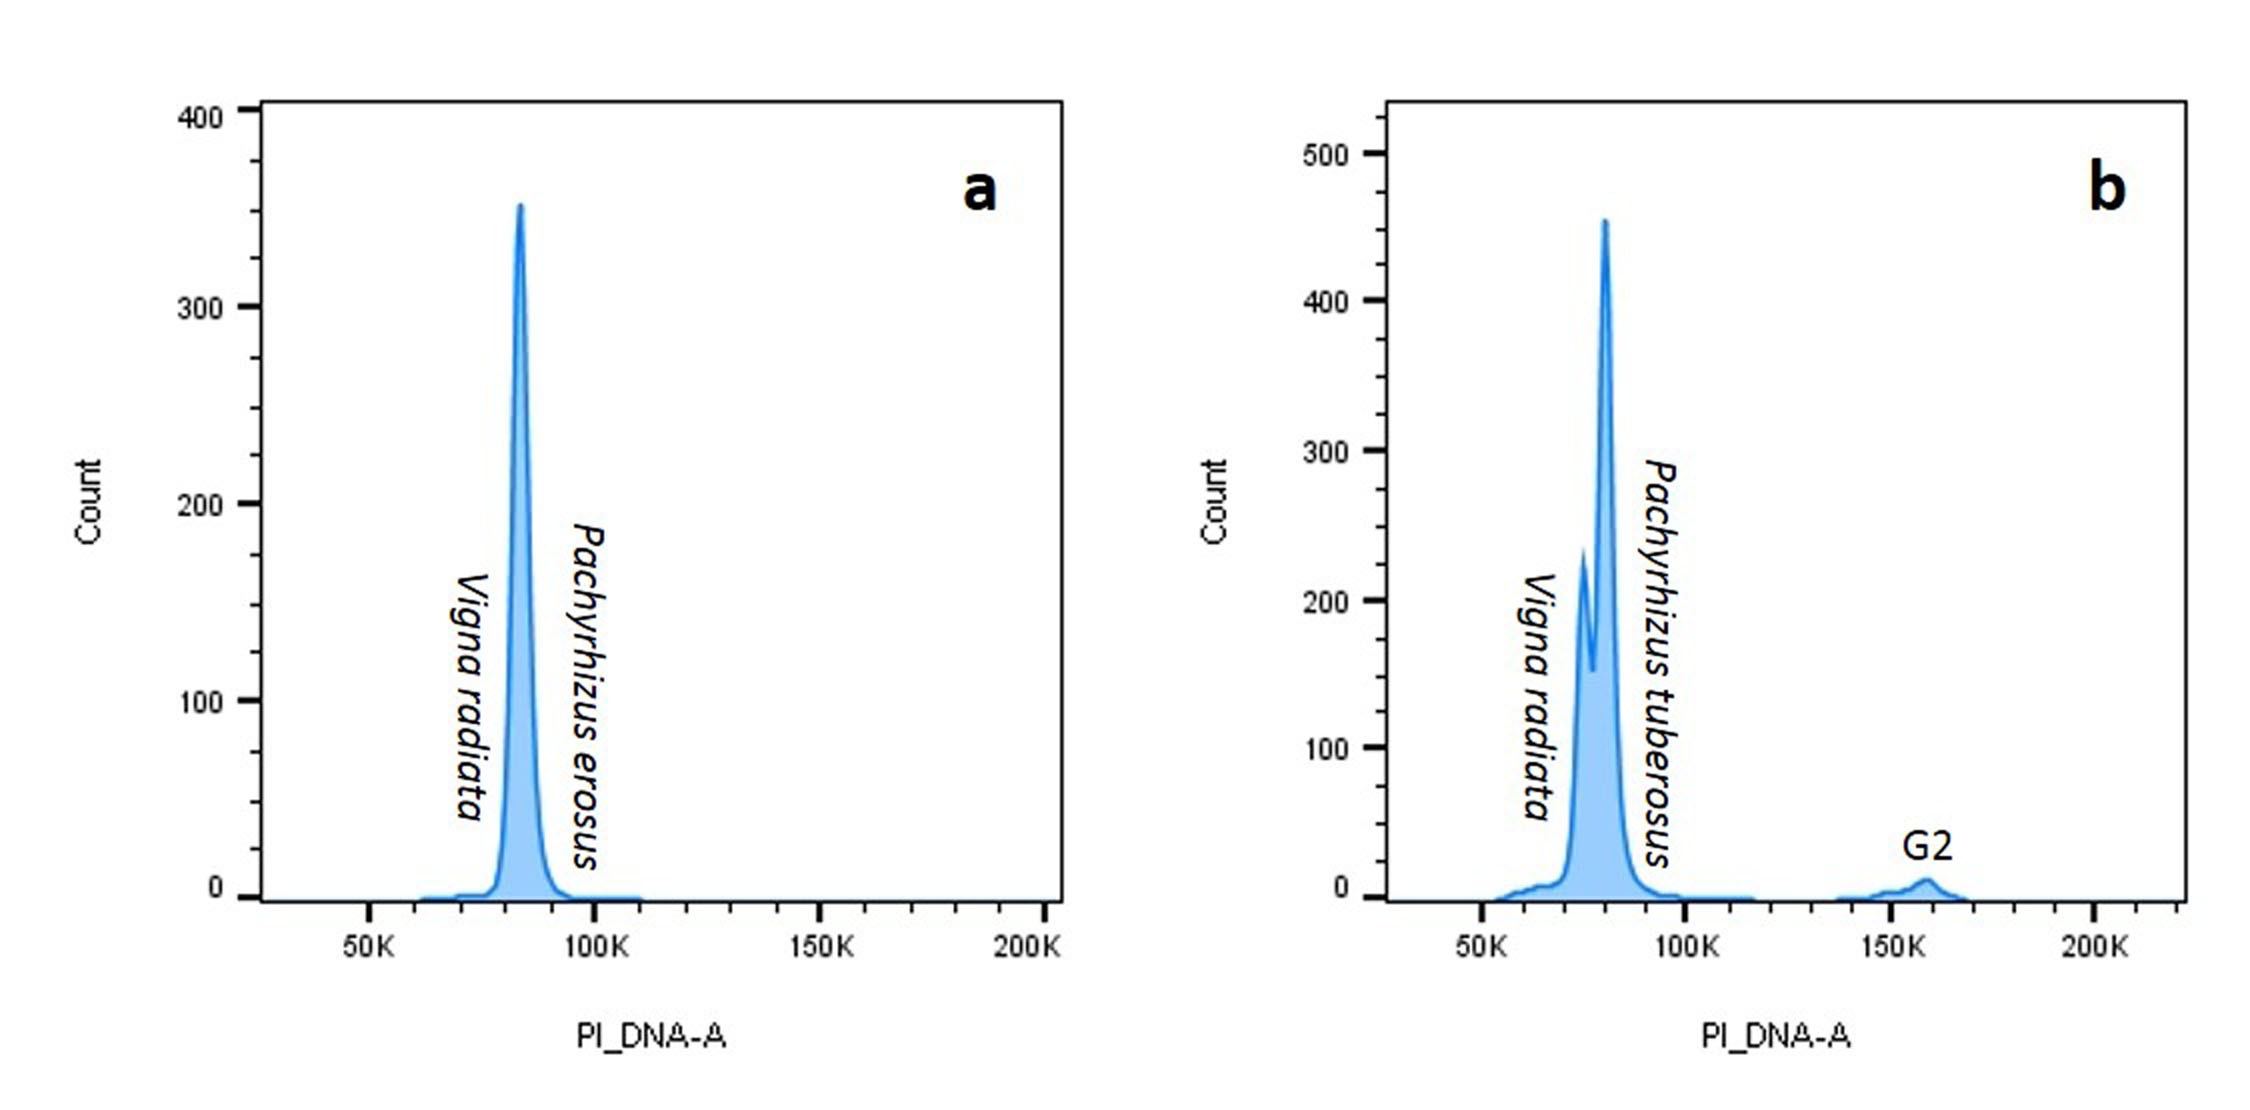
Genome sizes were analysed for six accessions of P. erosus and three accessions of P. tuberosus, using O. sativa cv Nipponbare (2C = 0.91 pg) as an internal reference standard. Data were analysed by visualizing the histogram plot (Fig. 1(c) and online Supplementary Fig. S1) and the genome sizes were calculated by the G1 peak mean of both the sample and internal standard. Lower 2C values were observed in P. tuberosus, ranging from 1.07 (CIP 209015) to 1.09 (CIP209013) pg, than P. erosus which ranged from 1.17 (Jicama-3) to 1.22 (CIP209016 and CIP209051) pg. The genome size ranged from 572 to 597 Mbp in P. erosus and 523 to 533 Mbp in P. tuberosus (Table 1). In comparison with other leguminous crops, the estimated genome size reaches 1115 Mbp in soybean (Schmutz et al., Reference Schmutz, Cannon, Schlueter, Ma, Mitros, Nelson, Hyten, Song, Thelen and Cheng2010), 858 Mbp in pigeonpea (Greilhuber and Obermayer, Reference Greilhuber and Obermayer1998), 612 Mbp in Adzuki bean (Kang et al., Reference Kang, Satyawan, Shim, Lee, Lee, Hwang, Kim, Lestari, Laosatit and Kim2015) and 472 Mbp in Lotus japonica (Sato et al., Reference Sato, Nakamura, Kaneko, Asamizu, Kato, Nakao, Sasamoto, Watanabe, Ono and Kawashima2008). The 2C peaks of the target species should fall in between 2C and 4C peaks of the internal reference standards and the genome size of the target and internal standards should not differ more than fourfold (Suda and Leitch, Reference Suda and Leitch2010). The peak reflects the nuclei isolated from O. sativa cv Nipponbare (Diploid standard) and the peak was positioned at channel number around 50 K (Fig. 1(a)) The G1 peak of cultivated yam bean species P. erosus appeared in a nearby channel to the diploid rice standard, thus P. erosus was estimated as diploid (2x) (Fig. 1(b)). For confirming the results, O. sativa and P. erosus were chopped simultaneously and run in flow cytometry and both the standard and sample appeared in nearby channels, confirming the ploidy of P. erosus is as diploid (2x) (Fig. 1(c)). By using the Flow Jo software, we put co-chopped material results and both standard and sample results all together and it shows the standard and sample histogram positioned in the same histogram of co-chopped sample and standard histogram (Fig. 1(d)) Hence, it is confirmed that ploidy of the yam bean species P. erosus is diploid. We analysed six accessions in P. erosus and found all the accessions were diploid in nature (Table 1). We have analysed ploidy of three accessions of another yam bean species P. tuberosus and found all were diploid (online Supplementary Fig. S1 and Table 1). The results were also confirmed by using another internal standard of the leguminous diploid crop Mung bean (V. radiata) cv Berkenand, the results show that the standard (Mung bean) G1 peak and sample (P. erosus and P. tuberosus) G1 peaks overlapped with each other. Hence, it was confirmed that both the cultivated species of yam bean were diploid (online Supplementary Fig. S2). Genome size cannot be estimated by using Mung bean as internal standard due to overlapping G1 peaks of the sample and standard. A standard with too similar DNA content is not advisable for genome size estimation due to overlapping peaks, but when both standard and sample G1 peaks perfectly overlapped it indicates the same ploidy (Doležel et al., Reference Doležel, Greilhuber and Suda2007). This result was supported by the chromosome number of yam bean 2n = 2x = 22 (Santayana et al., Reference Santayana, Rossel, Núñez, Sørensen, Delêtre, Robles, Fernández, Grüneberg and Heider2014). Flow cytometry is a useful tool to analyse the genome size and ploidy of yam bean. Finally, our findings could be the foundation in the future of yam bean genome sequencing and improvement programme.

Fig. 1. Estimation of Ploidy and Nuclear DNA content in Pachyrhizus erosus using rice (Oryza sativa) cv Nipponbare as standard.
Supplementary material
The supplementary material for this article can be found at https://doi.org/10.1017/S1479262119000170
Acknowledgements
Kalidas Pati was supported by Endeavour Research Fellowship, Australia Awards, Australian Government Department of Education and Training. Also, thanks to the International Potato Centre, Peru for proving the seeds and Centre for Microscopy Characterisation and analysis facility at The University of Western Australia for providing the facility.
Conflict of interest
The authors declare that they have no conflicts of interests.