


Introduction
Wheat is one of the staple food crops contributing significantly to Ethiopian's food security. Wheat is the fourth important crop after tef, maize and sorghum with an area coverage of 13.49 and 13.85% of the arable land under cereal production in the Ethiopia and Tigray region, respectively (CSA, 2017). Its average national and regional (Tigray) productivity for 2016/17 cropping season was 2.68 and 1.98 t/ha, respectively. The area under durum wheat occupancy is, however, not clearly known but estimated to be 1.67 million hectares with an average productivity of 2.54 t/ha. This productivity is in fact low compared to world average productivity, 3.09 t/ha (Statistica, 2017). The lack of improved varieties that adapt well to the actual growing conditions of smallholder wheat producers is the most important contributor to low productivity (Zegeye et al., Reference Zegeye, Taye, Tanner, Verkuijl, Agidie and Mwangi2001; Nelson, Reference Nelson2013).
The climate change induced rise in temperature (Cairns et al., Reference Cairns, Hellin, Sonder, Araus, MacRobert, Thierfelder and Prasanna2013; Challinor et al., Reference Challinor, Koehler, Ramirez-Villegas, Whitfield and Das2016) and inter-annual rainfall variability (Blum and Pñuel, Reference Blum and Pñuel1990) highly affected wheat productivity. Increasing productivity or maintaining the current yield could rely on improving crop adaptation through breeding (Atlin et al., Reference Atlin, Cairns and Biswanath2017). The conventional durum wheat breeding program is less likely to produce farmer preferred varieties particularly in marginal environments and reduce crop biodiversity (Witcombe et al., Reference Witcombe, Joshi, Joshi and Sthapit1996). This approach usually ignores the diverse genetic basis in farmers' varieties (FVs) and hence continuous optimization of quantitatively inherited trait complexes in the base populations could not be established. In addition, the conventional breeding system is less participatory which has reduced the chance of deploying varieties that are better adapted to local conditions and more accepted by farmers (Ceccarelli, Reference Ceccarelli2012). To increase yields in the face of the climate change, deployment of local crop diversities in local breeding programs is urgently needed. This helps to exploit the adaptive potential of local varieties. Previous studies proved that many Ethiopian durum wheat FVs (or landraces) have shown superior performance compared to most improved varieties for various important traits such as grain and straw yields (Mengistu et al., Reference Mengistu, Yosef, Fadda and Pè2018) and disease resistance (Negassa, Reference Negassa1984; Kidane et al., Reference Kidane, Hailemariam, Mengistu, Fadda, Pè and Dell'Acqua2017). They can offer unique opportunities for wheat breeding programs (Mengistu et al., Reference Mengistu, Yosef, Catellani, Frascaroli, Fadda, Pè and Dell'Acqua2016).
Multistage varietal evaluation and selection have been carried out (online Supplementary Fig. S1) since 2011 to identify durum wheat FVs that satisfy farmers’ needs. Farmers' preference traits in wheat, notably developmental plasticity, few productive tillers, quality spike (long and denser spikes), tall height (for large biomass production), drought and disease tolerance and overall yield potential were identified (Mancini et al., Reference Mancini, Kidane, Mengistu, Pè, Fadda and Dell'Acqua2017; Mengistu et al., Reference Mengistu, Yosef, Fadda and Pè2018). Mainstreaming these farmers' preference traits can ensure the profitability of crop production and its demand by the end user farmers. However, such huge genetic variability in Ethiopian durum wheat FVs was not recognized by the national breeding system (Mengistu et al., Reference Mengistu, Yosef, Catellani, Frascaroli, Fadda, Pè and Dell'Acqua2016). This study in particular was conducted with the aim of identifying superior and stable durum wheat varieties for wider and specific adaptation for areas prone to climate change effects. Two of the identified superior FVs were approved and officially released for fulfilling the national variety registry requirements of distinctness, uniformity and stability.
Materials and methods
Germplasm selection
The tested genotypes, both the FVs and improved varieties, were selected from a bulk of 400 genotypes characterized for adaptation and performance in the Tigray region since 2011 (online Supplementary Fig. S1). The general characterization of these materials included in the whole 400 sets was provided in Mengistu et al. (Reference Mengistu, Yosef, Fadda and Pè2018); Mengistu et al. (Reference Mengistu, Yosef, Catellani, Frascaroli, Fadda, Pè and Dell'Acqua2016) and Mancini et al. (Reference Mancini, Kidane, Mengistu, Pè, Fadda and Dell'Acqua2017). During the evaluation and screening trials, these genotypes were ranked based on researcher recorded data and farmers' evaluation (PVS) score data and top 50 performers were picked for further research. The top 31 FVs and five improved maize varieties (IMVs) (online Supplementary Table S1) were constituted for multi-location trials at four wheat growing locations in Tigray, Ethiopia for two consecutive cropping seasons. The characterized genotypes were selected based on their diversity for phenology, yield and yield related traits, farmer preference traits and adaptation to environmental conditions.
Description of test locations
The test locations are deliberately selected to be variable (online Supplementary Fig. S2). Two of the four locations, Melfa in Degua Tembein woreda and Ayba in Emba Alajie woreda, represent the highlands under relatively conducive growing conditions while the remaining two locations, Menkere in Ofla woreda and Mekelle university research station (MU) in Enderta woreda, represent marginal growing environments for wheat production due to frequent exposure to terminal drought. Melfa is located at 13.39°N latitude, 28.41°E longitude and elevation of 2580 m above sea level (masl). Its soil type is clay loam with a rooting depth of less than one meter. The second location Ayba is located at 12.89°N latitude, 39.54°N longitude and elevation of 2730 masl. The soil type of this location is deep clay with good water holding capacity after rainfall ceases. The third location, Menkere, is geographically located at 12.54°N latitude, 39.51°E longitude and elevation of 2490 masl. Its soil type is clay loam with a rooting depth of 60–100 m. It is prone to frequent terminal drought whereby early rainfall cessation occurs at early crop reproductive stages (online Supplementary Fig. S3). The fourth location, MU, is geo-referenced at 13.46°N latitude and 39.48°E longitude and elevation of 2212 masl. The soil type of MU is clay loam with 28.7 and 17.8 volume percent, averaged over a soil depth of 0 to 40 cm, water holding nature at field capacity and permanent wilting points, respectively as measured by the gravimetric method (Mengistu and Pè, Reference Mengistu and Pè2016).
The climate of the test locations
Climate wise, the four test locations could be divided into two. Melfa and Abya are characterized by wet and cool climatic conditions during the cropping seasons, while Mu and Menkere are characterized by wet and warm to hot weather conditions during the early and mid-crop developmental stages and dry and hot weather conditions prevail during the reproductive stages (i.e. flowering, grain filling and grain development periods) of the crops (online Supplementary Figs. S3 and S4). This condition potentially exposes crop water sensitive developmental stages to water deficit and consequently causes huge yield loss. Online Supplementary Figure S3 presents the average monthly rainfall, while the minimum and maximum temperatures during the cropping season of the test locations are presented in online Supplementary Fig. S4. At all the test locations, more than 80% of the seasonal rainfall is received during the early to mid-season growth stages of wheat in the months of July and August. MU and Menkere are characterized by higher maximum and minimum temperatures during crop reproductive stages than Melfa and Ayba during the same period (online Supplementary Fig. S4b).
Experimental setup
At each location and season, the trial was arranged in 6 × 6 lattice design with two replications. Each genotype was planted to a 3 m2 plot. Each plot was 2 m wide containing six rows of 2.5 m long with an inter-row spacing of 0.2 m. The plot to plot spacing within incomplete blocks was 0.4 m and incomplete block spacing was 0.5 m. Replications were separated by 1 m gangway. All genotypes were row planted at an equal seed rate of 125 kg/ha. A blended fertilizer, consisting of (13.8% N, 31% P, 8% K, 2% S and 0.2% Zn), was applied at 100 kg/ha during planting. To balance the 100 kg/ha urea recommendation, 86.2 kg/ha of urea was top dressed at a tillering stage at all locations and seasons. Weeds kept at bay manually.
Data collection
Phenological traits: Three phenological trait data were collected and analysed. Days to 50% booting (DB) (number of days from sowing to the stage at which fifty percent of the plants within a plot boot, Zadoks stage 45), days to 50% flowering (DF) (number of days from sowing to the stage at which fifty percent of the plants within a plot flower, Zadoks stage 65) (Zadoks et al., Reference Zadoks, Chang and Konzak1974) and days to maturity (DM) (days from sowing to physiological maturity where the uppermost internodes turned golden yellow) were recorded on plot basis.
Quantitative traits:- some of the quantitative traits such as plant height (PH), spike length (SPL) and number seeds per spike (SPS) were recorded from five randomly sampled plants from the four-central rows at maturity before harvest. Above ground biomass yield (BY) and grain yield (GY) were recorded, after the four-central rows were mechanically harvested in kg and g, respectively, and after converted into t/ha. BY was measured using a portable hanging weighing scale (Model: 23510S (SHFSB-0403)) in the field during harvesting, whereas GY and 1000-grain weight (TGW) were obtained by weighing harvested grain and counted 1000 grains on an analytical sensitive balance. Finally, GY and TGW were adjusted to 12.5% moisture content, according to Badu-Apraku et al. (Reference Badu-Apraku, Fakorede, Menkir and Sanogo2012).
 $${\rm Grain\ yield\ (kg/ha)}\, = \,\displaystyle{{100{\rm \;} -{\rm \;\%\ \;AMC}} \over {100{\rm \;} -{\rm \;\%\ \;SMC}}} \times 100$$
where
AMC = actual (obtained) grain moisture content (%) SMC = standard moisture content (12.5%)
Grain quality traits: From the harvested grain of each genotype, 350 g was weighed and analysed for grain quality parameters at Sinana Agricultural Research center (SiARC) laboratory. The machine Minfra Smart T® wheat grain analyser was used to measure whole grain protein content (PC) and gluten content (GC) values (%).
Statistical analysis
Raw field data, after checking for normality and homogeneity of variance, were fitted to a generalized linear model of unbalanced design with genotypes, locations and years were considered as fixed effects while replication nesting incomplete blocks (inbloc.) assigned as the random effect. This analysis allowed us to see all the main effects and interaction effects between genotypes, locations and years. A regression model from Analysis of Variance was used to produce the best linear unbiased predictors (BLUPs) for genotype, locations, years and their interaction using Genstat-18.2 (Payne et al., Reference Payne, Murray, Harding, Baird and Soutar2015), which was used for all subsequent multivariate analyses. The genetic diversity among the genotypes was further assessed using biplot and cluster analyses. Cluster analysis was performed using a squared Euclidean distance (D 2) as a measure of similarity and complete linkage methods, which define similarity on the basis of minimum similarity between observations within a cluster. The performance of genotypes in different environments was assessed using GGE biplot, as outlined in Ceccarelli (Reference Ceccarelli2012). The GGE biplot presents the environment and genotype scores for the various traits, which helps to visualize genotype and environment overlay. Through this analysis the winning genotypes for the particular environment are identified and further sub-regions or mega-environments for wheat production were delineated.
Results
Analysis of the variance results are presented in Table 1. Genotypes (G) differed significantly (P < 0.001) for all traits observed. The two environmental factors, location (L) and year (Y), affected all the traits significantly, except SPL due to year (Table 1; Figs. 1 and 2). The four test locations (L) affected all observed traits very significantly. The effects due to two way interactions, G × L, G × Y, L × Y, and three way interaction G × L × Y were significant with some exceptions. The interaction effect due to environmental, L × Y, factors was significant (P < 0.001) for all traits. SPL seems to be less affected by the interaction effect than the other traits. As neither years nor any interaction with years was significant for SPL, the implication could be seasonal variations affecting wheat might occur after full spike development. Unlike the effect of genotypes and locations, the effect of years on wheat yield is more manifested on post heading traits such as SPS, BY and TGW.
Table 1. Mean square and probability values (P-value, indicated by asterisk) computed from pooled analysis of variance (ANOVA) for phenological and quantitative traits

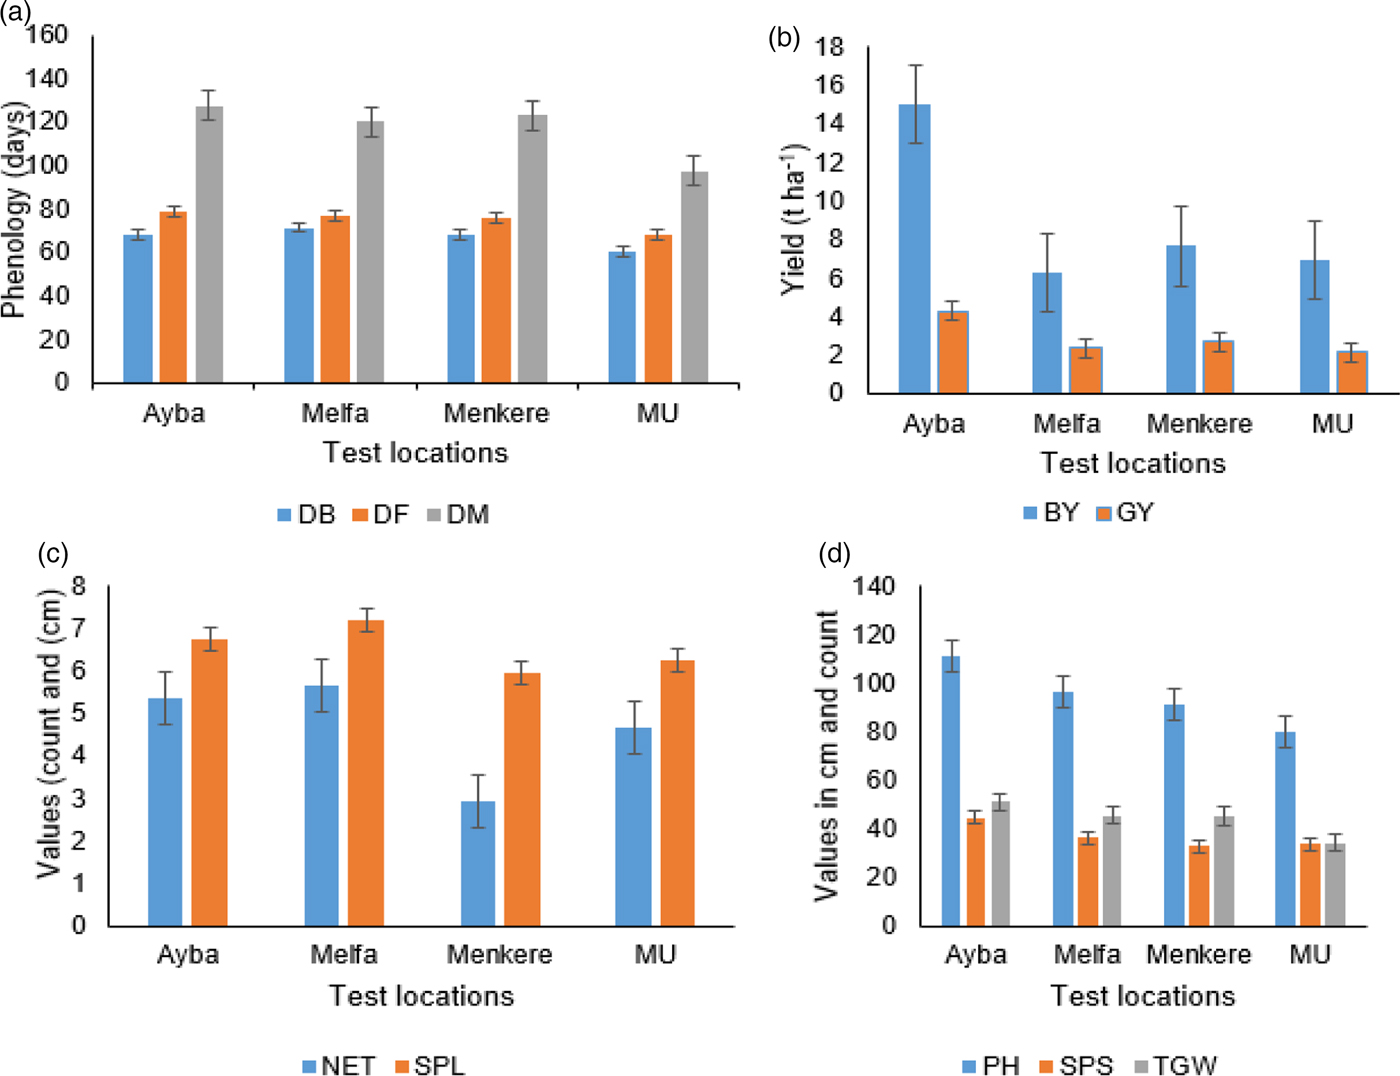
Fig. 1. Effect of test locations on traits of durum wheat: (a) phenological traits; (b) yield traits and (c and d) yield components.
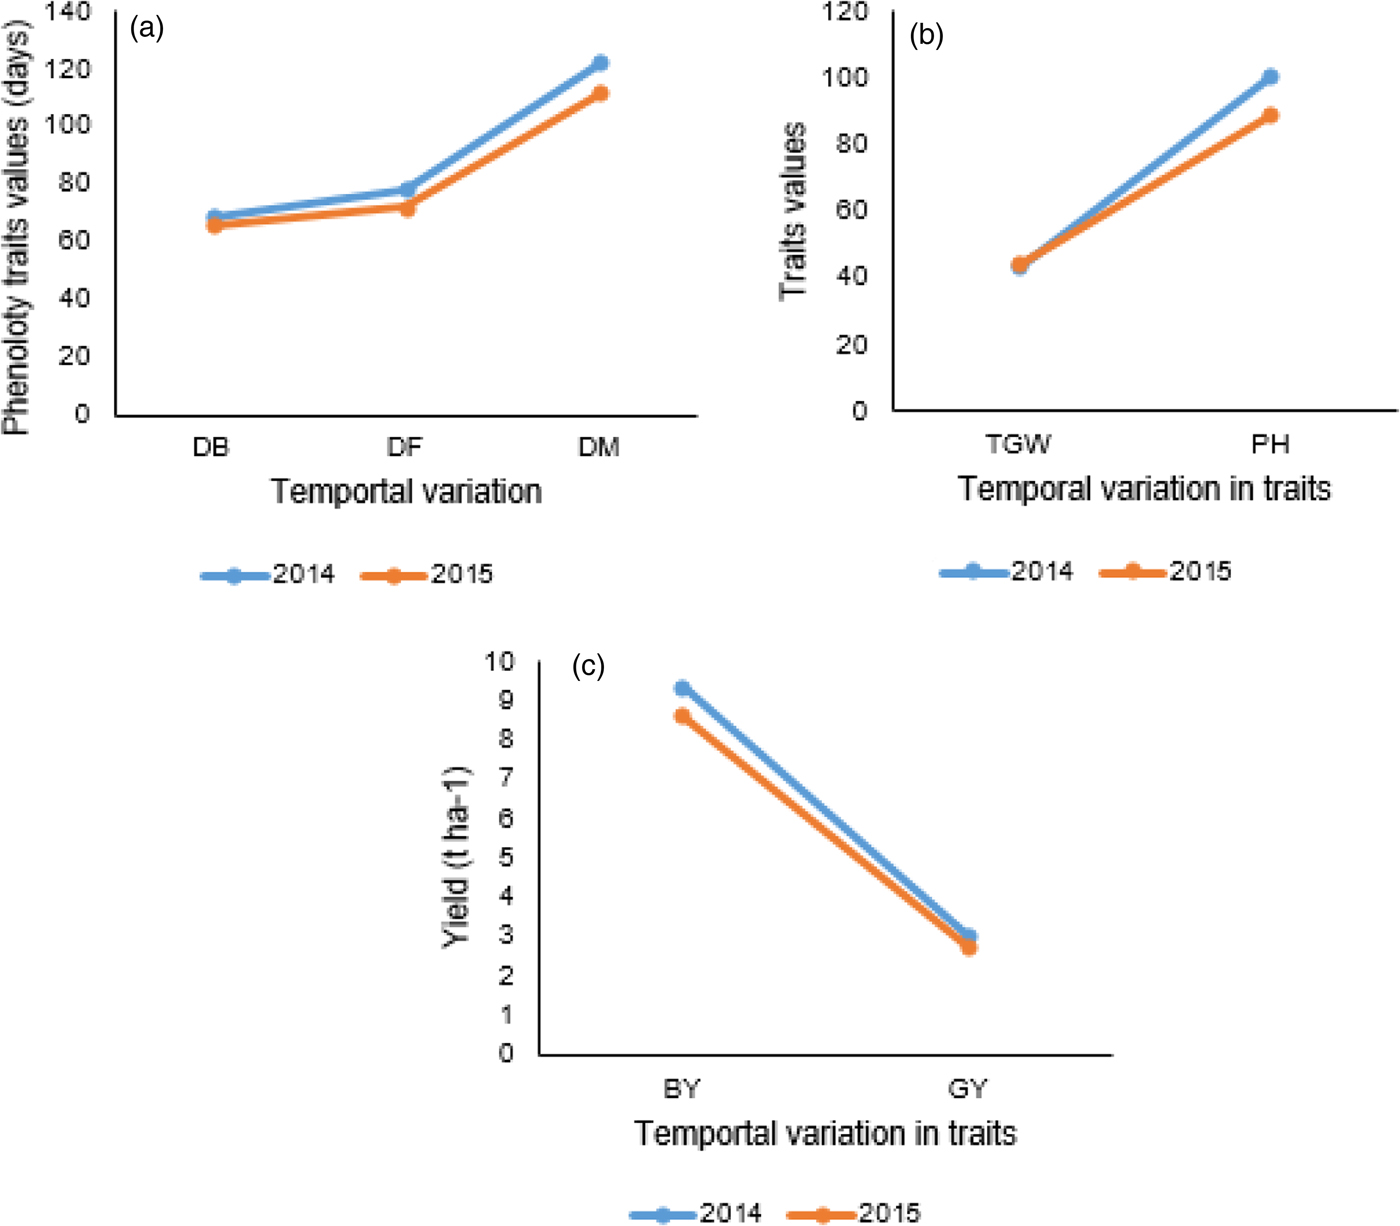
Fig. 2. Effect of temporal variation on (a) phenological traits; (b) thousand grain weight and plant height and (c) biological and grain yields. The comparison is between seasons within trait.
For all traits where the interaction effects was significant, interaction means for each trait were used for assessing the performance of genotypes across locations and years. Such results are presented in Figs. 1 and 2 and online Supplementary Table S2 for all traits except SPL. The table presents the top 10 performers sorted based on GY.
Considering genotypic mean, about 29% of the tested FVs are high yielders, exceeding the best improved variety, Asassa, by up to 14.3% (Table 2). FV G1 (226834) is the highest yielder (3.51 t/ha), which exceeded the yield of Asassa by 14.3% (Table 2). The most preferred genotypes, G10 (208304) and G30 (8208), are the fourth and fifth top yielders with an average GY of 3.34 and 3.3 t/ha. In comparison with Asassa, both FVs gave an overall yield advantage of 8.79 and 7.49%, respectively, and registered nationally due to this advantage and other merits (Table 2). All the five included improved varieties failed to appear in the top ten genotypes and three of them were trailed in the bottom five (Table 2). The genotype by environment interaction, G × L × Y (online Supplementary Table S2), deserves more attention as the aim of this research is to identify spatially and temporally adaptable genotypes. The effect of genotype by environments was discussed for five traits, DF, DM, BY, GY and TGW because the effect was largely manifested on these traits (Table 1; Figs. 1(a–d) and 2(a–c)).
Table 2. Genotypic BLUP means for phenological and quantitative traits presented for top 10, the standard check and bottom five genotypes with grand mean and LSD values

Ranking was done on the basis of GY.
a Most stable genotypes which were registered nationally as variety with the name of Rigeat and Wehabit, respectively.
Variation for phenology
FVs showed wider variation for phenological as well as quantitative traits compared to the improved varieties. In drylands of Ethiopia such as Tigray, early maturing varieties are preferred to late maturing varieties to escape the omnivorous terminal drought. In this regard, FVs G4, G7, G16, G18, G19 and G29 are identified as early flowering genotypes across locations (Fig. 2(a) and online Supplementary Table S2). However, these genotypes did not mature earlier across locations and years/within locations except G4 at Menkere and MU. This implies that some of the late flowering genotypes might have deployed developmental plasticity to set into early maturity. G6 matured earlier at all locations during both cropping seasons. G2 matured earlier at Ayba, Melfa and Menkere during both cropping seasons but not at MU. For MU, G4 was among early maturing genotypes during both cropping seasons. The improved varieties, G32–G36, showed inconsistent maturity time although G34, G35 and G36 tend to flower early at all test locations. The newly released varieties, as an outcome of this research, G10 and G30, were among the top 10 early maturing varieties at test locations except at Ayba (online Supplementary Table S2). Delay maturity at Ayba might be associated with sufficient rainfall (online Supplementary Fig. S3) and its soil water holding capacity compared to the other three locations which could resulted in an extended crop growing period.
Variation for quantitative traits
A significant variation was observed for quantitative traits: GY, BY, TGW and others, due to genotype × location (Fig. 1(a–d)), genotype × years (Fig. 2(a–c)) and the three way, G × L × Y, interactions (online Supplementary Table S2). This table presents a matrix showing the spatial and temporal performance of genotypes. For instance, G10 and G30 have shown wider adaptation for BY, GY and TGW because they are among the top ten at all locations. It seems from the matrix (online Supplementary Table S2) and Fig. 2 that the test locations can be grouped into sub-mega environments. Considering DM, Ayba and Melfa could be categorized as one mega durum wheat growing environment while Menkere and MU tend to be mostly independent environments (Fig. 3(a)). In most cases, Menkere and MU grouped together except for GY. For this trait, two sub-growing regions were identified whereby Melfa and MU can be considered as one sub-group while Ayba and Menkere are the other sub-growing regions (Fig. 3(e)). For the major quantitative traits such as GY, BY and TGW, Ayba could be treated as an out grouping location despite falling into the same concentric circle with other locations (Fig. 3(d–f)). This might be associated with the climatic conditions of the test locations (online Supplementary Figs. S3 and S4).

Fig. 3. GGE biplot showing the which – won – where and mega – environment for selected traits of durum wheat.
The winning genotypes for GY, BY and TGW are those located at the vertex of the polygon at each location. The most stable genotypes are G22, G21, G10 and G13, with cultivar superiority indices of 0.054 (1), 0.081 (2), 0.134 (3) and 0.17 (4), respectively, which are among the winning genotypes for GY and BY. The number within parentheses is the superiority rank of genotypes. The result of stability analysis clearly showed that all the most stable genotypes are FVs. Durum wheat variety has to qualify for minimum quality requirement besides grain productivity to be accepted by the market. Its PC (%) and GC (%) are among important quality traits. The PC and GC of the top ten stable genotypes are presented in Table 3. Six of the top ten stable genotypes G22, G10, G30, G16, G23 and G25 have higher PC (>13%) and GC (>30%). Moreover, all of these genotypes are FVs. Because these FVs are characterized by early to medium maturity time, higher GY, better grain quality and stable performance across the test locations, they could be directly deployed for production or could be used as a donor parent in durum wheat breeding programs.
Table 3. Spatial stability index, genotypic rank and grain quality traits (PC, %) and (GC, %) of top performing durum wheat genotypes

Numbers within parentheses give the position of each genotype, ranked according to their stability coefficient (running downwards from 1 = best).
Three groups of genotypes established
The thirty six tested genotypes could broadly be grouped into three clusters (online Supplementary Fig. S5) which could further subdivided into sub-clusters. The first cluster is the largest composing 16 (44.4%) genotypes. Fifteen (94%) of the genotypes in this cluster are FVs. The second cluster contained the most important genotypes for GY, stability and grain quality traits. The genotypes within this cluster were sub-grouped into five sub-clusters. The fifth sub-cluster is solitary containing only G22. This cluster could be a source of genotypes for direct selection breeding or a donor of parental lines in hybridization breeding to improve GY, grain quality traits as well as other important traits. The third cluster contained five genotypes, two of them are FVs. It could be further subdivided into three sub-cluster where the third sub-cluster was again solitary containing only G28. G18, G34 and G35 have merits of early flowering and maturity across locations (online Supplementary Table S2).
Discussions
The phenotypic and genetic variation present within a crop species allows crops adapt to the ever changing climatic conditions. Crop FVs have the capacity to buffer the effect of climate changes (Brush, Reference Brush1995; Lopes et al., Reference Lopes, El-Basyoni, Baenziger, Singh, Royo, Ozbek, Aktas, Ozer, Ozdemir, Manickavelu, Ban and Vikram2015) more than most of the improved varieties, because they have a broader genetic base. The result we are presenting in this paper strongly supports the hypothesis that FVs have the capacity to provide valuable traits for adaptation to environmental stresses. Significant differences between genotypes for phenological and quantitative traits were identified across different environments (Table 1, Figs. 1 and 2). This implies the presence of variability for measured traits within these genotypes, which will provide ample scope for selecting superior genotypes by plant breeders. For the measured traits, superior FVs to IMVs were identified (Table 2 and online Supplementary Table S2). In addition to their superiority, FVs are popular among custodian farmers for their high-feed quality of both grain and straw (Grando et al., Reference Grando, Baum, Ceccarelli, Goodchild, Jaby El-Haramein, Jahoor and Backes2005; Mancini et al., Reference Mancini, Kidane, Mengistu, Pè, Fadda and Dell'Acqua2017).
This diversity and superiority is somewhat expected, since Ethiopia is considered as the centre of diversity for tetraploid wheat (Vavilov, Reference Vavilov1951; Harlan, Reference Harlan1969; IBC, 2008). Previously we have shown that Ethiopian durum wheat FVs are genetically diverse and distinct from improved varieties cultivated in Ethiopia (Mengistu et al., Reference Mengistu, Yosef, Catellani, Frascaroli, Fadda, Pè and Dell'Acqua2016; Reference Mengistu, Yosef, Fadda and Pè2018). Our various studies indicated that Ethiopian durum wheat FVs can be considered as a reservoir of genes that plant breeders need in their wheat breeding programs (Kidane et al., Reference Kidane, Hailemariam, Mengistu, Fadda, Pè and Dell'Acqua2017; Mancini et al., Reference Mancini, Kidane, Mengistu, Pè, Fadda and Dell'Acqua2017; Mengistu et al., Reference Mengistu, Yosef, Fadda and Pè2018).
Despite the established facts, these genetic resources were underutilized by national durum wheat breeding programs due to the heavy reliance on exotic crosses from international breeding blocks. The current study, probably the first breeding work that fully exploited FVs, could contribute to revert this paradox. The various deployed statistical analyses have showed that many of the tested FVs were significantly superior to the IMVs under rain-fed conditions of the test locations. The range of performance for selected traits of the 10 top performing genotypes was presented in online Supplementary Table S2. The top 10 genotypes showed a yield difference of 1.19 t/ha with a range of 6.38–5.19 t/ha at Ayba during 2014 and less than 1 t/ha (3.03–2.16 t/ha) at MU during 2015. Some FVs such as G10, G22, and G30 have shown a consistent performance for GY and some other important traits at all locations and are suitable for production in a wider environment. That means they have wider adaptation with a stability index of <0.15 (Table 3). Genotypes indicated with shaded colour in online Supplementary Table S2 have showed consistent performance across locations and years. Similar results were presented by Mengistu et al. (Reference Mengistu, Yosef, Fadda and Pè2018) on durum wheat and Al-Abdallat et al. (Reference Al-Abdallat, Karadsheh, Hadadd, Akash, Ceccarelli, Baum, Hasan, Jighly and Abu Elenein2017) on barley. However, some genotypes performed well in some environments where they had the highest value for one trait but the lowest value for the other traits. There is elasticity for phenology traits across locations. Some genotypes have shown developmental plasticity for DF and DM where late flowering and maturity times are featured at Ayba and Melfa while earliness is featured at MU (online Supplementary Table S2; Fig. 3(a)).
The differential genotype performance across environments was evidenced by magnitude of variations attributed to environments (Fig. 3). The fact that larger variation attributed to the genotype effect (>50%) indicates the possibility of selecting common genotypes that adapt across test locations. This might be attributed to the number of genotypes characterized and initial divergence among the tested genotypes. The proportion of variance explained by genotype, environments and genotype × environments depends on several factors such as genotype and environment samples (Williams et al., Reference Williams, O'Brien and Eagles2008). Characterizing large genotypes in diversified environments might increase the magnitude of variance explained by genotype than environments or the interaction. For instance, Lado et al. (Reference Lado, Barrios, Quincke, Silva and Gutiérrez2016) reported that variance in GY is mostly explained by genotypic variance than the remaining two. On the other hand, our result disagree with Mohammadi and Amri (Reference Mohammadi and Amri2011) who reported that most variations observed for quantitative traits were attributed more to environmental effects than the genotype effect in durum wheat under drought conditions. Testing small and genetically narrow genotypes in diversified environments magnify the magnitude of G×E while minimizing the magnitude of the genotypic effect. The findings of Mohammadi and Amri (Reference Mohammadi and Amri2011) and Rodriguez et al. (Reference Rodriguez, Rau, Papa and Attene2008) best explain this situation where the magnitude of G×E masked the possibility of selecting winning genotypes for GY with wider adaptation.
When genotypes differentially performed across environments, it was suggested to divide the test environments into sub-regions to avoid inconsistent environmental conditions prevailed across locations. Test locations of this study could be sub-divided into various sub-regions for various traits. For instance, Ayba, Melfa and MU could be categorized as one sub-region for DM where G2, G6, G9 and G22 can be selected for earliness for these locations (Fig. 3(a); online Supplementary Table S2). Even though Menkere stands as another sub-region for DM still G2, G6, G17 and G22 could be identified as early maturing FVs (Fig. 3(a)). In strict sense G2, G6, G9 and G22 are the best early maturing FVs at all locations. Considering GY, two sub-regions could be established (Fig. 3(b)). MU and Melfa are the first sub-region with G27 is the winning genotype. The other suitable genotypes to this sub-region include G10, G19, G21, G22 and G30. The second sub-region containing Ayba and Menkere with G10, G16, G21, G22 and G30 are still the most winning genotypes. It can be inferred that G10, G21, G22 and G30 have wider adaptability with a stable performance across test locations (Table 3). All these genotypes are FVs. If BY is considered, two sub-environments with different clustering are formed. Menkere and MU could be categorized as one region while Ayba and Melfa are the second sub-region though Melfa more resembles the first sub-region (Fig. 3(d)). The winning genotypes for this trait in sub-region 1 include G10, G19, G22, G25 and G27, while G4, G10, G16, G26 and G30 are the most winning genotypes for sub-region 2. G10 is common for both regions.
The best performing genotypes are FVs which are known to be adaptable to variable growing conditions (Mohammadi et al., Reference Mohammadi, Sadeghzadeh, Ahmadi, Bahrami and Amri2015; Mengistu et al., Reference Mengistu, Yosef, Fadda and Pè2018). Our FVs included in this study possess phenotypic adaptation as most observed variations are the genotypic effect (Pajoro et al., Reference Pajoro, Verhage and Immink2016). FVs such as G10, G16, G21, G22 and G30 have shown yield stability across the test locations, which are a plastic response feature of many FVs (Zeven, Reference Zeven1998). The clustering shown as dendrogram provided further support for the superiority of these genotypes to the improved varieties (online Supplementary Fig. S5). The most important FVs were contained in various sub-clusters of cluster II. Two of them, G10 and G30, are already nationally recognized as variety as an outcome of this experimental work. The other FVs such as G2, G4, G6, G16, G19, G21 and G22 should be utilized in durum wheat breeding programs for introgression of the various traits or should also be released for direct use.
Conclusion and perspective
We have observed a high level of variation for all phenological and quantitative traits measured in Ethiopian durum wheat FVs evaluated for two years at four wheat growing areas of Tigray. Such variation was confirmed by all employed statistical analyses. Investigated genotypes showed wider spatial and temporal variations for phenological and quantitative traits. Most of the FVs, as shown in Table 2, demonstrated the superior performance over the IMVs. Genotypes that showed the consistent spatial performance can be recommended for wider adaptation breeding. Genotypes such as G4, G7, G16 and G19 could be potentially utilized in the breeding program designed for flowering time improvement in drylands where shortening the flowering time helps in escaping the terminal drought episode. The early flowering genotypes were failed to repeat earliness for maturity which might indicate the presence of phenological plasticity in some of the test genotypes. Genotypes G2 (206556) and G6 (208175) could be exploited for developmental plasticity as they matured earlier at all locations than the early flowered genotypes. G4, however, repeated earliness for maturity at the drier test location MU and can be a target for selection in similar terminal drought affected areas.
Two types of varieties emerged: varieties with local adaptation and varieties with broad adaptation. Varieties with local adaptation can be useful for direct use by farmers under particular conditions. They maximize yield for that given locations or ecology. For instance, G21 (226834) has specific adaptation to the Ayba location with over 5 t/ha productivity during both cropping seasons. Under climate change, local adaptation is as important as broad adaptation. With the need to improve yields to feed fast-growing populations while the natural resources are deteriorating, it is important to maximize the yield at different locations when local adaptation provides significantly greater yields compared to varieties with broad adaptation. On the other hand varieties with broad adaptation were also found, which could be used in breeding programs as well as for direct use.
The variation due to an environment and genotype-by-environment interaction is relatively small in all investigated traits. As a result, stable and superior FVs that can suit to all test locations were identified. These genotypes include G10, G16, G21, G22 and G30. Of the stable genotypes, G10 and G30 were nationally registered and released for commercial production for high yielding, stability and adaptation and for quality grain in terms of grain content, grain colour and vitreousness. Besides direct selection for production, the superior FVs identified in this study can be used in durum wheat breeding programs to improve productivity and stability under field conditions in marginal areas of Ethiopia and across arid regions in the world.
Supplementary material
To view supplementary material for this article can be found at https://doi.org/10.1017/S1479262119000194
Acknowledgement
The authors acknowledge the financial support from Bioversity International. We thank participant farmers for their unreserved involvement during evaluation of the genotypes at each location.
Authors' contributions
DKM designed and carried out the experiment, analysed the data, interpreted the results and wrote the manuscript. JNM and AYK have assisted the experimental execution and data collection. YT contributed to data collection and analysis. CF coordinated the whole study. All authors have read and approved the final version of the manuscript.
Conflict of interest
To view authors declare that they have no competing interests


