Introduction
Microsatellites (simple sequence repeats, SSRs) are the choice of many studies because of their high levels of polymorphism, reproducibility, co-dominant nature and genome and locus-specificity (Powell et al., Reference Powell, Morgante, Andre, Hanafey, Vogel, Tingey and Rafalski1996; Pinheiro et al., Reference Pinheiro, Palma-Silva, Barros and Cozzolino2009).
The high transfer rate of SSRs between related species is an advantage to save a large portion of development time and costs (Barbará et al., Reference Barbará, Palma-Silva, Paggi, Bered, Fay and Lexer2007). Hence, sourcing of SSR primers from related species could be a cost-effective alternative to develop primers especially for new species where abundant sequence data are not available (Kantety et al., Reference Kantety, Rota, Matthews and Sorrells2002) and resources for developing new SSR primers are limited (Roa et al., Reference Roa, Chavarriaga-Aquire, Dugue, Maya, Bonierbale, Iglesias and Tohme2000; Pinheiro et al., Reference Pinheiro, Palma-Silva, Barros and Cozzolino2009).
The macaw palm, A. aculeata (Jacq.) (Lodd. ex Mart.) − Arecaceae (2n= 2x= 30) (Abreu et al., Reference Abreu, Carvalho, Carvalho and Motoike2011), is an emerging perennial palm native to South America. It is monoecious and self-compatible with androgynous inflorescence, which bears a mixed reproductive system, with a predominance of out-crossing (Scariot et al., Reference Scariot, Lleras and Hay1991; Abreu et al., Reference Abreu, Priollig, Azevedo-Filho, Nucci, Zucchi, Coelho and Colombo2012). The combination of two pollination strategies (entomophily and anemophily) with flexible reproductive systems (cross- and self-pollination) suggests that A. aculeata can be highly successful in the colonization of new areas, as evidenced by its ample distribution in Brazilian biomes and in the rest of the Neotropics (Scariot et al., Reference Scariot, Lleras and Hay1991).
The species is known for its high oil-producing potential, thereby becoming sources of biofuel for both aviation and automotive sectors (Lanes et al., Reference Lanes, Costa and Motoike2014). It produces up to 25 tonnes/ha of fruits, which can be processed to 4000 kg of vegetable oil and the resulting solid waste of which can be transformed into charcoal and nutritious cakes to generate energy and feed livestock (Tickel, Reference Tickel2000; Moura et al., Reference Moura, Motoike, Ventrella, Sá Junior and Carvalho2009). The biochemical properties of the oil are suitable for cosmetic industries and for biodiesel production (Fortes and Baugh, Reference Fortes and Baugh1999; Bora and Rocha, Reference Bora and Rocha2004; Hiane et al., Reference Hiane, Ramos-Filho, Ramos and Macedo2005). Moreover, this palm has environmental benefits as it can grow in impoverished soils and drought-prevailing areas (Motoike and Kuki, Reference Motoike and Kuki2009). Hence, A. aculeata is a suitable option for production of biodiesel among the common food-based oleaginous plants such as soybean, sunflower and oil palms (Teixeira, Reference Teixeira and Lacerda2005).
However, A. aculeata has risks of predatory extractivism in natural populations, unsustainable land use and climate change, which potentially threaten its natural genetic diversity (Faleiro et al., Reference Faleiro, Costa, Karia, Andrade, Junqueira, Pereira, Pereira and Sano2008; Ribeiro et al., Reference Ribeiro, Souza, Rodrigues, Oliveira and Garcia2011). Our study focused on the development of new microsatellite markers for A. aculeata sourcing SSRs from related palm species to contribute for the conservation of genetic resources of this noble palm.
Therefore, this study was carried out to evaluate the transferability of some SSR markers from Astrocaryum aculeatum and Elaeis oleifera to A. aculeata. It was also performed to identify and characterize some polymorphic SSR markers from sets of markers previously developed for A. aculeata.
Materials and methods
Plant material and DNA isolation
Leaf samples of 192 A. aculeata germplasm accessions were obtained from the ex situ plant collection, Macaúba Active Germplasm Bank (BAG-Macaúba respository #: 084/2013/CGEN/MMA) located in the experimental farm of the Universidade Federal de Viçosa in the municipality of Araponga (20°40′1′′S, 42°31′15′′W), State of Minas Gerais, Brazil (Table 1). The accessions, obtained from six States in Brazil (Fig. 1), were developed from seeds germinated using a pre-germination protocol as described in patent INPI 014070005335 (Motoike et al., 2007). The accessions represent six provenances containing 41 different families, each having a maximum of five individual samples (Table 1).
Table 1 List of 41 Acrocomia aculeata families assessed in the Macaúba Active Germplasm Bank (BAG-Macaúba)

a States include: PA = Pará, PE = Pernambuco, PB = Paraiba, SP = São Paulo, MG = Minas Gerais and MS = Mato Grosso do Sul.
b Coordinates are in degrees, minutes and seconds for both the latitude (S = South) and longitude (W = West).

Fig. 1 Map of Brazil showing the six geographical states, where the original plant materials were collected. The states include: Pará; Pernambuco; Paraiba; São Paulo; Minas Gerais and Mato Grosso do Sul. Araponga is a city in Minas Gerais State, where the germplasm bank is located from which the experimental plant materials were obtained.
Genomic DNA (gDNA) was isolated from each individual sample according to the CTAB (Cetyl Tri-methyl Ammonium Bromide) method (Doyle and Doyle, Reference Doyle and Doyle1990), with some modifications as described by Lanes et al. (Reference Lanes, Nick, Kuki, Freitas and Motoike2013). Isolated DNA samples were quantified using Multiscan™ GO Microplate Spectrophotometer (Thermo Fisher Scientific OY, Ratasite, Finland) at absorbance of 260 and 280 nm. The integrity of the DNA samples was confirmed by electrophoresis on 2% agarose gel and the working concentration was adjusted to 30 ng/μl.
Condition of polymerase chain reaction (PCR) and electrophoresis
The PCR was performed according to Nucci et al. (Reference Nucci, Azevedo-Filho, Colomo, Priolli, Coelho, Mata and Zucchi2008), Ramos et al. (Reference Ramos, Vasconcelos de Macêdo, Lopes, Batista, Formiga, Pimentel da Silva, Saulo-Machado and Veassey2012) and Zaki et al. (Reference Zaki, Singh, Rosli and Ismail2012) with minor modifications (Table 2). Totally, 20 SSR markers, originally developed for E. oleifera (Zaki et al., Reference Zaki, Singh, Rosli and Ismail2012), 14 developed for A. aculeatum (Ramos et al., Reference Ramos, Vasconcelos de Macêdo, Lopes, Batista, Formiga, Pimentel da Silva, Saulo-Machado and Veassey2012) and three identified from A. aculeata (Nucci, Reference Nucci2007) were used in the reactions. Of the total number of primers that amplified the target microsatellite loci, the sequences of only 18 were listed (Table 2).
Table 2 List of SSR primer sequences used to amplify the target microsatellite loci in the cross-amplification

T a, annealing temperature.
a 1, Ramos et al. (Reference Ramos, Vasconcelos de Macêdo, Lopes, Batista, Formiga, Pimentel da Silva, Saulo-Machado and Veassey2012); 2, Zaki et al. (Reference Zaki, Singh, Rosli and Ismail2012); 3, Nucci (Reference Nucci2007).
The amplification cycles were carried out on a PCR thermal cycler (Applied Biosystem® Verti® cycler, Thermo Fisher Scientific Brand, USA) programmed as follows: initial denaturation step at 94°C for 5 min followed by 30 cycles of denaturation at 94°C for 1 min; annealing at primer-specific annealing temperature for 1 min (Table 2); extension at 72°C for 1 min and the final extension at 72°C for 8 min (Nucci et al., Reference Nucci, Azevedo-Filho, Colomo, Priolli, Coelho, Mata and Zucchi2008). PCR products were denatured in a bromophenol blue dye solution at 95°C for 5 min on the thermal cycler immediately before electrophoresis on 6% polyacrylamide gel in 1 × TBE (Tris–Borate–EDTA) buffer solution at 60 W for 1 h and 40 min.
Polyacrylamide gel staining
After electrophoresis, the PCR products were visualized in polyacrylamide gels stained with silver nitrate (AgNO3) according to Brito et al. (Reference Brito, Caixeta, Gallina, Zambolim, Zambolim, Diola and Loureiro2010). The gels were immersed and agitated in several colouring steps in different solutions at different concentrations and durations until all allelic bands were totally visible for evaluation. Finally, the stained gels were allowed to dry in the air and scanned for documentation and DNA fragments were scored as co-dominant alleles for data analysis.
Data analyses
Co-dominant data were analysed using the GENES statistical software program (Cruz, Reference Cruz2013) to estimate allelic diversity, heterozygosity and polymorphism level of the SSR markers. The number of alleles per locus (A) was determined by quantifying the number of different alleles amplified by each marker analysed with 192 individuals. The total number of alleles per provenance (N t) was determined by summing the number of alleles amplified by each locus (A). Hence, the average number of alleles per provenance (N a) was calculated from the total number of alleles detected in the provenances by the loci that were analysed (Cruz et al., Reference Cruz, Ferreira and Pessoni2011). Effective numbers of alleles (N e), which are used to make sampling in successive generations of a given population, were determined by quantifying the number of alleles amplified by the polymorphic loci out of the total number of loci analysed with a criterion that alleles have a frequency of < 0.95 (Cole, Reference Cole2003).
The heterozygosity level of each locus was determined. Expected heterozygosity (H E) per locus was estimated from the frequency of alleles detected per locus, while observed heterozygosity (H o) was determined by calculating the number of heterozygotes observed out of the total number of individuals analysed (Nei, Reference Nei1978). H E and H o were used to estimate the inbreeding coefficient (F) per locus to determine whether there are excess (or any deficiency) of heterozygotes per locus (Hartl and Clark, Reference Hartl and Clark1997).
The informativeness of the SSR markers was estimated in the analyses by calculating the polymorphic information content (PIC) of each locus, which was computed from the frequency of alleles detected per locus according to Bostein et al. (Reference Bostein, Whiter, Skolnick and Davis1980). To estimate the proportions of polymorphic loci detected in each provenance, the percentage of polymorphic loci (P) per provenance was determined by quantifying the number of polymorphic loci obtained out of the total number of loci analysed based on a criterion when a locus with most common alleles has a frequency of less than 0.95 (Cole, Reference Cole2003).
The null allele test was performed to check for evidence of null alleles detected by the loci using the FreeNA (Chapuis and Estoup, Reference Chapuis and Estoup2007) computer program based on the Expectation Maximization (EM) algorithm as described in Dempster et al. (Reference Dempster, Laird and Rubin1977), which estimated the null allele frequency (p) for each locus across the provenances analysed. A test for deviations from Hardy–Weinberg Equilibrium (HWE) was performed for each locus across the provenances at a significance level of α = 0.05 in GENEPOP (Raymond and Rousset, Reference Raymond and Rousset1995).
Results
Cross-amplification and polymorphism
In the cross-amplification, 15 of the total SSR markers (44%) from A. aculeatum and E. oleifera successfully produced amplicons and were able to amplify the gDNA in A. aculeata (Table 3). However, only four (26%) of the markers were polymorphic and they detected a range of three to eight alleles with an average of 4.5 per locus (Table 3). Besides, three new polymorphic SSR markers were identified from sets of SSR markers previously designed for A. aculeata. Hence, a total of 38 alleles were amplified by the seven polymorphic SSR markers with an average of 5.4 per locus (Table 3).
Table 3 Characteristics of 15 SSR markers identified from Astrocaryum aculeatum (Ramos et al., Reference Ramos, Vasconcelos de Macêdo, Lopes, Batista, Formiga, Pimentel da Silva, Saulo-Machado and Veassey2012) and Elaeis oleifera (Zaki et al., Reference Zaki, Singh, Rosli and Ismail2012), which showed amplification in Acrocomia aculeata accessions and three SSR markers screened from sets of markers developed for A. aculeata (Nucci, Reference Nucci2007)

A, number of alleles per locus; H o, observed heterozygosity; H E, expected heterozygosity; F, inbreeding coefficient; PIC, polymorphic information content; N t, total number of alleles over polymorphic loci and provenance (numbers in brackets are percentages); N a, average number of alleles per polymorphic loci and per provenance; N e, effective number of alleles per provenance; P, percentage of polymorphic loci in brackets (numbers outside brackets are numbers of polymorphic loci); Provenances: PA = Pará, PE = Pernambuco, PB = Paraiba, SP = São Paulo, MG = Minas Gerais, MS = Mato Grosso do Sul.
a Rows refer to the polymorphic loci.
Alleles amplified by the polymorphic loci were detected in the six provenances at different proportions from 14 (35.9%) to 33 (84.6%) (Table 3). Out of the total number of alleles, a range of 2.4–6.8 effective numbers of alleles (N e) with an average of four per provenance were obtained (Table 3). The number of polymorphic loci across the provenances varied from 3.99 (P= 57%) to 7 (P= 100%) with an average of 4.98 (P= 71.2%) per provenance (Table 3). Observed heterozygosity (H o) ranged from 0.01 (sMo00137) to 0.61 (Aac04) with an average of 0.20 per locus, while expected heterozygosity (H E) ranged from 0.09 (sMo00020) to 0.72 (Aac04) with an average of 0.39 per locus (Table 3). A range of positive inbreeding coefficients (F) were obtained from 0.15 (Aac04) to 0.91 (sMo00137) averaging 0.57 per locus, while PIC of the markers varied from 0.08 (sMo00020) to 0.68 (Aac04) with an average of 0.35 per locus (Table 3).
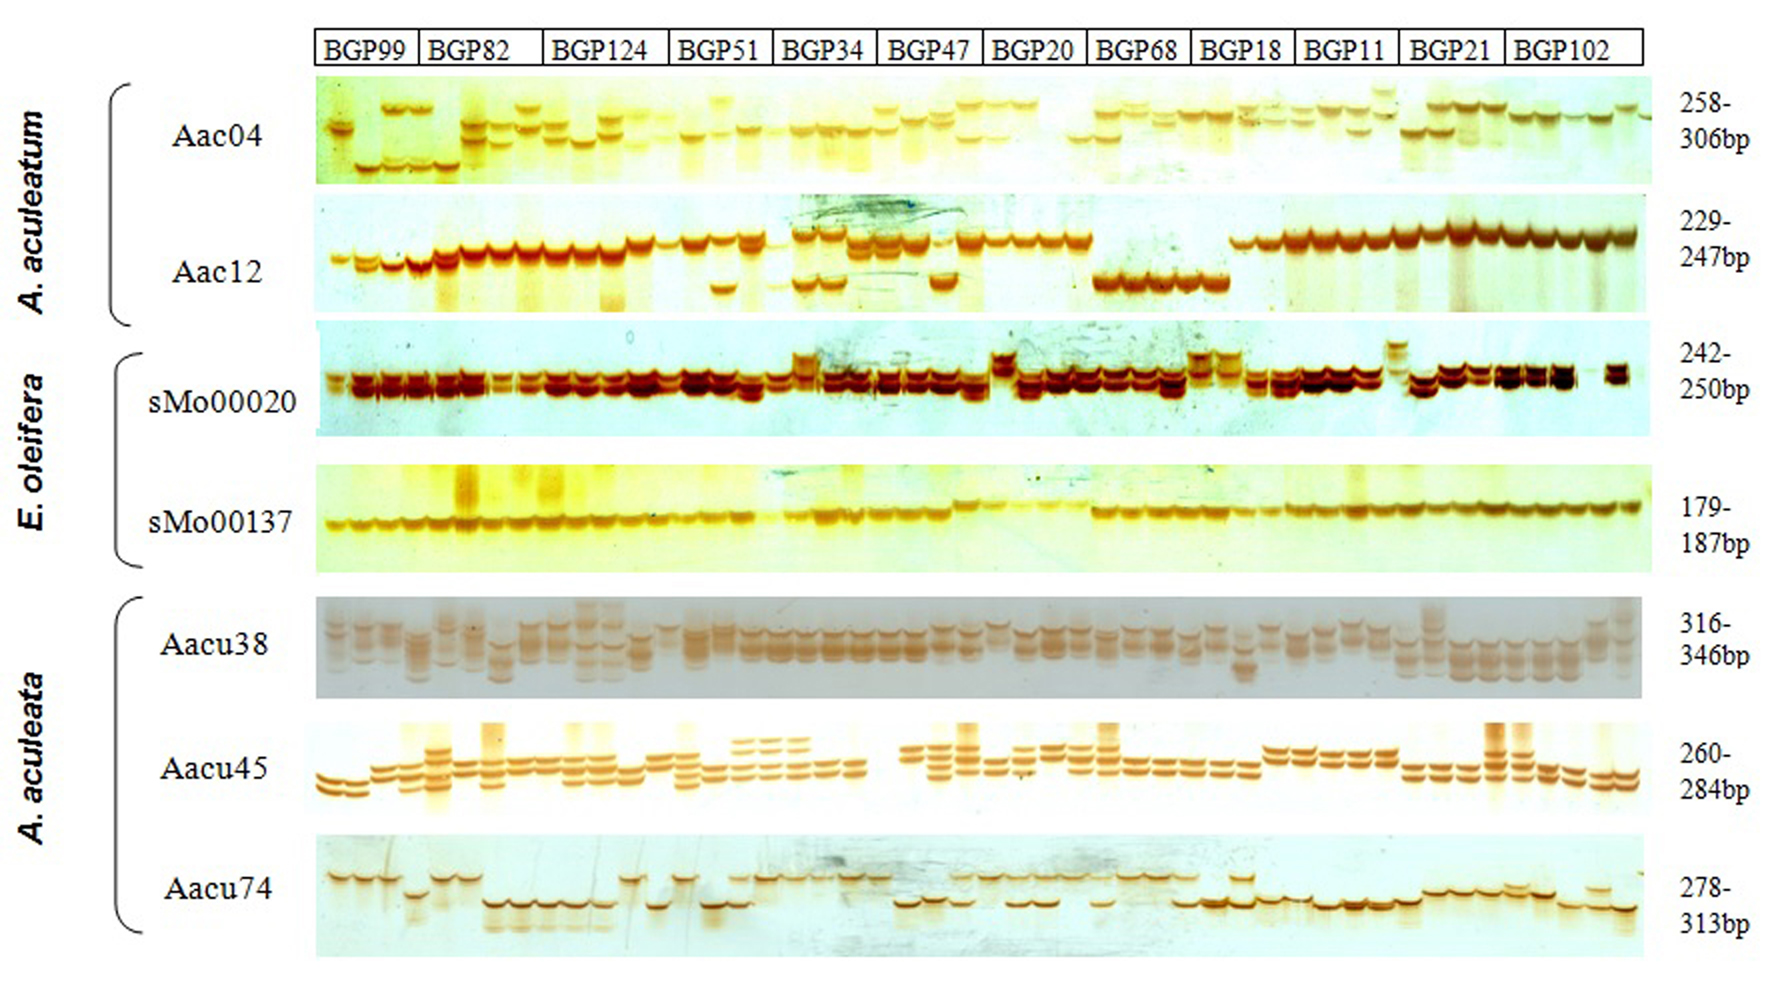
The polymorphism and heterozygosity levels of the seven polymorphic SSR markers that amplified the target microsatellite loci in A. aculeata were depicted in a figure (Fig. S1, available online). This figure demonstrated the allelic profiles of the loci amplified on 12 selected families of A. aculeata containing 48 accessions from the six provenances and elucidated the capability of the markers to distinguish between heterozygote and homozygote individuals in A. aculeata.
The test for evidence of null alleles identified the presence of null alleles across the loci presented in the form of allelic frequency (p) in which the intensity of the null alleles varied among the loci and the provenances analysed (Table 4). A complementary test for HWE showed significant deviations of the loci in certain provenances suspected of having null alleles (Table 4). The combination of the latter two test results showed that loci with a strong null allele frequency are significantly deviated from HWE (Table 4).
Table 4 Locus by provenance table of estimated null allele frequencies (p)a and Hardy–Weinberg deviation test

PA, Pará; PE, Pernambuco; PB, Paraiba; SP, São Paulo; MG, Minas Gerais; MS, Mato Grosso do Sul; ns, not significant.
* Significant deviation from HWE at α = 0.05.
a Frequency estimates (p) were based on the EM algorithm as described in the study by Dempster et al. (Reference Dempster, Laird and Rubin1977).
b No information (–) generated for loci with less than two alleles at the corresponding provenances.
Discussion
The cross-amplification showed the ability of the polymorphic SSR markers to amplify the target microsatellite sequences in A. aculeata. The low percentage of the cross-amplification (26%) however could be attributed to the relatively wider taxonomic distance between the sources (A. aculeatum and E. oleifera) and the target (A. aculeata) species analysed in the study, since all the species are from different genera (Baker et al., Reference Baker, Norup, Clarkson, Couvreur, Dowe, Lewis, Pintaud, Savolainen, Wilmot and Chase2010). Nevertheless, when we look at the taxonomic relatedness between the species, both A. aculeatum and A. aculeata belong to the same sub-tribe (Bactridinae) and hence, in our investigation, provided a relatively higher percentage of cross-amplification (33%) when compared with E. oleifera (22%) (Table 3), which belongs to a different sub-tribe (Elaeidinae) (Baker et al., Reference Baker, Norup, Clarkson, Couvreur, Dowe, Lewis, Pintaud, Savolainen, Wilmot and Chase2010).
As cited by Rossetto (Reference Rossetto and Henry2001), the success in the cross-species amplification of any DNA sequence is inversely related to the evolutionary distance between two species. According to Rossetto (Reference Rossetto and Henry2001), in plants, there is a higher average rate of success in cross-species amplification of gSSR (genomic SSR) markers at sub-genus (89.8%) and genus (76.4%) levels than at family (35.2%) level. Using 20 of the SSR markers tested in this study (sourced from E. oleifera sets of SSRs), a high cross-amplification percentage (83.3%) was reported when analysed with Elaeis guineensis accessions (Zaki et al., Reference Zaki, Singh, Rosli and Ismail2012). Similarly, using the other 14 markers (sourced from A. aculeatum sets of SSRs), between 50 and 93% cross-amplification was reported in accessions of four Astrocaryum species (Ramos et al., Reference Ramos, Vasconcelos de Macêdo, Lopes, Batista, Formiga, Pimentel da Silva, Saulo-Machado and Veassey2012). These high cross-amplification percentages in the latter two studies were due to the fact that the cross-amplifications were at genus and species levels, respectively.
Despite the low rate of cross-amplification obtained in the present study, the number of alleles amplified by the polymorphic markers was comparable with that in the study by Nucci et al. (Reference Nucci, Azevedo-Filho, Colomo, Priolli, Coelho, Mata and Zucchi2008), who first characterized polymorphic SSR markers for A. aculeata. Nucci et al. (Reference Nucci, Azevedo-Filho, Colomo, Priolli, Coelho, Mata and Zucchi2008) reported a range of two to eight alleles with an average of five per locus; while as already reported in this study, a range of three to nine alleles were detected by the markers with an average of 5.4 per locus (Table 3). Out of the total number of alleles, a range of 2.4–6.8 effective numbers of alleles (N e) were obtained in the provenances with an average of four per provenance (Table 3). According to Staub (Reference Staub1994), N e represents measures of the number of equally frequent alleles, which are maintained in a population and used to make proper sampling in several generations. Similar results were obtained for heterozygosity and PIC when compared with the study by Nucci et al. (Reference Nucci, Azevedo-Filho, Colomo, Priolli, Coelho, Mata and Zucchi2008) (H o= 0.27; H E= 0.51 and PIC = 0.48) (Table 3).
However, the number of alleles reported for the four SSRs (Aac04, Aac12, sMo00020 and sMo00137) was higher in other studies when the markers were analysed with accessions of A. aculeatum (average of six alleles per locus; Ramos et al. (Reference Ramos, Vasconcelos de Macêdo, Lopes, Batista, Formiga, Pimentel da Silva, Saulo-Machado and Veassey2012)), and E. oleifera and E. guineensis (average of 7.5 alleles per locus; Zaki et al. (Reference Zaki, Singh, Rosli and Ismail2012)). Similarly, average H o, H E and PIC per locus reported in Zaki et al. (Reference Zaki, Singh, Rosli and Ismail2012) (H o= 0.63; H E= 0.82 and PIC = 0.48) and Ramos et al. (Reference Ramos, Vasconcelos de Macêdo, Lopes, Batista, Formiga, Pimentel da Silva, Saulo-Machado and Veassey2012) (H o= 0.87 and H E= 0.76) were comparatively higher. As these markers were originally designed for the latter three species, a higher number of alleles, higher heterozygosity and PIC were expected than when analysing with A. aculeata. These explain the species, genome and locus specificity of the SSRs as already discussed by Powell et al. (Reference Powell, Morgante, Andre, Hanafey, Vogel, Tingey and Rafalski1996) and Pinheiro et al. (Reference Pinheiro, Palma-Silva, Barros and Cozzolino2009); which increased the success of cross-amplification.
The average polymorphic loci (P= 71.2%) per provenance obtained in our study imply that SSRs are powerful molecular markers for assessing genetic diversity in A. aculeata populations. Besides, the markers used in this study are informative based on Bostein et al.'s (Reference Bostein, Whiter, Skolnick and Davis1980) classification of SSRs using PIC values (Table 3). Nevertheless, the polymorphism level reported here is still relatively lower than a RAPD (random amplified polymorphic DNA) polymorphism (79%) obtained in the same species (Oliveira et al., Reference Oliveira, Júnior-Melo, Brandão, Rodrigues, Menezes and Ferreira2012). This could be explained by the lack of amplification products in some samples at certain SSR loci in the cross-amplification. Lack of amplification of an allele in certain accessions can be the result of null alleles potentially caused by PCR failure, the quality and quantity of DNA used, heterozygote deficits, scoring errors due to stuttering bands or other possible causes (Roa et al., Reference Roa, Chavarriaga-Aquire, Dugue, Maya, Bonierbale, Iglesias and Tohme2000; Dakin and Avise, Reference Dakin and Avise2004). Hence, null alleles can no longer be detected by the primer, leading to an influence on the polymorphism level of SSR markers.
Our tests for the null allele showed evidence for the presence of null alleles across the loci (Table 4). The null allele frequency varied highly among the loci across the provenances demonstrating that the effects of the null alleles are locus specific (Dakin and Avise, Reference Dakin and Avise2004). As we observed from our results, loci with high heterozygote deficits showed stronger null allele frequency than loci with less heterozygote deficits (Tables 3 and 4). According to Chakraborty et al. (Reference Chakraborty, De Andrade, Daiger and Budowle1992), inbreeding causes significant heterozygote deficits relative to HWE that might be misconstrued as evidence for null alleles. Our test for HWE showed significant deviation by most of the loci across the provenances analysed (Table 4). As discussed in the following paragraph, heterozygote deficits were detected in most of the loci analysed, which were potentially caused by inbreeding. Hence, when we compare the two results of null allele and HW tests, loci with a strong null allele frequency deviated significantly from HWE owing to their heterozygote deficits, which are one of the potential causes of null alleles leading to low polymorphism (Dempster et al., Reference Dempster, Laird and Rubin1977; Chakraborty et al., Reference Chakraborty, De Andrade, Daiger and Budowle1992).
Although A. aculeata has an apparently mixed mating system (Scariot et al., Reference Scariot, Lleras and Hay1991; Colombo et al., Reference Colombo, Nucci, Priolli, Zucchi, Carhalho, Chorfl, Siqueira and Azvedo-Filho2013), the monoecious nature of its inflorescence could favour more inbreeding, which resulted in reduced average heterozygosity per locus (Table 3). This was explained by positive inbreeding coefficients (F>0) obtained across all loci (Table 3). Substantial positive inbreeding coefficient indicates the presence of inbreeding in a given population (Hartl and Clark, 1997). A case study on jewelweed, Impatiens capensis, a common monoecious woodland flower in the Eastern US, demonstrated that the frequency of the homozygous genotypes increased with each generation of selfing, and the frequency of heterozygotes decreased (Stratton, Reference Stratton2008).
As described in the study by Zaki et al. (Reference Zaki, Singh, Rosli and Ismail2012), amplification may not always represent functional SSRs for target species from cross-amplification. The PCR products of the markers need to be cloned and sequenced with selected individuals and the amplicon sequence needs to be aligned with the original sequence from which the primers were designed. This may reveal the level of similarity and differences between the original gene sequence and the amplicon amplified by this specific locus. With this, markers can be identified based on sequence similarity in order to represent functional SSRs in the cross transferability. Therefore, it would be more appreciated if a further study will be conducted to confirm the inter-species transferability of the markers identified in this study by sequencing the amplicons and comparing with the original sequences from which the primers were designed.
We conclude that our investigation demonstrated the potential use of cross-species amplification to transfer SSR markers from two species of Arecaceae (A. aculeatum and E. oleifera) to the newly emerging potential oil palm species, A. aculeata. Along with the previously developed SSR markers (Nucci et al., Reference Nucci, Azevedo-Filho, Colomo, Priolli, Coelho, Mata and Zucchi2008), the SSRs identified in the present study (Aac04, Aac12, sMo00020, sMo00137, Aacu38, Aacu45 and Aacu74) could provide invaluable support to realize various studies towards the domestication of A. aculeata. They could be used to study population genetics, germplasm characterization, genetic improvement and conservation. The results also indicated that sourcing sets of SSRs from closely related taxa such as species or genus in Arecaceae could increase the success of transferring more number of functional markers. This would further facilitate comparative genetic studies between related species in Arecaceae, thus making the results directly comparative and the research more cost effective.
Supplementary material
To view supplementary material for this article, please visit http://dx.doi.org/10.1017/S1479262115000179
Acknowledgements
The authors would like to acknowledge Professor Carlos Nick for his technical help in obtaining leaf samples from Macaúba Active Germplasm Bank (BAG-Macaúba), Araponga, the State of Minas Gerais, Brazil. They are also grateful to Dra Telma, Renata D. Freitas and Éder Lanes for their unconditional assistance in Plant Biotechnology Laboratory, Universidade Federal de Viçosa. This work was financially supported by Petróleo Brasileiro S. A. (Petrobras); The academy of sciences for the developing world (TWAS) and Conselho Nacional de Desenvolvimento Científico e Tecnológico (CNPq).