


Introduction
Rapid growth in the world population calls for increased food production to meet the growing demand for calories. To this end, yields of wheat, a major staple food crop, will need to double by 2050 (Barrett, Reference Barrett2010; Dempewolf et al., Reference Dempewolf, Eastwood, Guarino, Khoury, Muller and Toll2014; Rasheed et al., Reference Rasheed, Mujeeb-Kazi, Ogbonnaya, He and Rajaram2018). The genetic diversity of wheat is restricted due to the bottleneck effect that occurred during domestication and, on the contrary, due to the limited diversity of wheat germplasm used in the breeding programmes (Cox, Reference Cox1997; Tanksley and McCouch, Reference Tanksley and McCouch1997; Wang et al., Reference Wang, Li, Zhang, Guo, Chen, Chen, Wu, Xie, Zhang, Sun, Dvorak, Luo and Liu2015; King et al., Reference King, Grewal, Yang, Edwards, Scholefield and Ashling2018; Louwaars, Reference Louwaars2018; Frank et al., Reference Frank, Riviere, Pin, Baltassat, Berthellot, Caizergues, Dalmasso, Gascuel, Hyacinthe, Hyacinthe, Montaz, Ronot and Goldringer2020). To tackle the challenges of global climate change, the genetic improvement of wheat must achieve several goals, including crop cultivation under a warmer climate (Vermeulen et al., Reference Vermeulen, Campbell and Ingram2012), tolerance to abiotic stresses (Arzani and Ashraf, Reference Arzani and Ashraf2016), resistance to pests and diseases (Summers and Brown, Reference Summers and Brown2013) and quality enhancement (Shewry, Reference Shewry2007). Therefore, there is a need for introducing new germplasm into breeding programmes to broaden the gene pool to search for new traits of agronomic interest necessary for wheat improvement (Pascual et al., Reference Pascual, Ruiz, López-Fernández, Perez-Pena, Benavente, Vazquez, Sansaloni and Giraldo2020).
Crop wild relatives constitute an enormous reservoir of genetic variation for crop improvement and are an important socio-economic resource (Maxted et al., Reference Maxted, Ford-Lloyd, Hawkes, Maxted, Ford-Lloyd and Hawkes1997, Reference Maxted, Ford-Lloyd, Jury, Kell and Scholten2006; Meilleur and Hodgkin, Reference Meilleur and Hodgkin2004; Vollbrecht and Sigmon, Reference Vollbrecht and Sigmon2005; Hajjar and Hodgkin, Reference Hajjar and Hodgkin2007; Maxted and Kell, Reference Maxted and Kell2009; Hunter et al., Reference Hunter, Maxted, Heywood, Kell and Borelli2012; Contreras-Toledo et al., Reference Contreras-Toledo, Cortés-Cruz, Costich, Rico-Arce, Magos Brehm and Maxted2019). Among cereal crops, wheat has a rich wild gene pool that wheat breeders have used as a source of agronomic characters – for example, to confer resistance to abiotic and biotic stresses (Monneveux et al., Reference Monneveux, Zaharieva, Rekika, Royo, Nachit, Fonzo and Araus2000; Lage et al., Reference Lage, Warburton, Crossa, Skovmand and Anderson2003; Maxted et al., Reference Maxted, White, Valkoun, Konopka and Hargreaves2008; Huang et al., Reference Huang, Steffenson, Sela and Stinebaugh2018; Salehi et al., Reference Salehi, Arzani, Talebi and Rokhzadi2018; Olivera et al., Reference Olivera, Rouse and Jin2019; Pour-Aboughadareh et al., Reference Pour-Aboughadareh, Omidi, Naghavi, Etminan, Mehrabi, Poczai and Bayat2019; Suneja et al., Reference Suneja, Gupta and Bains2019; Ahmadi et al., Reference Ahmadi, Pour-Aboughadareh, Fabriki Ourang, Khalili and Poczai2020). It has been reported that Aegilops spp. possess useful traits for wheat breeding, including heat and salinity tolerance (Waines et al., Reference Waines, Rafi, Ehdaie and Damania1993; Colmer et al., Reference Colmer, Flowers and Munns2006), drought tolerance (Damania et al., Reference Damania, Altunji and Dhaliwal1992; Rekika et al., Reference Rekika, Zaharieva, Stankova, Xu, Souyris, Monneveux, Nachit, Baum, Porceddu, Monneveux and Picard1998; Monneveux et al., Reference Monneveux, Zaharieva, Rekika, Royo, Nachit, Fonzo and Araus2000; Farooq and Azam, Reference Farooq and Azam2001) and resistance to several diseases and pests, such as rust (Mihova, Reference Mihova1988; Liu et al., Reference Liu, Zhang, Yan, Lan and Zheng2010; Olivera et al., Reference Olivera, Kilian, Wenzl and Steffenson2013; Huang et al., Reference Huang, Steffenson, Sela and Stinebaugh2018), powdery mildew (Buloichik et al., Reference Buloichik, Borzyak and Voluevich2008), cereal aphid (Holubec and Havlıckova, Reference Holubec and Havlıckova1994) and barley yellow dwarf virus (Makkouk et al., Reference Makkouk, Comeau and Ghulam1994).
Aegilops tauschii Coss. is found in Iran, westwards to Turkey and eastwards to Afghanistan and China, with a centre of distribution in the south of the Caspian area in Iran (van Slageren, Reference Van Slageren1994). Therefore, these areas are an important source of diversity for discovering useful genes to transfer into modern cultivars (Gholamian et al., Reference Gholamian, Etminan, Changizi and Khaghani2019). Accurate assessment of genetic diversity among Aegilops spp. populations can be valuable in bread wheat breeding to create segregating progenies with maximum genetic variability for further selection (Lesniowska-Nowak et al., Reference Lesniowska-Nowak, Okon and Wieremczuk2021). Molecular markers are an efficient tool for assessing genetic diversity and relationships among plant genetic materials (Tian et al., Reference Tian, Shi, Ma, Nasir, Li and Phan Tran2018).
Inter-simple sequence repeat polymorphism (ISSR) markers are common molecular techniques that amplify sequences between microsatellite loci (SSRs). This technique is widely used in diagnosing polymorphism, extensively distributed across the genome (Reddy et al., Reference Reddy, Sarla and Siddiq2002). Start codon targeted (SCoT) polymorphism is a gene-targeted marker that was developed based on the short conserved region flanking the start codon (ATG) in plant genes (Collard and Mackill, Reference Collard and Mackill2009). This marker system is dominant and reproducible and can generate more information related to different traits than random DNA markers (Mulpuri et al., Reference Mulpuri, Muddanuru and Francis2013).
Research has shown that exploitation of the genetic diversity of Ae. tauschii has been far less than its vast genetic potential to date (Cox et al., Reference Cox, Wu, Wang, Cai, Zhong and Fu2017). Concerning the importance of Ae. tauschii as valuable germplasm for wheat breeding programmes, any introduction of new samples and their study is important. Besides, the identification of high-resolving DNA-based markers is of paramount importance to unlock the potential of genetic diversity and selection of unique accessions. Hence, the objectives of this study were (i) to evaluate the genetic diversity and population structure of the Ae. tauschii accessions using ISSR (as an arbitrary technique) and SCoT (as a gene-targeting technique) markers, and (ii) to compare the level of information provided by ISSR and SCoT markers to assess genetic similarities among the investigated accessions. This study provides baseline data on the population structure and genetic information of Ae. tauschii which could be useful and informative for further breeding programmes.
Materials and methods
Plant materials and DNA extraction
In this study, a total of 90 Ae. tauschii accessions collected from natural habitats in a range of countries such as Iran, Turkey, Azerbaijan and Afghanistan were used. All genetic materials are maintained and available in the Ilam University Genebank (IUGB). Additional information about the eco-geographical distribution of these accessions is presented in online Supplementary Table S1. After 2–3 weeks, growing seedlings were collected from each plant sample and immediately transferred to a freezer (−20°C) to prevent deterioration. The total genomic DNA of each accession was extracted from leaves following a modified cetyl-trimethyl-ammonium bromide (Doyle and Doyle, Reference Doyle and Doyle1987) method. DNA concentration and its quality were measured using spectrophotometry and 1.5% agarose gel.
ISSR amplification
According to the Biotechnology Laboratory of the University of British Columbia, Canada, 15 ISSR primers were designed to evaluate the genetic diversity of 90 accessions of Ae. tauschii. The polymerase chain reactions (PCR) were run in a total volume of 20 μl containing 2 μl of isolated DNA from each sample, 2 μl PCR buffer and 12.6 μl ddH2O (double-distilled water), 1.2 μl of each primer, 0.4 ml dNTPs mix, 0.3 μl Taq polymerase and 1.5 ml MgCl2. The ISSR amplification cycles consisted of an initial DNA denaturation at 94°C for 5 min followed by 30 cycles of denaturation at 94°C for 1 min, annealing at 40°C for 45 s and extension 72°C for 2 min with a final extension at 72°C for 7 min. Amplified fragments were separated on 1.5% (w/v) agarose gel using 1× TBE buffer stained with the safe view and finally visualized under a gel documentation system (Syngene, UK).
SCoT amplification
Twelve SCoT primers were designed according to Collard and Mackill (Reference Collard and Mackill2009). PCRs were carried out in 20 μl volumes containing 2 μl of isolated DNA from each sample, 10 μl master mix PCR (ready-to-use PCR master mix 2×), 2 μl of each primer and 6 μl ddH2O. The mixtures subjected to PCR on a thermal cycler, programmed for an initial denaturing of 5 min at 94°C, followed by 45 cycles of 45 s at 94°C, 45-s annealing at 45°C, 90-s extension at 72°C and 7 min for a final extension at 72°C. Amplified products were analysed by gel electrophoresis in 1.5% agarose in 1× TBE buffer; gels were stained with the safe view and digitally documented under ultraviolet light in a Trans-illuminator system (Bio-Rad, Hercules, California).
Data analysis
All marker-based PCRs were repeated three times using independent DNA extractions to confirm the reproducibility of the bands. The obtained banding patterns were scored as present (1) or absent (0) based on a size comparison with the standard (2000 bp DNA Ladder Plus). Several useful parameters such as polymorphism information content (PIC), marker index (MI), effective multiplex ratio (EMR) and resolving (R p) were calculated using the following equations as suggested by Prevost and Wilkinson (Reference Prevost and Wilkinson1999) and Varshney et al. (Reference Varshney, Chabane, Hendre, Aggarwal and Graner2007):
 $${\rm PIC} = 1- S( P_{ij}) ^2$$
where Pij is the frequency of the ith pattern showed by the jth primer aggregated across all patterns revealed by the primers.
 $${\rm EMR} = n\beta $$
where n and β are the total numbers of bands and number of polymorphic bands.
 $$\eqalign{{\rm MI} = &\ {\rm EMR} \times {\rm PIC} \cr R_{\rm P} = &\ \Sigma I_{\rm b}} $$
where I b is band informativeness and I b = 1 − [2 × (0.5 − p)], where p is the proportion of accessions containing the bands.
The number of observed alleles (N a), the effective number of alleles (N e) and the expected heterozygosity (H e) for each population were obtained following the methodology of Lynch and Milligan (Reference Lynch and Milligan1994). Shannon's information index (I) was estimated using the procedure suggested by Brown and Weir (Reference Brown, Weir, Tanksley and Orton1983). Two separate dendrograms were illustrated for ISSR and SCoT primers through the neighbour-joining (NJ) algorithm using Tree view software based on the Jaccard's similarity coefficients. To evaluate the patterns of variation among individual samples, principal coordinates analysis was performed using GenAlEx 6.3 software (Peakall and Smouse, Reference Peakall and Smouse2006). The analysis of molecular variance (AMOVA) was implemented in GenAlEx to partition genetic variation between and within populations. The F-value (F st) from the AMOVA analysis was computed using POPGENE version 1.32 (Yeh et al., Reference Yeh, Boyle, Yang, Ye, Mao and Yeh1999).
Results
ISSR and SCoT polymorphism
All tested ISSR and SCoT primers were polymorphic and reproducible. The results of the informativeness parameters for each primer are shown in Table 1. Fifteen selected ISSR primers produced 168 distinct bands, out of which 118 (70.2%) bands were polymorphic. The number of bands per primer ranged from 6 (ISSR27) to 16 (ISSR1), with an average of 11.2 per primer. In this experiment, primer ISSR28 showed the highest PIC (0.488), while the lowest PIC (0.403) was found for primer ISSR1. The highest value of MI (5.98) was recorded for the primer ISSR9 and the lowest one was observed for primer ISSR27 (1.37). The overall average of MI per primer was calculated to be 3.65. The highest EMR and R p values were estimated for ISSR9 (13 and 9.31, respectively), while ISSR27 had the lowest ones (3 and 2.13, respectively). Furthermore, the average of EMR and R p parameters were 7.86 and 5.86, respectively (Table 1).
Table 1. ISSR and SCoT primers and their amplification results generated in the 90 Ae. tauschii accessions
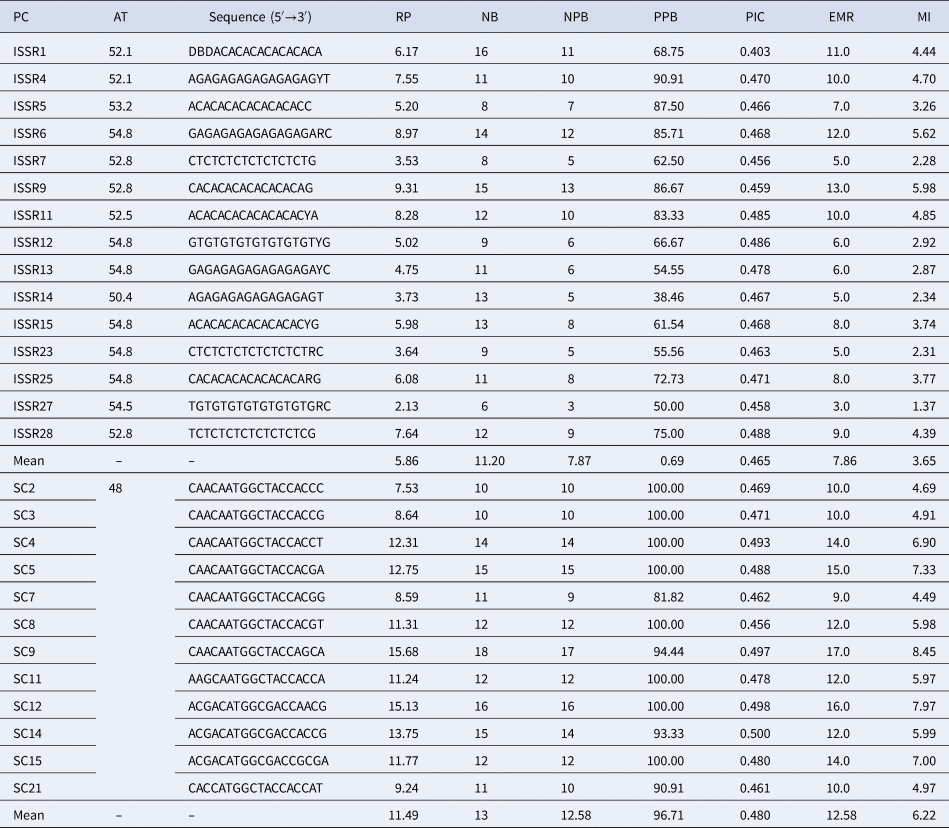
PC, primer code; AT, annealing temperature; NB, total amplified bands; NPB, number of polymorphic; PPB, percentage of polymorphic band; PIC, polymorphism information content; EMR, effective multiplex ratio; MI, marker index; RP, resolving power.
A total of 156 reliable bands were obtained for the twelve SCoT primers used, out of which 151 bands were polymorphic (96.71%). The polymorphism rate varied between 81.82% (for primers 7) and 100% (for primers SC2, SC3, SC4, SC5, SC8, SC11, SC12 and SC15). The PIC ranged from 0.46 (SC21) to 0.50 (SC14) with an average of 0.48. MI and EMR parameters ranged from 4.49 to 9 (SC9) and 8.45 to 17.0 (SC9) with an average of 6.22 and 12.58, respectively. The average R p was 11.49, and the highest value estimated for SC9 primer (15.68), whereas SC2 had the lowest ones (7.53) (Table 1).
Genetic structure of populations
In the population structure analysis, the maximum ΔK was observed at K = 2, with accessions falling into two subpopulations based on ISSR primers (Fig. 1a). If the membership fraction was below 70%, the accessions were categorized as an admixture. For ISSR, most of the accessions (76.6%) were assigned to a population with the remaining 23.4% classified as mixed. Using this method, 21 accessions were assigned to subpopulation 1 (Pop-1). Subpopulation 2 (Pop-2) contained 48 accessions, out of which 23 accessions belonged to the Gilan region and unknown areas of Iran (12 and 11 accessions, respectively), and the remaining 25 were from the other regions. The remaining 21 accessions were categorized into an admixed group as they had membership probabilities lower than 0.75 in any certain subpopulation. With the maximum membership probability, 25 accessions were distinct to Pop-1 and 65 accessions to Pop-2 (Fig. 1b).

Fig. 1. Optimum value for selected subpopulations using ISSR primers (a) and inferred structure of the Ae. tauschii germplasm based on 90 accessions for K = 2 (b).
In SCoT analysis, the maximum value of ΔK was revealed to be for K = 4 (Fig. 2a), demonstrating that all populations can be distinguished into four subgroups (Pop-1 to Pop-4). The amount of threshold value was also 0.75. The accessions, with higher rate probability, were assigned to the corresponding subgroups with others ordered as admixture, Pop-1, Pop-2, Pop-3 and Pop-4 consisted of 2, 11, 19 and 21 accessions, respectively. Thirty-seven (41%) accessions were retained to be admixture (Fig. 2b).

Fig. 2. Optimum value for selected subpopulations using SCoT primers (a) and inferred structure of the Ae. tauschii germplasm based on 90 accessions for K = 4 (b).
Genetic diversity
Based on the ISSR data, the percentage of polymorphic bands among the populations ranged from 82.20% (Pop-1) to 96.61% (Pop-2) (Table 2). Pop-1 had the highest (1.94 ± 0.03) observed number of alleles (N a), whereas the highest value of N e was recorded for Pop-2 (1.38 ± 0.03). According to the SCoT data, the percentage of polymorphism bands varied between 53.13% (Pop-1) and 91.25% (Pop-3) (Table 2). The lowest (1.29 ± 0.03) and the highest (1.43 ± 0.03) N e values were recorded for Pop-1 and Pop-3, respectively. Also, the highest N a value denoted to the Pop-3. Moreover, the highest values of the expected heterozygosity and Shannon's information index (I) were recorded in Pop-2 (H = 0.23 ± 0.01; I = 0.37 ± 0.02) using ISSR marker, and Pop-3 (H = 0.26 ± 0.01; I = 0.39 ± 0.02) using SCoT (Table 2).
Table 2. Estimated genetic variation parameters for different Ae. tauschii populations using ISSR and SCoT markers

N a, number of alleles; N e, effective number of alleles; I, Shannon's index; H e, expected heterozygosity; PPB, percentage of polymorphic band.
The total genetic diversity (H t) and genetic diversity within population (H s) parameters had a moderate value for the two marker systems. A low-genetic differentiation (G st) and a high gene flow rate (N m) were across the 90 investigated Ae. tauschii accessions based on both marker techniques. The estimated H t, H s, G st and N m values for ISSR/SCoT markers were 0.24/0.28, 0.23/0.23, 0.05/0.19 and 8.61/2.10, respectively (Table 3).
Table 3. Genetic differentiation parameters in different populations of Ae .tauschii populations using ISSR and SCoT markers

H t, total heterozygosity; H s, within-population heterozygosity; G st, genetic differentiation; N m, gene flow.
Jaccard's similarity coefficient
The dendrogram rendered using the NJ algorithm based on the ISSR data set grouped all individuals into two main clusters. Each cluster consisted of 42 and 48 accessions, respectively (Fig. 3a). The Jaccard's similarity coefficients ranged from 0.12 (between accession nos. 1 and 25) to 0.79 (between accession nos. 23 and 24). According to the SCoT dendrogram, the 90 investigated accessions were grouped into four main clusters with 30, 3, 29 and 28 accessions, respectively (Fig. 3b). The similarity coefficients varied between 0.17 (between nos. 25 and 22, 25 and 56 and 25 and 78) and 0.80 (between nos. 62 and 63, 21 and 15 and 75 and 69) (data not shown).

Fig. 3. Radial dendrogram rendered with an NJ clustering algorithm from the Jaccard's similarity coefficient among 90 Ae. tauschii accessions based on ISSR (a) and SCoT (b) markers.
Analysis of molecular variance (AMOVA)
Distribution of the total genetic variation by AMOVA for the ISSR dataset revealed that a large portion of genetic variation is referred to within populations than between them (92 versus 8%). Similarly, results of AMOVA for the SCoT markers showed that 87.68 and 12.31% of the molecular variance were associated with within and among populations, respectively (data not shown).
Discussion
In the current study, we used two molecular marker techniques to investigate genetic diversity among Ae. tauschii populations. Obtained results from ISSR analysis indicated that the average number of bands per primer was 11.20. Also, the total number of polymorphic bands was 118, with an average of 7.87 polymorphic amplicons per primer, suggesting a high level of polymorphism (Table 1). These findings were higher than those reported by Bouziani et al. (Reference Bouziani, Bechkri, Bellil and Khelifi2019) for various ISSR loci in Aegilops species. However, our estimations were smaller than that described by Konstantinos and Bebeli (Reference Konstantinos and Bebeli2010), who detected 17.1 for the average of 4–28 bands per locus in a set of Aegilops species (Ae. triuncialis, Ae. neglecta, Ae. biuncialis, Ae. geniculata, Ae. caudata, Ae. comosa and Ae. umbellulata). Furthermore, Mizuno et al. (Reference Mizuno, Yamasaki, Matsuoka, Kawahara and Takumi2010) reported a high level of genetic diversity among 122 accessions of Ae. tauschii using amplified fragment length polymorphism markers.
SCoT markers are an efficient and inexpensive technique that can provide genotypic data to evaluate genetic diversity. These markers have been successfully used to assess genetic diversity and population structure (Etminan et al., Reference Etminan, Pour-Aboughadareh, Noori, Ahmadi-Rad and Shooshtari2018; Pour-Aboughadareh et al., Reference Pour-Aboughadareh, Ahmadi, Mehrabi, Etminan and Moghaddam2018; Qaderi et al., Reference Qaderi, Omidi, Pour-Aboughadareh, Poczai, Shaghani, Mehrafarin, Nohooji and Etminan2019), identify cultivars and for quantitative trait loci mapping and DNA fingerprinting in different Aegilops species (Collard and Mackill, Reference Collard and Mackill2009; Cabo et al., Reference Cabo, Ferreira, Carvalho, Martins-Lopes, Martin and Lima-Brito2014; Ghobadi et al., Reference Ghobadi, Etminan, Mehrabi and Shooshtari2021; Khodaee et al., Reference Khodaee, Azizinezhad, Etminan and Khosroshahi2021). In the current study, SCoT was more efficient than the ISSR as it detected 96.71% polymorphic DNA markers in Ae. tauschii as compared with 69.32% for the ISSR marker system. Etminan et al. (Reference Etminan, Pour-Aboughadareh, Mohammadi, Ahmadi-Rad, Noori, Mahdavian and Moradi2016) observed 41 and 100% polymorphism with 15 ISSR and 6 SCoT primers, respectively, when analysing a mini-core collection of durum wheat germplasm, including 25 breeding lines and 18 landraces. Furthermore, the rate of observed percentage of polymorphic bands (PPBs) using SCoT system was higher than the PPB reported in other plant species such as Cocos nucifera L. with 87.2% (Rajesh et al., Reference Rajesh, Sabana, Rachana, Rahman, Jerard and Karun2015), Pistacia vera Roxb. with 91.3% (Baghizadeh and Dehghan, Reference Baghizadeh and Dehghan2018) and Triticum species with 85.30% (Guo et al., Reference Guo, Yu, Yin, Liu, Li and Wang2016). It was similar to Trichosanthes dioica accessions, which was about 92.20% (Kumar and Agrawal, Reference Kumar and Agrawal2019).
In the current study, the information obtained from markers is classified into three groups: high (PIC > 0.5), moderate (0.25 < PIC < 0.5) and low (PIC < 0.25). According to this parameter, both marker systems were moderately informative. EMR and MI can be the common measurements of efficiency in evaluating polymorphism and are considered important property of a suitable marker system to recognize among different accessions (Khodadadi et al., Reference Khodadadi, Fotokian and Miransari2011). Our results indicated that the SCoT marker had higher values of EMR and MI than ISSR markers. Our study also revealed that the mean of R P for SCoT primers was higher than ISSRs (11.49 versus 5.86), suggesting that SCoT markers may be more efficient in assessing genetic diversity in Ae. tauschii germplasm. In agreement with our findings, the superiority of SCoT markers to other DNA marker techniques (such as ISSR, SSR and RAPD-derived SCAR markers) during genetic diversity studies and fingerprinting of accessions have been observed by Rajesh et al. (Reference Rajesh, Sabana, Rachana, Rahman, Jerard and Karun2015). The higher reproducibility of SCoT than ISSR markers can be due to the higher primer lengths and subsequently higher annealing temperatures. Furthermore, sensitivity to a low rate of genetic variation provides a very effective tool for analysing population genetics on a wide range of plants (Collard and Mackill, Reference Collard and Mackill2009).
Population structure analysis using ISSR primers grouped all investigated Ae. tauschii individuals into two subpopulations. However, the admixture of the two populations was prominent within approximately all of the collection zones. Using SCoT markers, structure analysis indicated a maximum ΔK value at K = 4 and thus 90 accessions were categorized into four subpopulations. The results obtained from this analysis were consistent with results obtained from the NJ clustering. Subpopulations had also in this system an admixture of alleles, and no pure accession was observed. Many admixtures among the Pop-2 were found in the southern coastal region of the Caspian Sea, indicating that gene flow and natural hybridization frequently happened in this area. In general, our results revealed a high rate of admixture in the accessions. Previously, Arrigo et al. (Reference Arrigo, Guadagnuolo, Lappe, Pasche, Parisod and Felber2011) and Balfourier et al. (Reference Balfourier, Bouchet, Robert, De Oliveira, Rimbert, Kitt and Choulet2019) have reported a high rate of admixture in Ae. neglecta and bread wheat (Triticum aestivum L.).
Pop-2 showed the highest gene diversity using ISSR markers, while the highest gene diversity using the SCoT marker was recorded for Pop-3 followed by Pop-4, Pop-2 and Pop-1 among evaluated accessions. The highest and lowest numbers of useful alleles and Shannon's index were also obtained for Pop-2 and Pop-3 using ISSR and SCoT markers, respectively. However, the lowest values of these parameters were obtained for the Pop-1 using both marker systems. In the studies conducted by Moradkhani et al. (Reference Moradkhani, Mehrabi, Etminan and Pour-Aboughadareh2015) using ISSR markers and by Etminan et al. (Reference Etminan, Pour-Aboughadareh, Mehrabi, Shooshtari, Ahmadi-Rad and Moradkhani2019) using CAAT-box-derived polymorphism markers, a high level of genetic diversity parameters (including I, H e, H o and N e) was reported in Aegilops species – especially Ae. tauschii accessions.
In the current study, based on ISSR and SCoT systems, low-genetic differentiation and high gene flow (G st: 0.05 and 0.19; N m: 8.61 and 2.10 for ISSR and SCoT, respectively) were identified. Therefore, it can be assumed that genetic diversity among the Ae. tauschii accessions were independent of their geographical distribution. Hence, based on our results, accessions collected from different regions were distributed in different sub-clusters, indicating that agrological zones were not distinguished by cluster analysis, which is consistent with other studies, which showed that geographical separation did not necessarily result in the greater genetic distance (Laurentin and Karlovsky, Reference Laurentin and Karlovsky2006; Khan et al., Reference Khan, Pandey, Choudhary, Halli, Akkaya and Thomas2015; Zhou et al., Reference Zhou, Tian, Li, Li, Tan, Zhang, Qiu, He, Ding and Li2020). According to Pandey et al. (Reference Pandey, Das, Rai and Dasgupta2015), a cluster did not always contain accessions of the same geographical zone. Fathi et al. (Reference Fathi, Sohani, Samizadeh and Mehrabi2014) found no association between geographical origin and molecular data (Inter-retrotransposon amplified polymorphism (IRAP) patterns) through 40 Ae. triuncialis accessions collected from different geographical regions of Iran. The dispersal of thin and light seeds and pollen by the wind may contribute to the admixture of accessions in Ae. tauschii.
Based on both marker systems, the results of AMOVA also revealed a higher level of genetic variation within populations than between them. These results are similar to Arora et al. (Reference Arora, Kundu, Dilbaghi, Sharma and Tiwari2014) in wheat. The high-genetic diversity within the population could be due to different factors such as gene flow, mating system, population size and selection. In other words, the high values of gene flow observed by the two marker systems can explain the low level of variability among Ae. tauschii populations.
Conclusion
Our results showed that a large variation exists within the Ae. tauschii accessions and the patterns of genetic diversity and population structure varied across ISSR and SCoT markers. Both markers were effective at assessing the genetic diversity and differentiation parameters of a set of Ae. tauschii accessions. However, based on the informative parameters (such as R p, PIC and MI), SCoT markers were more powerful than ISSR markers. Besides, both marker types showed high gene flow and significant genetic differentiation among and particularly within accessions. Overall, our results indicate that SCoT and ISSR fingerprinting could be used to further molecular analysis in Ae. tauschii and other wild species. The investigated germplasm can be used as a diverse and important resource for further genetic analysis and linkage mapping in breeding programmes.
Supplementary material
The supplementary material for this article can be found at https://doi.org/10.1017/S147926212100040X


