Introduction
Amaranthus is an annual crop believed to have originated in the South American Andes, although some scholars believe Central America or Central Asia as its true location of origin (Das, Reference Das2016). The genus Amaranthus consists of about 60–70 species and is widely distributed throughout the world's tropical, subtropical and temperate regions. Amaranthus is mainly used both as a seed and a leafy vegetable (Venskutonis and Kraujalis, Reference Venskutonis and Kraujalis2013). The Amaranthus genus is divided into two sub-genera based on whether the species is identified as monoecious or dioecious (Sauer, Reference Sauer1967). The morphological and stem anatomy of Amaranthaceae were used to distinguish between the Amaranthus and Albersia subgenera, supporting the separation of the ‘hybridus’ group from their presumed wild progenitors (Costea and DeMason, Reference Costea and DeMason2001). Aaron et al. (Reference Aaron, Daniel, Al-Khatib and Michael2001) studied pollen variations, Adhikary and Pratt (Reference Adhikary and Pratt2015) analysed pollen and floral variations within various species, and El-Ghamery et al. (Reference El-Ghamery, Sadek and Abd Elbar2015) studied the root anatomies of 12 Amaranthus taxa.
Chloroplast (cp) is an organelle present in plant and algal cells which primarily functions in photosynthetic carbon fixation. Generally, cp genomes in angiosperms possess conserved quadripartite circular structures comprised of a large single copy (LSC) and a small single copy (SSC) region, as well as a pair of inverted repeats (IRs) (Jansen and Ruhlman, Reference Jansen and Ruhlman2012; Cho et al., Reference Cho, Cheon, Hong, Cho, Im, Mekapogu, Yu and Park2016). Cp genomes are compact in size, present less recombination and possess fewer mutations genetically. The cp genome is therefore helpful for generating genetic markers for phylogenetic classification (Birky, Reference Birky2001; Cho et al., Reference Cho, Yun, Yoon, Hong, Mekapogu, Kim and Yang2015; Hong et al., Reference Hong, Cheon, Yoo, Lee, Cho, Sih, Kim, Nam, Sohm and Kim2017). Chaney et al. (Reference Chaney, Mangelson, Ramaraj, Jellen and Maughan2016) reported that the amaranth cp genome is highly conserved at the nucleotide level among the grain amaranth species. Nonetheless, single-nucleotide polymorphisms (SNPs), insertions/deletions (InDels) and polymorphic simple sequence repeat (SSRs) of cp genome in the Amaranthus taxa have not been identified. In terms of taxonomy, Xu and Sun (Reference Xu and Sun2001) inferred that the main grain amaranthus (A. cruentus, A. caudatus, A. hypochondriacus) were mixed among these related taxa and A. caudatus and A. quitensis were very closely related, whereas A. powellii was the most divergent taxon. Stetter and Schmid (Reference Stetter and Schmid2017) reported the phylogeny of the Amaranthus genus with 94 gene bank accessions by genotyping by sequencing (GBS) and found that it did not show differences among species assignment, but could be distinguished based on the region of origin (e.g. South or Central America). Nevertheless, only a few reports exist which comparatively analyse the complete cp genome sequences of Amaranthus species.
Amaranthus was introduced in Korea at end of the 1990s. However, Amaranthus as a crop is being cultivated after 2010. The three species, A. hypochondriacus, A. cruentus and A. caudatus are mainly cultivated for seeds, but they are grown in the field without species identification. Three Amaranthus species used in this study were identified to be belonging to the Hybridus clade in previous study (Waselkov et al., Reference Waselkov, Boleda and Olsen2018).
In this study, we report the high quality complete cp genome sequences for the three Amaranthus species and conducted comparative genomic analyses using tandem repeats (TRs), InDel polymorphisms and species-level identification using valuable markers and molecular phylogenetic analysis.
Materials and methods
Plant materials
The three Amaranthus species used in this study were acquired from the Germplasm Resources Information Network (GRIN, http://www.ars-grin.gov), USA and the National Agrodiversity Center of the Rural Development Administration (http://genebank.rda.go.kr), Korea (online Supplementary Table S1 and Fig. S1). For the cp genome assembly, the A. hypocondriacus accession (A6) was the same plant materials with Chaney et al. (Reference Chaney, Mangelson, Ramaraj, Jellen and Maughan2016) as cv. Plainsma and the A. cruentus and A. caudatus accessions was A7 (PI566897) and A15 (IT19999), respectively (online Supplementary Table S1). Four, six and one accession of A. cruentus, A. caudatus and A. hypochondriacus were used for InDel markers analysis, respectively. Amaranthus plants were grown in the Highland Agriculture Research Institute (HARI), Pyeongchang, Korea. Each sample constitutes approximately 100 mg of fresh leaves harvested from a single plant.
Chloroplast genome assembly and annotation
Genomic DNA was isolated from the leaves using a NucleoSpin Plant II kit (Macherey-Nagel, GmbH, Germany) following the manufacturer's instructions. For next-generation sequencing (NGS), pair-end (PE) libraries were constructed with an Illumina PE DNA library Kit and sequenced using an Illumina genome analyzer (Hiseq200) platform at Macrogen (http://www.macrogen.com/kor/). Reads with raw scores of 20 or less were removed from the total reads using the CLC-quality trim tool. About 2.7 and 2.0 gigabases (Gb) of total and trimmed reads respectively, were generated using NGS (online Supplementary Table S2). Cp genome assembly performed using a de novo assembly was implemented by CLC Genome Assembler (ver. 4.2.1, CLC Inc., Denmark). The parameters were set from 200 to 600 bp for the distance between forward start and reverse end reads (similarity = 0.8, and length fraction = 0.5). The putative cp contigs were selected from comparison with Amaranthus hypochondriacus (GenBank acc. KX279888) cp genome sequence as a reference by the nucmer tool in the MUMmer program (ver. 3.0). Selected contigs were merged into a single contig after which, the contig junctions and inner gaps were manually confirmed by read mapping using CLC read mapper applying the similar parameters as above. The average number of mapped bases and coverage of the three Amaranthus cp genomes were 91.7 Mb and 1474×, respectively (online Supplementary Table S2). Cp genome sequences were annotated using DOGMA (Wyman et al., Reference Wyman, Jansen and Boore2004) and via manual editing using comparisons with the reference species A. hypochondriacus (GenBank acc. KX279888). Circular maps of the cp genomes were obtained using OrganellarGenomeDRAW v1.2 (Lohse et al., Reference Lohse, Drechsel, Kahlau and Bock2013).
Tandem repeat analysis
Nucleotide and amino acid diversity were analysed by BLASTN and BLASTP. TRs were analysed using Tandem Repeat Finder (Benson, Reference Benson1999) with advanced parameters. Alignment parameters match, mismatch and InDels were set to 2, 7, 7 and the minimum alignment score required to report a repeat was 50, the minimum length was 6 bp, and the motif identity percent was 100%.
InDel marker development and validation
Polymerase chain reaction (PCR) analysis was performed in 20 µl PCR mixtures containing 2× TOPsimple preMix-nTaq master mix (Enzynomics, Seoul, Korea) consisting of 0.2 U/μl n-taq DNA polymerase, 3 mM Mg2+ and a mixture containing 0.4 mM of each dNTP, with 10 pmol of each primer. The PCR reaction was performed in a thermocycler (Veriti, Applied Biosystems, CA, USA) using the following cycling parameters: 94°C (5 min); 35 cycles of 94°C (30 s), 58°C (30 s) and 72°C (1 min); and a final extension at 72°C (10 min). PCR products were analysed using 1.5% agarose gel electrophoresis and detected by DNA LoadingSTAR (DyneBio, Gyeonggi-do, Korea).
Phylogenetic analysis
In total, about 62 protein coding genes (online Supplementary Table S3) in 31 species (online Supplementary Table S4), including 30 core Caryophyllales species (one Aizoaceae, 14 Amaranthaceae, one Cactaceae and 14 Caryophyllaceae) and one outgroup (Polygonaceae; Fagopyrum tataricum) were compiled into a single file and was aligned with MAFFT v.7 (Katoh et al., Reference Katoh, Misawa, Kuma and Miyata2002). Before maximum likelihood (ML) analysis, a search for the best fitting substitution model was performed using jModeltest v. 2.1.10 (Darriba et al., Reference Darriba, Taboada, Doallo and Posada2012). Based on the Akaike information criterion (AIC) and AIC with correction (AICc), GTR + I was the best model. ML analysis was performed using RAxML v7.4.2 (Stamatakis, Reference Stamatakis2006) with 1000 bootstrap replicates and the GTR + I model. Bayesian inference was performed using MrBayes v3.0b3 (Huelsenbeck and Ronquist, Reference Huelsenbeck and Ronquist2001).
Divergence hotspot identification in Amaranthus
The cp genome sequences of total four Amaranthus species, three of which (A. caudatus, A. cruentus and A. hypochondriacus) discussed in this study and the other one (A. tricolor) published in a previous study (Viljoen et al., Reference Viljoen, Odeny, Coetzee, Berger and Rees2018), were analysed to identify the rapidly evolving molecular markers for the future phylogenetic studies of Amaranthus. The similarities among the three Amaranthus species were visualized using mVISTA (Frazer et al., Reference Frazer, Pachter, Poliakov, Rubin and Dubchak2004). Intergenic sequence (IGS) and gene regions were extracted separately from each plastid genome by applying the ‘Extract’ option in Geneious v.7.1.8 (Biomatters Ltd., Auckland, New Zealand). Homologous loci were then aligned individually using MAFFT v.7 (Katoh et al., Reference Katoh, Misawa, Kuma and Miyata2002). To analyse nucleotide diversity (Pi), the total number of mutations (Eta), the average number of nucleotide differences (K) and parsimony informative characters were determined using DnaSP v.5.10 (Librado and Rozas, Reference Librado and Rozas2009). Non-synonymous (K a) and synonymous (K s) substitution values were calculated with the PAML 4 program (Yang, Reference Yang2007). The procedure is as follows. First, we selected 62 protein coding genes and calculated K a and K s values for each gene for each species pairwise comparison (A. caudatus–A. cruentus, A. caudatus–A. hypocondriacus and A. cruentus–A. hypocondriacus). Second, we calculated the average K a and K s values for the three pairwise comparisons for each gene. Third, the ratio of K a/K s for each gene was based on the average K a and K s values from the three species comparison
Results
Complete chloroplast (cp) genome sequences
Each of the complete cp genomes of A. hypochondriacus, A. cruentus and A. caudatus consisted of a single circular molecule with a quadripartite structure (Fig. 1). The cp genome sizes of the A. hypochondriacus, A. cruentus and A. caudatus were 150,523, 150,757 and 150,523 bp, respectively. Its genome structures were comprised of a pair of IRs (IRa and IRb) separated by the LSC and one SSC region. The IRs for A. hypochondriacus, A. cruentus and A. caudatus totalled 24,352, 24,351 and 24,352 bp in length, respectively. The LSC sizes were 83,878, 84,101 and 83,878 bp, respectively, and the SSC sizes were 17,941, 17,954 and 17,941 bp, respectively (Table 1). The three genomes each contained 84 coding genes, accounting for 78,762 bp of the total genome length. Of these, 61, 6 and 12 genes were located in the LSC, IR and SSC regions, respectively (Fig. 1). The length of the coding sequences (CDS) of the three genomes was the same with 78,762 bp (average CDS length was 938 bp). The total number of RNA bases was 2704, and the overall GC-content was the same in all three genomes about approximately 36.6%. The complete cp genome sequences and Genbank files are available from the NCBI database (accession numbers MG83608, MG83606 and MG83605 for A. caudatus, A. cruentus and A. hypochondriacus, respectively). Chaney et al. (Reference Chaney, Mangelson, Ramaraj, Jellen and Maughan2016) have previously elucidated the whole genome sequence for A. hypochondriacus that was same accession, cv. Plainsman, using the PacBio RSII method, finding a total size of 150,518 bp (GenBank accession number KX279888), which was slightly (5 bp) shorter than our results indicated. And the two different sequencing platforms used which produced almost the same results. Looking at this discrepancy in further detail, we found that the 5 bp difference was located in IGSs between petL and petG in the T repeats in the LSC region (data not shown). There was a 20 bp poly T sequence identified in our study, while this same sequence was only 15 bp long in KX279888. The average sequencing coverage depth for the three genomes was 1747× (online Supplementary Table S2).

Fig. 1. The cp genome map for the three Amarant h us species. Genes shown inside the circle are transcribed clockwise and genes outside the circle are transcribed counterclockwise.
Table 1. Gene content comparison for the complete cp genomes of three Amaranthus species (A. cruentus, A. caudatus and A. hypochondriacus)

a Coding sequences.
Cp genome gene content and hotspot regions
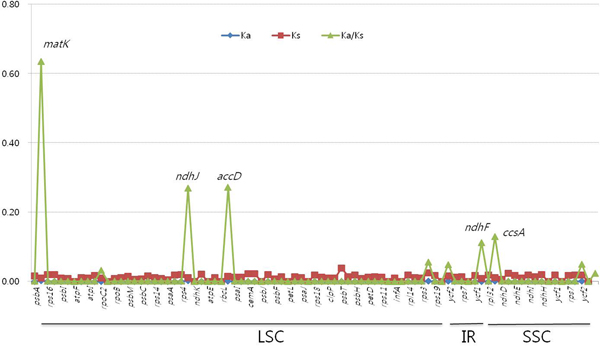
The complete cp genome genes of A. hypochondriacus, A. cruentus and A. caudatus were comparatively analysed. The gene content, order and orientation were similar in all the three species (Fig. 1). The IR/LSC and IR/SSC junction regions were compared with identify IR expansion or contraction. The trnH, rpl2, ycf1, ndhF and rps19 genes were located in the LSC/IRa, IRa/SSC, SSC/IRb (both ycf1 and ndhF) and IRb/LSC junction regions, respectively. The border position in the A. hypochondriacus cp genome was the same as that in the A. cruentus and A. caudatus cp genomes, implying the absence of IR expansion or contraction (online Supplementary Fig. S2). The coding regions of these three species were characterized to be highly conserved, presenting 99.78% homology at the amino acid level except the matK gene (Fig. 2). The overall similarity of nucleotide and amino acid sequences in the coding genes was 99.98 and 99.97%, respectively, with the IR region having the lowest identity. In general, the IR region, taken as a whole, was highly conserved compared with the LSC and SSC regions, also when each was taken as a whole. Owing to the presence of highly conserved coding regions, the K a/K s ratio was very low, approaching zero. Although the coding region is highly conserved, we observed a slight variation in the divergence of the coding genes, matK, ndhJ, accD, ndhF and ccsA, above 0.1 (Fig. 2). Among them three genes, matK, ndhJ and accD, and two genes, ndhF and ccsA were located in LSC and SSC regions, respectively.

Fig. 2. Non-synonymous (K a) and synonymous (K s) substitution rates and K a/K s values among cp genomes for three Amarant h us species. Five genes (matK, accD, ndhJ, ccsA and ndhF) showed K a/K s values greater than 0.1. LSC, large single copy; IR, inverted repeat; SSC, small single copy.
Tandem repeats analysis
The TR sequences in the cp genome were characterized and compared among the three Amaranthus species. A total of 18 TRs with various sizes and repeat unit copy numbers were identified for A. hypochondriacus and A. caudatus, whereas around 21 TRs were observed for A. cruentus. The majority of the TRs (11 in A. hypochondriacus and A. caudatus and around 14 in A. cruentus) were found in the LSC region, while six were found in the IR region for all the three species. Only one TR was observed in the SSC region (online Supplementary Table S5). The total TR length of the three genomes was 1009, 810 and 810 bp in A. cruentus, A. caudatus and A. hypocondriacus, respectively (Table 1). The average TR length was 48 bp in A. cruentus and it was 45 bp in A. caudatus and A. hypocondriacus (Table 1). Most of the InDels were located in the IR region; two InDels (both longer than 40 bp) were in the IGSs for trnK, rps16, psbM and trnD for all three species, and were 74 and 45 bp long, respectively (online Supplementary Table S6).
InDel marker analysis
We designed InDel specific primers to confirm the InDel presence in intron sequences using PCR amplification (Table 2). ClustalW analysis of the InDel region for the three species also showed that both A. caudatus and A. hypochondriacus were identical, whereas A. cruentus and A. tricolor showed a variation in both InDel regions (online Supplementary Table S6). The presence of these two InDels in the three species was further confirmed by PCR amplification. We observed no variation between A. hypochondriacus and A. caudatus, which both yielded the amplicons of 493 and 302 bp for InDel_1 and InDel_2, respectively. However, A. cruentus showed amplicons of 567 and 347 bp for InDel_1 and InDel_2, respectively. Additionally, two InDels were found in the same regions with different size in A. tricolor. The expected amplicon sizes were 458 and 253 bp in the InDel_1 and InDel_2, respectively with in silico analysis (online Supplementary Table S6). Two of the A. caudatus accessions (A14 and A18) showed variable amplicon sizes compared with the other A. caudatus accessions for both InDel_1 and InDel_2 (Fig. 3). This may be possibly due to the mis-grouping of A14 and A18 as the member of A. caudatus as the plants from which the DNA was extracted was mis-identified.

Fig. 3. PCR-amplification of InDel regions present in the cp genomes of Amaranthus hypochondriacus (A6), A. cruentus (A4, A5, A7, A8) and A. caudatus (A13, A14, A15, A16, A17, A18) with InDel specific markers. (a) InDel_1 marker. (b) InDel_2 marker. M: 100 bp DNA ladder. InDel marker information is shown in Table 2. Two of the A. caudatus accessions with asterisks (A14 and A18) showed variable amplicon sizes compared with the other A. caudatus accessions for both InDel_1 and InDel_2.
Table 2. Primer list for InDel validation for the cp genomes of four Amaranthus species

Comparison of phylogenetic relationships with previous studies
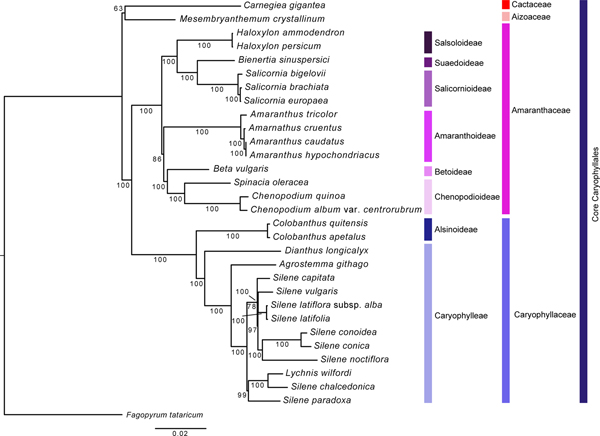
A ML analysis was carried out based on 62 protein-coding genes from 31 taxa (Fig. 4). The length of the aligned sequences was 53,661 bp. The resultant phylogenetic tree generated using the aligned sequences resulted in a well-resolved topology supporting the monophyly of the tested families and subfamilies. The ML tree generated in this study was the same as the APG IV system (The Angiosperm Phylogeny, 2009), but it showed a slight difference from what was reported in a previous study. Specifically, Cactaceae and Aizoaceae formed a clade which was a sister group to Amaranthaceae and Caryophyllaceae. Also, Amaranthoideae formed a clade with Betoideae and Chenopodioideae. In contrast, the previous study had presented Aizoaceae forming the most basal branch, followed by Cactaceae, and Amaranthoideae forming a sister group to all the other subfamilies of Amaranthaceae (Hong et al., Reference Hong, Cheon, Yoo, Lee, Cho, Sih, Kim, Nam, Sohm and Kim2017). Additionally, this study found that Chenopodioideae branched relatively late in Amaranthaceae, and A. hypochondriacus were the closest to A. caudatus. However, previous studies presented Chenopodioideae as the earliest diverging and forming a sister group to all the other subfamilies (Ogundipe and Chase, Reference Ogundipe and Chase2009), and also placed A. hypochondriacus and A. cruentus as having the closest relationship (Stetter and Schmid, Reference Stetter and Schmid2017). Although Stetter and Schmid (Reference Stetter and Schmid2017) reported that A. hypocondriacus and A. cruentus could be grouped together based on the GBS and morphology, Viljoen et al. (Reference Viljoen, Odeny, Coetzee, Berger and Rees2018) suggested that A. hypocondriacus and A. caudatus could be grouped together as leafy and grain amaranth by DNA barcoding of cp and internal transcribed sequences gene sequences similar to our result. We believe that these discrepancies would be due to the increased sequencing resolution resulting from the addition of more gene regions and using various species. However, our study analysed families, subfamilies, and species that are not relatively diverse. Therefore, in order to solve the various taxonomic problems currently unresolved, more extensive studies featuring more species would be required.

Fig. 4. Phylogenetic analysis of 31 species using 62 protein coding genes found in complete cp genome sequences. Out-group was set as Fagopyrum tataricum. The phylogenetic tree was generated using the ML method and bootstrap 1000-time iteration with MrBayes v3.0b3.
Selection of useful molecular marker regions for further phylogenetic studies
About 222 loci containing 113 genes and 109 IGS were compared among the three Amaranthus species. Sequence divergence ranged from 0 to 0.06701 (online Supplementary Fig. S3). The IR region was much more conserved compared with the LSC and SSC regions. Despite the multitude of phylogenetic studies already performed (Xu and Sun, Reference Xu and Sun2001; Ogundipe and Chase, Reference Ogundipe and Chase2009; Park Reference Park2015; Stetter and Schmid, Reference Stetter and Schmid2017), the phylogenetic relationships between Amaranthus species remain unclear. We believe that this is due to a paucity of nucleotide variations in the molecular markers used in previous studies. Indeed, the nucleotide variation in cpDNA molecular markers used in previous studies, including matK, atpB-rbcL, rpoC1 and trnL-F, was only 0.0016–0.0074. The results of this study showed that the Pi values in eight IGS regions, rps19-trnH (GUG), rps16-trnQ (UUG), psbK-psbI, psbI-trnS (GCU), trnS (GCU)-trnG (UCC), atpI-rps2, rps22-rps19 and ndhF-rpl32, had relatively high calculated values (>0.03). However, rps19-trnH (GUG) is very short, with a length of 12–23 bp, and is therefore not considered suitable as a molecular phylogenetic marker. Thus, we presume that the remaining seven regions can potentially be useful for resolving many unclear phylogenetic relationships within the genus Amaranthus.
Discussion
Complete cp genome sequences are widely used in constructing plant evolutionary relationships (Xu and Sun, Reference Xu and Sun2001). Here, we obtained the complete cp genome sequences of three Amaranthus species: A. hypochondriacus, A. caudatus and A. cruentus, and applied this information for their comparative analysis. Generally, repeat sequences are useful for studying genome rearrangement and play an important role in phylogenetic analysis (Qian et al., Reference Qian2013; Cheon et al., Reference Cheon, Kim and Yoo2017; Hong et al., Reference Hong, Cheon, Yoo, Lee, Cho, Sih, Kim, Nam, Sohm and Kim2017). As reported by Huang et al. (Reference Huang, Matzke and Matzke2013), repeat occurrence is more prevalent in IGSs compared with genic sequences, a finding which was also confirmed in the current study. TRs and SSRs may possibly be related to cp genome size variation and divergence because of recombination (Hong et al., Reference Hong, Cheon, Yoo, Lee, Cho, Sih, Kim, Nam, Sohm and Kim2017). In this study, TRs were prevalent in the LSC region and contributed to the A. cruentus cp genome being 199 bp longer than those of A. caudatus and A. hypochondriacus (Table 1 and online Supplementary Table S5). In a previous molecular phylogenetic study, Chaney et al. (Reference Chaney, Mangelson, Ramaraj, Jellen and Maughan2016) reported the assembly and annotation of the first reference-quality cp genome for the genus Amaranthus. In our study, the cp genome retained the quadripartite structure and nucleotide level was highly conserved among the grain amaranths. SNPs, InDels and polymorphic SSRs were identified and can serve as genetic markers in future studies. An earlier study showed that the Chenopodium species of Amaranthaceae formed a polyphylogenetic group (Hong et al., Reference Hong, Cheon, Yoo, Lee, Cho, Sih, Kim, Nam, Sohm and Kim2017). In the current study, cp region nucleotide diversity was relatively low (trnL (UAA)-trnF (GAA), 0.00162; matK, 0.00737; trnK-UUU, 0.00534; atpB, 0.00256; atpB-rbcL, 0.00347; rbcL, 0.00187). The level of nucleotide diversity was similar to that of Che nopodium species (trnL-trnF, 0.01918; matK, 0.00982; trnK-UUU intron, 0.01359; atpB, 0.00601; atpB-rbcL, 0.00689; rbcL, 0.00493) (Hong et al., Reference Hong, Cheon, Yoo, Lee, Cho, Sih, Kim, Nam, Sohm and Kim2017). Although the coding regions were highly conserved, three genes (matK, accD, ndhJ) from the LSC, ccsA and ndhF from the SSC returned non-synonymous to synonymous (K a/K s) values greater than 0.1 relative to other genes. The K a/K s value for matK was higher than that of the accD gene in our study, which agreed with the earlier report of Cuenoud et al. (Reference Cuenoud, Savolainen, Chatrou, Powell, Grayer and Chase2002). Comparing the nucleotide diversity amongst the three regions, the IR region was highly conserved relative to the LSC and SSC regions. Earlier reports have also shown that the IR region diverged at a slower rate compared with the LSC and SSC regions (Huang et al., Reference Huang, Matzke and Matzke2013; Wang et al., Reference Wang, Yu, Wang, Lei, Gao, Qiu and Wang2017).
Our study identified nine high sequence variations in intergenic regions as follows: rps19-trnH (GUG), rps16-trnQ (UUG), psbK-psbI, psbI-trnS (GCU), trnS (GCU)-trnG (UCC), atpI-rps2, trnG (GCC)-trnfM (CAU), rpl22-rps19, ndhF-rpl32 (online Supplementary Fig. S3). These regions were considered as useful markers for elucidating phylogenetic relationships amongst Amaranthus species. However, when selecting suitable molecular markers, the length of the amplified regions must also be considered. The five aforementioned intergenic regions, rps19-trnH (GUG), psbI-trnS (GCU), atpI-rps2, trnG (GCC)-trnfM (CAU) and rpl22-rps19, have relatively short InDels (19, 2, 6, 27 and 19 bp, respectively). Therefore, it is insufficient for reproducing nucleotide variation in various taxa (Dong et al., Reference Dong, Liu, Yu, Wang and Zhou2012; Cho et al., Reference Cho, Hong, Yun, Won, Yoon, Kwon and Mekapogu2017). The other four regions (rps16-trnQ (UUG), psbK-psbI, trnS (GCU)-trnG (UCC) and ndhF-rpl32) were suitable for use in phylogenetic analysis of Amaranthus species and helpful for evaluating unresolved phylogenetic relationships.
We applied InDel markers to validate our cp genome sequencing results against Amaranthus accessions for A. hypochondriacus (A6), A. cruentus (A4, A5, A7, A8) and A. caudatus (A13, A14, A15, A16, A17, A18). A. cruentus showed a variation in amplicon size compared with A. caudatus and A. hypochondriacus for both InDel markers. Among the A. caudatus accessions, A14 and A18 showed a complete variation in amplicon size, showing the results similar to amplicon sizes for A. cruentus. Although A14 and A18 were initially classified as A. caudatus accessions, based on InDel marker amplification results, they may belong to A. cruentus instead. Alternatively, inter-species hybridization may also be the possible reason for this observed size similarity. In nature, a number of spontaneous inter-specific hybrids have been reported among grain species (Sauer, Reference Sauer1967). Most Amaranthus hybrids exhibit relatively high levels of sterility (Gupta and Gudu, Reference Gupta and Gudu1991). However, it is possible that the parental species could hybridize relatively easily (Lanta et al., Reference Lanta, Havranek and Ondrej2003). Hence, it is expected that these markers could be present due to natural or artificial inter-specific hybridization occurring in Amaranthus taxa. The InDel markers can be identified by in silico analysis to also distinguish A. tricolor from other Amaranthus species.
Supplementary material
The supplementary material for this article can be found at https://doi.org/10.1017/S1479262118000485.
Acknowledgements
This work was carried out with the support of ‘Cooperative Research Program for Agriculture Science & Technology Development (Project No. PJ01135402),’ Rural Development Administration, Republic of Korea.
Author contribution
S-Y Hong conceived the design of the study, analysed the data and drafted the manuscript. K-S Cheon and H-O Lee performed the bioinformatics work. K-O Yoo collected and identified samples. M Mekapogu grew and collected samples of Amaranthus germplasm in HARI. K-S Cho was responsible for data analysis and writing of the manuscript. All authors read and approved the final manuscript.
Conflict of interest
The authors declare that the research was conducted in the absence of any commercial or financial relationships that could be construed as a potential conflict of interest.
Ethical statements
This study does not contain any studies with human participants or animals performed by any of the authors and hence a formal consent is not required.