


Introduction
Apricot (Prunus armeniaca L.) is one of the most important stone-fruit crops grown in temperate to subtropical regions of all continents (Yilmaz et al., Reference Yilmaz, Paydas-Kargi, Dogan and Kafkas2012). It can adapt to a variety of harsh environmental conditions, including cold stress, drought stress and reduced soil fertility, making it one of the primary choices for controlling desertification in Northern and Northwestern China (Wang et al., Reference Wang, Kang, Liu, Gao, Zhang, Li, Wu and Pang2014). It is mainly grown in the Mediterranean basin for fresh or processed usage, while in Turkey for dried fruits, and in Central Asia for nut utilization, oil extraction, and fresh consumption (Dauthy, Reference Dauthy1995; Faust et al., Reference Faust, Suranyi and Nyujto1998; Krichen et al., Reference Krichen, Audergon and Trifi-Farah2014).
Based on ecological adaptation, apricot is classified into four major eco-geographical groups: Central Asian, Irano-Caucasian, European and Dzungar-Zailij with regional subgroups (Kostina, Reference Kostina1964). The Central Asian group being the oldest and more diverse group includes local apricot from central Asia, Xinjiang, Afghanistan, Baluchistan, Pakistan and Northern India (Kashmir and Ladakh) (Kumar et al., Reference Kumar, Mishra, Singh, Kumar, Naik and Singh2009a). Most of the apricots belonging to Central Asian group are self-incompatible and have high chilling demands whereas, the Irano-Caucasian group includes mainly self-incompatible genotypes from the Caucasian region, Iran, Iraq, North Africa and some Southern European cultivars with low cold requirements (Hormaza, Reference Hormaza2002). Most recent and least variable group is European which is mainly composed of self-compatible genotypes from America, South Africa and Australia (Hormaza, Reference Hormaza2002). Both China and Central Asia are two original centres of cultivated apricot domestication, according to Vavilov (Reference Vavilov1951) and Layne et al. (Reference Layne, Bailey, Hough, Janick and Moore1996). However, native cultivars were most likely derived from wild apricot in Central Asia, and co-cultivation of the wild with domesticated forms were widely practiced in the Tianshan Mountains from Kazakhstan–Chinese border (Dzhungar-Zailij) south to Kashmir and west to Afghanistan (Vavilov, Reference Vavilov1951).
In India, apricot is commercially cultivated in Jammu and Kashmir, Ladakh, Himachal Pradesh and Uttarakhand (Sharma, Reference Sharma2000). In Jammu and Kashmir, the cultivated apricot is sporadically grown in apple orchards or government horticulture nurseries, whereas the majority of the wild apricot is found in wastelands and foothills. As such there is no specific apricot orchard maintained by the farmers in Kashmir region. However, in the Ladakh region, apricot enjoys an outstanding position with largely cultivated apricot orchards possessing the richest repository of apricot germplasm in India. Apricots of Kashmir and Ladakh belong to the Central Asian group, which is the oldest and richest in diversity among other groups (Hormaza, Reference Hormaza2002). The cultivated apricot of Jammu and Kashmir mainly comprises exotic improved cultivars and hybrid genotypes introduced recently whereas; the Ladakh region has mainly indigenous germplasm and has not witnessed any major exotic introductions (Angmo et al., Reference Angmo, Angmo, Upadhyay, Targais, Kumar and Stobdan2017). Despite the huge diversity of apricot germplasm in the Kashmir and Ladakh region, there is a lack of in-depth knowledge of genetic diversity, population structure and the relationship between the genotypes of Kashmir and Ladakh region. In earlier studies, the wild and cultivated apricot germplasm of the Kashmir and Ladakh region has been characterized based on morphological and biochemical traits (Sofi et al., Reference Sofi, Zaffar and Mir2001; Zaffar et al., Reference Zaffar, Mir and Sofi2004; Malik et al., Reference Malik, Chaudhury, Dhariwal and Mir2010; Girish et al., Reference Girish, Tsering, Dwivedi, Ashish and Srivastava2012; Bhat et al., Reference Bhat, Padder, Wani, Banday, Ahsan, Dar and Lone2013; Kumar et al., Reference Kumar, Lal and Ahmed2015; Abdul et al., Reference Abdul, Ram, Dwivedi, Dwivedi and Meena2016; Angmo et al., Reference Angmo, Angmo, Upadhyay, Targais, Kumar and Stobdan2017; Wani et al., Reference Wani, Zargar, Malik, Kashtwari, Nazir, Khuroo, Ahmad and Dar2017). Although the evaluation and description of the trait variations are important for the selection of superior genotypes but this type of characterization of apricot cultivars are time-consuming and can be influenced by environmental factors.
DNA-based molecular markers, however, provide a very useful tool for investigating and distinguishing apricot cultivars at the molecular level. Different types of molecular markers have been used to study the diversity and genetic characterization of apricots and other Prunus germplasms such as Restriction fragment length polymorphism (RFLP), Random Amplified Polymorphic DNA (RAPD), Amplified Fragment Length Polymorphism (AFLP), Simple Sequence Repeat (SSR), Inter Simple Sequence Repeats (ISSR) and Sequence-related amplified polymorphism (SRAP) markers (Hormaza, Reference Hormaza2002; Hurtado et al., Reference Hurtado, Westman, Beck, Abbott, Llácer and Badenes2002; Wünsch, Reference Wünsch2009; Ai et al., Reference Ai, Zhen and Jin2011; Yilmaz et al., Reference Yilmaz, Paydas-Kargi, Dogan and Kafkas2012; Chen et al., Reference Chen, Dong, Zhang, Wu, Zhang, Sun and Zhang2021). In Kashmir and Ladakh regions, very few studies on apricot genetic diversity have been conducted using molecular markers such as RAPD and ISSR (Kumar et al., Reference Kumar, Mishra, Singh, Kumar, Naik and Singh2009a, 2009b; Mishra, Reference Mishra2009; Mir et al., Reference Mir, Ahmed, Rashid, Wani, Sheikh, Mir, Parveen and Shah2012). However, comprehensive genetic diversity analysis and genetic relationships among the apricot germplasm of Kashmir and Ladakh have not been taken up earlier. SSR markers are more reliable than RAPDs, easier to use than AFLPs, and more polymorphic than ISSRs (Zhou et al., Reference Zhou, Mu, Ni, Liu, Li and Xu2020). In most living organisms, microsatellites have become the chosen marker for fingerprinting purposes (Goldstein and Pollock, Reference Goldstein and Pollock1997; Gupta and Varshney, Reference Gupta and Varshney2000). Being Polymerase Chain Reaction (PCR-based), easily reproducible, polymorphic, typically co-dominant and abundant in plant genomes, simple sequence repeats (SSRs or microsatellites) have become the genetic markers of choice in many plant species (Hormaza, Reference Hormaza2002; Fernandez et al., Reference Fernandez, Marti, Alonso, Espiau, Rubio and Socias2009; Dokupilová et al., Reference Dokupilová, Sturdik and Mihálik2013; Wang et al., Reference Wang, Kang, Liu, Gao, Zhang, Li, Wu and Pang2014).
Therefore, in the present study, SSR markers have been used to assess the genetic diversity and population structure of 120 genotypes of apricot collected from different locations of Kashmir and Ladakh regions. This is the first report on SSR analysis involving the large number of genotypes which in the long run will be helpful in germplasm management besides breeding programmes based on MAS.
Materials and methods
Plant materials and DNA extraction
One hundred and twenty apricot genotypes were analysed in this study, including 78 genotypes from the Kashmir region and 42 genotypes from the Ladakh region of India (online Supplementary Table S1). Overall, the genotypes were collected from 29 places in the Kashmir and Ladakh regions of India (online Supplementary Fig. S1). Young leaf tissue was collected from the trees, wiped off with 75% ethanol and kept at −80°C until DNA extraction. Genomic DNA was extracted from 100 mg of crushed frozen leaf tissue of apricot genotypes using the DNeasy Plant Mini Kit (Qiagen, Hilden GmbH, Germany), according to the manufacturer's instructions. The integrity of isolated DNA was estimated through electrophoresis using 0.8% (w/v) agarose gel with ethidium bromide staining using 1× TAE (Tris-acetate EDTA) as running buffer and the concentration was determined by using a spectrophotometer at 260 nm. High-quality DNA of these apricot genotypes were used for the assessment of the genetic diversity.
PCR reaction and SSR markers
A total of 21 SSR primers were used in this study for genetic diversity assessment including 17 distributed on prunus genome and 4 from an apricot BAC library (Vilanova et al., Reference Vilanova, Soriano, Lalli, Romero, Abbott, Llácer and Badenes2006; Dettori et al., Reference Dettori, Micali, Giovinazzi, Scalabrin, Verde and Cipriani2015) (online Supplementary Table S2). For amplification of genomic DNA, a reaction volume of 20 μl was prepared using 2 μl 10× reaction buffer, 1.5 μl MgCl2, 0.3 μl 25 mM dNTP mix, 1 μl of forward and 1 μl reverse primer (10 μM), 0.3 μl Taq polymerase (5 U/μl) (Thermo Scientific, USA), 14 μl of sterilized distilled water and 1.0 μl of template DNA (50 ng). The amplification was carried out in an Applied Biosystems thermocycler, USA by using the following PCR conditions: 94 °C 5 min; 94 °C 1 min; primer specific temperature (T m) 45 s; 72 °C 1:30 min, 35 cycles and a final extension at 72 °C 10 min and 4 °C hold. The resulting PCR products were separated on 3% (w/v) Ultrapure™ agarose (Invitrogen, USA) with ethidium bromide staining using 1× TAE (Tris-acetate EDTA) as running buffer. The reproducible and clearly amplified alleles were scored visually according to their fragment size in base pairs (bp) corresponding to the 50 bp Plus molecular weight marker (Thermo Scientific, USA).
Data analysis
Data generated from the molecular screening was used for analysing various parameters by different techniques. The efficiency of SSR markers in identifying genotypes, their differentiation and diversity analysis was evaluated by the following parameters: number of bands (NB), number of polymorphic bands (NPB), number of monomorphic bands (NMB), allele number (AN), marker index (MI), resolving power (RP) and polymorphism information content (PIC) (Powell et al., Reference Powell, Morgante, Andre, Hanafey, Vogel, Tingey and Rafalski1996). The major allele frequency (MAF) and gene diversity (GD) was estimated using Power Marker V3.25 (Liu and Muse, Reference Liu and Muse2005). Observed number of alleles (Na), effective number of alleles (Ne), Shannon's information index (I), observed heterozygosity (Ho), expected heterozygosity (He) and unbiased heterozygosity (uHe) was also worked out using GenAlex version 6.5 (Peakall and Smouse, Reference Peakall and Smouse2012).
Scored data were used to construct dendrogram by neighbour-joining (NJ) method from the genetic dissimilarity matrix using DARwin V.5.0.158 software (Perrier and Jacquemoud-Collet, Reference Perrier and Jacquemoud-Collet2006). Bootstrap analyses with 100 replicates were performed, and a consensus tree was obtained to measure the confidence levels for the clusters. Moreover, principal coordinate analysis (PCoA) was also conducted by using DARwin software. To define the number of clusters and to infer the genetic structure in the data set, model-based cluster analysis was performed using STRUCTURE software version 2.3.4 (Pritchard et al., Reference Pritchard, Stephens and Donnelly2000). The number of populations (K) was determined by using burn-ins of 50,000 Markov Chain Monte Carlo (MCMC). For every K value of 1–10 the data have been run ten times for the possibility of admixture. The most probable K value is the peak in ad hoc statistic D(K), associated with L(K) L′(K) and L″(K) statistics (Evanno et al., Reference Evanno, Regnaut and Goudet2005). In relation to the group inferred by STRUCTURE the D(K) perceives the rate of the change in the log probability of data. Besides,, STRUCTURE software was used for the construction of structure bar plots (Pritchard et al., Reference Pritchard, Stephens and Donnelly2000) and for determining genetic differentiation and F st values (Wright, Reference Wright1951). Finally, the estimation of molecular variation among and within populations was done by analysis of molecular variance (AMOVA) as implemented in GenAlex version 6.5 (Peakall and Smouse, Reference Peakall and Smouse2012).
Results
SSR polymorphism
All the 21 primers used in the present study succeeded in amplifying the 120 genotypes (Fig. 1). Marker analyses revealed high polymorphism and were thus effective in discriminating the apricot germplasm collected in the present study. Out of 21 SSRs, 18 showed 100% polymorphism whereas RPPG2-022 and RPPG5-030 showed 66.6 and 50% polymorphism respectively and no polymorphism was shown by DQ295818 (Table 1). Therefore, further data analysis (polymorphism and genetic diversity parameters) was done only for 20 markers except for DQ295818. An average of 2.8 polymorphic bands per assay unit was identified for these markers. A total number of 52 alleles with an average of 2.476 alleles per locus and band size of 150 to 350 bp were detected during the analysis. In addition, an average of 91.2% polymorphism per assay unit was identified for each SSR marker.

Fig. 1. Representative gel image showing SSR profile of 120 apricot genotypes using SSR marker RPPG3-026. Lane M shows 50 bp standard DNA ladder and lanes 1–120 represent apricot genotypes (numbers of each genotype correspond to those of online Supplementary Table S3).
Table 1. Details of 21 SSR markers giving polymorphic banding patterns in 120 apricot genotypes
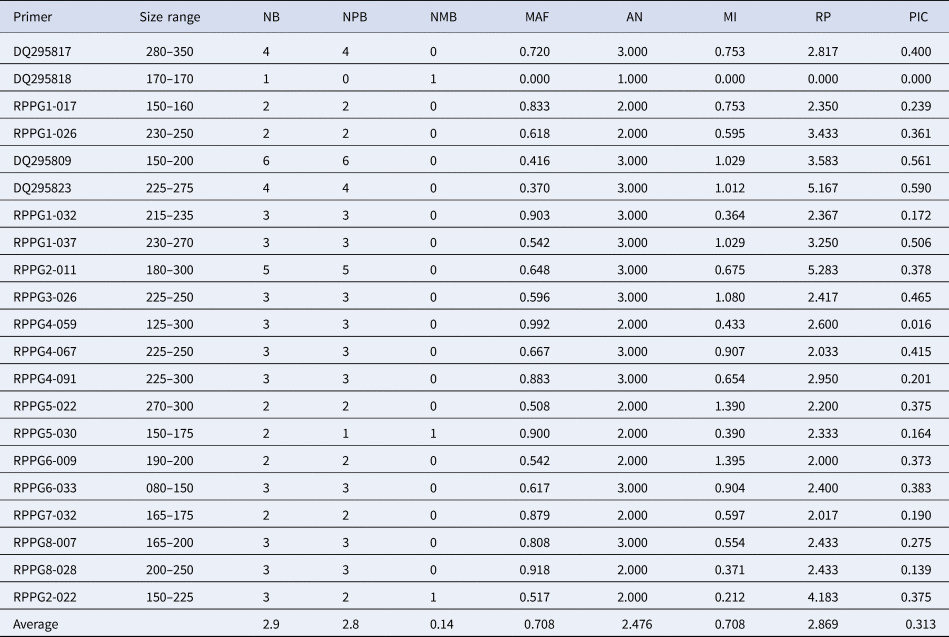
NB, number of bands; NPB, number of polymorphic bands; NMB, number of monomorphic bands; MAF, major allele frequency; AN, allele number; MI, marker index; RP, resolving power; PIC, polymorphism information content.
MAF of markers ranged from 0.370 to 0.992 with an average MAF of 0.7084. A higher MI value was observed for RPPG6-009 (1.395), similarly, highest RP of 5.283 was observed for primer RPPG2-011 while as lowest RP of 2.000 was observed for RPPG6-009 with an average value of 2.8690. The set of SSR markers analysed in this study had high PIC values, ranging from 0.016 (RPPG4-059) to 0.590 (DQ295823), with a mean value of 0.313 indicating the availability of high allelic variation in the marker and their distribution within the populations under study (Table 1).
Genetic diversity
In the present study, observed number of alleles (Na) for individual loci ranged from 1.333 for RPPG4059 to 3.000 for DQ295817, DQ295809, DQ295823, RPPG2011 and RPPG3026 with an average value of 2.317, similarly, effective number of alleles (Ne) ranged from 1.020 for RPPG4059 to 2.942 for DQ295823 with an average value of 1.720. Shannon's information index (I) varied from 0.043 for RPPG4059 to 1.088 for DQ295823 with an average value of 0.572. GD recorded in this study was in the range of 0.017 for RPPG4059 to 0.664 for DQ295823 with an average value of 0.372. The observed heterozygosity (Ho) ranged from 0.000 for RPPG6009 to 0.965 for RPPG2022, with an average value of 0.284, while as expected heterozygosity (He) varied from 0.019 for RPPG4059 to 0.660 for DQ295823 with an average value of 0.360. Also, the average value of Unbiased heterozygosity (uHe) was recorded as 0.365 varying between 0.019 for RPPG4059 and 0.669 for DQ295823 (Table 2).
Table 2. Details of genetic diversity parameters of SSR marker analysis in apricot

Na, observed number of alleles; Ne, effective number of alleles; I, Shannon's information index; GD, gene diversity; Ho, observed heterozygosity; He, expected heterozygosity; uHe, unbiased heterozygosity.
Cluster analysis and groupings
Based on the shared allelic distance with 100 bootstraps, a NJ dendrogram was generated. The genotypes under study showed a substantial spread in a dendrogram with three major clusters, revealing significant genetic diversity as represented in Fig. 2. The majority (48.3%) of the genotypes were in cluster 1 (58 genotypes) with two sub-clusters each accounting for 25.8 and 22.5% genotypes respectively, closely located on the upper part of the dendrogram. This cluster contains 21 and 37 genotypes (17.5 and 30.8%) from Ladakh and Kashmir provinces respectively. The second cluster is the smallest one among three clusters and is also divided into two sub-clusters containing 29 genotypes, making 24.16% of the total genotypes. Sub-cluster 1 contained mainly Kashmiri genotypes (20) found in Northern and Central parts of Kashmir. This sub-cluster also included seven Ladakh genotypes. The second sub-cluster contained only two genotypes which are the most widely grown cultivars in Ladakh and accounts for most dried apricot production in that region. Twelve genotypes of Ladakh and 21 cultivars of Kashmir were grouped together in cluster 3 of the dendrogram forming about 27.5% of the total genotypes used in the study. This group contains the most famous grown genotypes of Ladakh like Aam Chuli. It is considered as one of the most favoured freshly consumed apricots in the state. In addition to Aam Chuli, some other important genotypes namely Quvan Narmo, Karpo-Meen, Mamorae, Peechank Tilee Chulich, Khantay Gosmin, Nagpo Chuli, Shakanda Mangbor, Zan Chuli Narmo and Brongina, were placed in this group which accounts for most of the fresh as well as dried apricot production in the region. In general, the study revealed high levels of inter-population diversity in the selected apricot genotypes.

Fig. 2. NJ cluster of 120 apricot genotypes based on 21 SSR markers (Numbers of each genotype correspond to those of online Supplementary Table S3).
The result of PCoA for the 120 apricot genotypes using 21 SSR markers is shown in online Supplementary Fig. S2. The first two axes of the PCoA described 15.13% of the variation with eigen values of 1.406 and 1.3056 respectively. The PCoA did not show a clear separation of Kashmir and Ladakh genotypes. However, the clustering of genotypes indicated by PCoA was similar to that revealed from NJ cluster analysis.
Population structure analysis and genetic differentiation
The optimum number of sub-populations K, which explains population structure of the genotypes was 3 (K = 3) (Fig. 3(a)). At K = 3, three putative sub-populations with their belonging genotypes are depicted in Fig. 3(b). Evaluation and assignment of individuals to a group was performed according to membership coefficient Q criteria (Q ⩾ 0.60) and the output of the analysis was extracted in Structure Harvester. With Q ⩾ 0.60 to define strong assignments to groups, we observed three sub-populations that represented 26 genotypes (21.67%) of sub-population I, 38 genotypes (31.67%) of sub-population II, 28 genotypes (23.33%) of sub-population III of the total samples analysed with 28 genotypes (23.33%) showing admixtures (online Supplementary Table S3). Based on the three clusters defined by the model-based Bayesian clustering algorithm using the STRUCTURE program, significant genetic differentiation (F st) between the three sub-populations ranging from 0.0442 to 0.0529 was observed (online Supplementary Table S4). Besides, the expected heterozygosity for these three sub-populations ranged from 0.391 to 0.340 with the mean value of 0.345 (online Supplementary Table S5).

Fig. 3. Population structure among 120 apricot genotypes. (a) Estimation of best number of population (K) from an assumed range of 1–12 based on the Evanno method. (b) Estimated population structure of 120 apricot populations as revealed by 21 polymorphic SSR markers for (K = 3), Red indicates sub-population 1, green indicates sub-population 2 and blue represents sub-population 3.
Analysis of molecular variance (AMOVA)
The three sub-populations of apricot genotypes generated from structure analysis were subjected to estimation of the percentage variation among populations, among individuals and within individuals using AMOVA (Table 3). The analysis showed a significant genetic partitioning in which only 2% of the variation was recorded among the populations and 25% was found among the individuals while the highest genetic variation (73%) was observed within the individuals. In addition, for all the 21 SSRs used, the Fis value recorded was 0.251 while the Fit value observed was 0.268 (Table 3).
Table 3. AMOVA by GenALEx software

df, degrees of freedom; SS, sum of squares; MS, mean of squares; est. var., estimated variance; % var., percentage of variation.
Discussion
For the efficient use of germplasm resources, it is important to know the amount of genetic variation and the genetic relations between genotypes of a population. This also helps to establish optimal plant breeding programs, to build the genetic map, and to evaluate the Quantitative trait loci (QTLs) (Yilmaz et al., Reference Yilmaz, Paydas-Kargi, Dogan and Kafkas2012). In the present study, SSR markers were used to study the genetic diversity, relationship and population structure of 120 apricot genotypes collected from different places of Kashmir and Ladakh regions of India. The present study revealed efficient genetic information among the collected apricot genotypes. The range of AN was recorded as 1–3. Similarly, Messina et al. (Reference Messina, Lain, Marrazzo, Cipriani and Testolin2004) reported the range of AN 2–9 in 29 apricot genotypes using 20 SSR makers while Khadivi-Khub et al. (Reference Khadivi-Khub, Yarahmadi, Jannatizadeh and Ebrahimi2015) reported the range from 3 to 7. The average MAF in the present study was recorded as 0.708 and approximately 85.71% of the SSRs presented a MAF greater than 0.5. The average value of MAF was nearly similar to the findings reported by Bourguiba et al. (Reference Bourguiba, Scotti, Sauvage, Zhebentyayeva, Ledbetter, Krška, Remay, D'Onofrio, Iketani, Christen, Krichen, Trifi-Farah, Liu, Roch and Audergon2020) (0.41464) in a study on the genetic structure of a worldwide germplasm collection of apricot. The MI is a feature which elucidates the discriminatory power of a marker and therefore it was calculated for all the markers and the average value recorded was 0.708. Lamia et al. (Reference Lamia, Hedia, Jean-Marc and Neila2010) obtained an average value of 4.27 of MI per 24 SSR markers in 81 apricot accessions. Moreover, PIC which is the most important feature of a primer indicating its potential to differentiate various individuals showed an average PIC value of 0.313 per locus which is lower than 0.690 reported by Bakir et al. (Reference Bakır, Dumanoğlu, Erdoğan, Ernim and Macit2019) for wild apricots of Cappadocia region of Anatolia (Turkey) using 16 SSR markers and Bourguiba et al. (Reference Bourguiba, Audergon, Krichen, Trifi-Farah, Mamouni, Trabelsi and Khadari2012) (0.546) for apricots of Maghreb region using 24 SSR markers. The differences in these results may be due to evaluation of a different genotypes and use of different set of SSR markers.
Genetic diversity parameters including the observed number of alleles, effective number of alleles, Shannon's information index, GD, observed heterozygosity, expected heterozygosity and unbiased heterozygosity was also recorded in the present study. The average value of the observed number of alleles and effective number of alleles was recorded as 2.317 and 1.720 respectively. Compared to the SSR results of other researchers, our apricot germplasm has lower average values of observed number of alleles and effective number of alleles than Hu et al. (Reference Hu, Zheng, Ni, Miao, Zhao and Li2018) (4.6 and 3.4402), Martínez-Mora et al. (Reference Martínez-Mora, Rodríguez, Cenis and Ruiz García2009) (4 and 2) and Li et al. (Reference Li, Zhao, Miao and Zhou2014) (4.5 and 3.7726). The SSR markers used in the present study revealed the average value of Shannon's information index (0.572), which was higher than that of wild apricot germplasm of Ily Valley, West China (I = 0.458) and nearly similar to the 47 Tunisian apricots (I = 1.05) (Tian-Ming et al., Reference Tian-Ming, Xue-Sen, Zheng, Jiang-Sheng, Pei-Jun, Wen, Qing and Yan2007; Bourguiba et al., Reference Bourguiba, Krichen, Audergon, Khadari and Trifi-Farah2010a). In the present study, observed heterozygosity ranged from 0.000 to 0.965 with an average value of 0.284. Seven markers showed higher observed heterozygosity (0.301 to 0.965) than the mean value of 0.284 indicating that the studied population has high genetic variability and may possess a high level of genetic variations of any useful adaptive traits. Our results of observed heterozygosity values were higher than the previous studies conducted on 183 apricot accessions from North Africa using 24 SSR markers (Ho = 0.129 to 0.855; Bourguiba et al., Reference Bourguiba, Batnini, Krichen, Trifi-Farah and Audergon2017) and 39 Iranian apricot cultivars using 10 SSR markers (Ho = 0.33 to 0.87; Raji et al., Reference Raji, Jannatizadeh, Fattahi and Esfahlani2014). Furthermore, the value of expected heterozygosity recorded in the present study ranged from 0.019 to 0.660 with an average value of 0.360, and 12 markers showed higher values (4.000) than the average value of 0.360. The values of average, as well as the range of expected heterozygosity reported in present study is in agreement with a range of expected heterozygosity values (0.04 to 0.870) reported in apricot by several workers (Bourguiba et al., Reference Bourguiba, Krichen, Audergon, Khadari and Trifi-Farah2010a, 2010b, 2012). The Values of Na, Ne, I, Ho and He revealed that markers used in the present study were useful to discriminate the 120 apricot genotypes and rich genetic diversity exists in the apricot germplasm of Kashmir and Ladakh regions of India.
The studies on the genetic diversity, relationship and population structure of apricot germplasm are an essential aspect for the utilization, conservation and exploration of parent combinations for plant breeding programs (Li et al., Reference Li, Liu, Wang, Zhang, Fan, Zhang, Wang and Liao2020). Moreover, details on the genetic relationship of the collected germplasm could be used in the identification of superior as well as parental genotypes to expand genetic material and to improve the apricot germplasm. The present study includes almost all of the genotypes from Kashmir and Ladakh regions with a more diverse group of genotypes than in earlier studies conducted by Kumar et al. (Reference Kumar, Mishra, Singh, Kumar, Naik and Singh2009a, Reference Kumar, Mishra, Singh, Naik, Dwivedi, Ahmad and Singh2009b); Mishra, (Reference Mishra2009); and Mir et al. (Reference Mir, Ahmed, Rashid, Wani, Sheikh, Mir, Parveen and Shah2012) using mostly RAPD and few ISSR markers. Therefore, this is the first report on genetic diversity analysis of such large apricot germplasm using microsatellite SSR markers. In the present study, the genetic diversity, their relationship and population structure based on 21 informative SSR loci of 120 apricot genotypes were studied by three clustering approaches; NJ dendrogram, PCoA plot and population structure analysis.
Based on the dendrogram, the genotypes under study exhibited substantial spread with three major clusters, revealing significant genetic diversity. The majority of the genotypes were grouped in cluster 1 (58 cultivars), whereas, the second cluster is the smallest among three clusters containing only 29 genotypes in which most of the genotypes were from the Kashmir region. Similarly, 12 genotypes of Ladakh and 21 genotypes of Kashmir were grouped together in cluster 3. However, few apricot genotypes from the Kashmir region such as those from Srinagar, Ganderbal, Kupwara and Bandipora formed a small cluster with few genotypes from the Ladakh region. Thus, genotypes collected from different geographical places are clustered together in the same group suggesting that the clustering was independent of the geographical location which indicates that most of the genotypes have a common gene pool. As apricot trees from the Ladakh region are the main source of most of the genotypes of the Kashmir region, a clear separation of Kashmir apricot genotypes from Ladakh apricot genotypes was not observed. Mir et al. (Reference Mir, Ahmed, Rashid, Wani, Sheikh, Mir, Parveen and Shah2012) using RAPD markers also reported the clustering of apricots of Kashmir and Ladakh regions in a common group. Moreover, from the dendrogram analysis, it was observed that there is not any genotype with different names used in different geographical locations of Kashmir or Ladakh region (Synonym) while as it was found that there are some genotypes with the same names (Homonyms) such as Boett Cher which is a common name to most of the sweet kernelled apricot found in different places of the Kashmir region. The results produced by PCoA are generally similar with the results of the UPGMA dendrogram. The PCoA did not show a clear pattern of clustering according to the place of their collection and therefore geographical differentiation was not observed. However, due to the use of different algorithms, there were some slight differences in the PCoA structure analysis.
Population STRUCTURE analysis showed almost similar results as revealed in the dendrogram as well as in the PCoA. The STRUCTURE analysis did not identify the populations according to the geographical locations. Based on the maximum mean probability of likelihood value of L (K) = 0.60, determined from STRUCTURE through individual membership coefficient at K = 3, led to the confirmation of three (K = 3) sub-populations in 120 apricot genotypes. Among the 120 genotypes, most of the genotypes fall into sub-population II (31.67%), followed by sub population III (23.33%) and sub population I (21.67%). In addition, 23.33% of genotypes were admixtures. However, previous studies have divided apricot populations into 2–4 sub-populations (Li et al., Reference Li, Zhao, Miao and Zhou2014; Gürcan et al., Reference Gürcan, Öcal, Yılmaz, Ullah, Erdoğan and Zengin2015; Khadivi-Khub et al., Reference Khadivi-Khub, Yarahmadi, Jannatizadeh and Ebrahimi2015). In the present study, the percentage of admixtures highlights the gene flow between the apricot germplasm of Kashmir and the Ladakh regions. Similar results of having a large number of admixtures were also reported in other crops such as finger millet (Dida et al., Reference Dida, Wanyera, Dunn, Bennetzen and Devos2008; Ramakrishnan et al., Reference Ramakrishnan, Ceasar, Duraipandiyan, Al-Dhabi and Ignacimuthu2016), and cucumber (Dar et al., Reference Dar, Mahajan, Lay and Sharma2017).
AMOVA showed that there is a significant variation present among and within the populations. The percentage of variation within the individuals (73%) was higher than among the individuals (25%) while the percentage of variation among the populations was only 2%. Our results are highly similar to Bourguiba et al. (Reference Bourguiba, Audergon, Krichen, Trifi-Farah, Mamouni, Trabelsi and Khadari2012) and Hu et al. (Reference Hu, Zheng, Ni, Miao, Zhao and Li2018) who recorded a lower level of molecular variance among the populations rather than within the population.
Conclusion
The present study is the first major effort to characterize 120 apricot genotypes of the Kashmir and Ladakh regions of India. A high level of polymorphism among apricot genotypes was shown by 21 SSR markers used. These markers proved to be efficient and informative to evaluate the diversity and genetic differentiation of the collected apricot genotypes. In addition, these markers turned out to be ideal tools for the identification of some homonym genotypes. Furthermore, the analysis of the genetic diversity and population structure of collected apricot germplasm facilitated better understanding of gene exchange and domestication. Taken together, these SSR markers will provide new insights for a relatively accurate understanding of the genetic diversity and relationship of apricot germplasm, which is crucial for the identification and utilization or molecular marker-assisted selection for breeding systems.
Supplementary material
The supplementary material for this article can be found at https://doi.org/10.1017/S1479262121000459
Acknowledgements
This work was supported by the Department of Biotechnology (DBT), Govt. of India under grant No. BT/PR11394/PBD/16/1077/2014. The authors are highly grateful to the State Horticultural Department for necessary permissions. Furthermore, the authors acknowledge support of HDOs of Zakura, Lar and Zainapora, Baramulla for their support and co-operation. The authors also acknowledge Director CITH Rangreth, Srinagar for their cooperation and support. Finally, we sincerely thank all apricot growers of Kashmir and Ladakh for allowing sample collections during our field surveys.
Conflict of interest
The authors declare no conflict of interest.


