Introduction
Plant germplasm utilization and conservation rely on the understanding of the wealth of genetic variation in the genome. The knowledge of allelic variation is indispensable to breeders and conservationists as it reflects the raw material upon which selection acts. The advent of molecular genetic markers increased the resolution of genetic variation to levels not attainable in the past, especially regarding perennial woody species with complex genomes that are at relatively early stages of domestication.
Prunus avium L. (sweet cherry trees and wild cherries used for their excellent wood) is such an example. Cherries are thought to have originated in the Caucasus areas and are currently found across mainland Europe and western Asia (Webster, Reference Webster, Webster and Looney1996). P. avium was apparently first cultivated in Greece (Marshall, Reference Marshall1954) and is currently one of the most popular tree crops in the country (Koukouroyiannis, Reference Koukouroyiannis1996). Almost 73% of the sweet cherry fresh market production is concentrated in northern Greece, particularly in the region of Central Macedonia, Edessa district (50% of the total). Suitable environmental conditions and a demanding export market have resulted in the rapid increase of sweet cherry yield. Cherries are appreciated in local and international markets because of the fruit and the traditional agricultural practices used. However, confusion still exists concerning local cultivars used in production and their trueness-to-type.
Cherry cultivar identification has traditionally been based on morphological and phenological traits (UPOV, 1976; IPGRI, 1985). Nevertheless, phenotypic characteristics are influenced by environmental factors which may cause elevated diversity in scoring desirable traits, thus lowering their reliability (Aravanopoulos, Reference Aravanopoulos1999). DNA markers permit a far more precise identification of individuals and present a great potential for the characterization of economically important germplasm. Isoenzymes (Beaver et al., Reference Beaver, Iezzoni and Ramm1995; Granger, Reference Granger2004) and random amplified polymorphic DNAs (RAPD) (Gerlach and Stosser, Reference Gerlach and Stosser1997) were initially used to identify unique genotype profiles in P. avium. Recently, simple sequence repeats (SSRs or microsatellites) designed for peach (Prunus persica) have been used to amplify loci in other Prunus species, such as P. dulcis (almond), P. armeniaca (apricot), P. domestica (plum) and P. avium, and have been recommended for use in comparative mapping within Rosaceae (Cipriani et al., Reference Cipriani, Lot, Huang, Marrazzo, Peterlunger and Testolin1999; Sosinski et al., Reference Sosinski, Gannavarapu, Hager, Beck, King, Ryder, Rajapakse, Baird, Ballard and Abbott2000; Clarke et al., Reference Clarke, Sargent, Boskovic, Belaj and Tobutt2009). Because SSR-flanking sequences are conserved between P. persica and P. avium (Wunsch, Reference Wunsch2009), SSR primers developed for P. persica were an obvious choice for use in P. avium (Cipriani et al., Reference Cipriani, Lot, Huang, Marrazzo, Peterlunger and Testolin1999; Dirlewanger et al., Reference Dirlewanger, Cosson, Tavaud, Aranzana, Poizat, Zanetto, Arus and Laigret2002; Schueler et al., Reference Schueler, Tusch, Schuster and Ziegenhagen2003). More recently, SSR markers isolated in sweet cherry (Clarke and Tobutt, Reference Clarke and Tobutt2003) and wild cherry (Vaughan and Russell, Reference Vaughan and Russell2004) have been used in sweet cherry genetic diversity studies (Marchese et al., Reference Marchese, Tobutt, Raimondo, Motisi, Boskovic, Clarke and Caruso2007; Lacis et al., Reference Lacis, Rashal, Ruisa, Trajkovski and Iezzoni2009).
This study reports the use of SSR markers for the identification of traditional P. avium cultivars present in the region of Central Macedonia, Greece. In addition, the extent of genetic variability including intra-cultivar variation was investigated. The null hypothesis of zero intra-cultivar variability was tested. The overall objective was to produce a molecular standard which could provide assurance of genetic identity in the handling and management of the genetic material, especially during the multiplication and distribution stages.
Materials and methods
Plant material
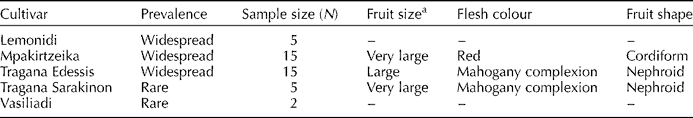
The most representative sweet cherry cultivars of the region of Central Macedonia, Greece were included in this study. The three most frequently planted cultivars, as well as two less widespread but well-known traditional cultivars, were included (Table 1). The main morphological characteristics of the cultivars upon which earlier cultivar identification was largely based are also given. Plant material was collected from the reference collection of the Pomology Institute of Naousa. Since it was not known with any degree of confidence if the widely planted cultivars represent a multiclonal assembly or a single genotype, the potential of intra-cultivar variability was assessed by sampling different individuals of the same cultivar name across the region of Central Macedonia, Greece (Table 1). Total genomic DNA was isolated according to Doyle and Doyle (Reference Doyle and Doyle1987).
Table 1 Prunus avium cultivars, their code designation, sample sizes and main morphological characteristics

–, No data.
a Fruit size: large, 7 g; very large, >9 g (Chatzicharisis et al., Reference Chatzicharisis, Mainou-Plerou, Chatzitheodorou and Kazantzis2000).
Polymerase chain reaction (PCR) amplification and electrophoresis
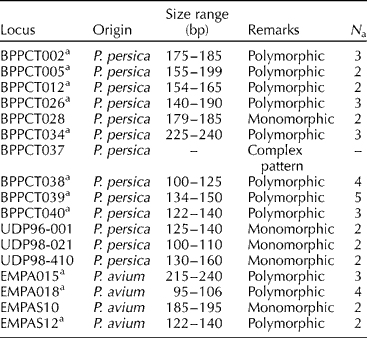
Seventeen SSR markers originating from P. avium and P. persica (Table 2) were PCR-amplified as follows: PCR buffer (20 mM Tris–HCl, 50 mM KCl), 1.5 mM of MgCl2, 200 μM of each dNTP, 0.2 μM of each primer, 0.7 U of Taq DNA polymerase (Gibco BRL) and 20 ng of P. avium genomic DNA in a 15 μl final volume. PCR reactions were performed on a GeneAmp 9600 thermal cycler (Perkin-Elmer Cetus), which was programmed to follow the conditions reported by Dirlewanger et al. (Reference Dirlewanger, Cosson, Tavaud, Aranzana, Poizat, Zanetto, Arus and Laigret2002), Clarke and Tobutt (Reference Clarke and Tobutt2003) and Vaughan and Russell (Reference Vaughan and Russell2004). PCR products were separated by electrophoresis using 3% ’Metaphor’ high-resolution agarose gels (FMC Bioproducts) in 1 × Tris–Borate–ethylenediamine tetraacetic acid buffer at 5 V/cm (Pinto et al., Reference Pinto, Vieira, de Souza and de Souza2003), stained with ethidium bromide and visualized under ultraviolet light. Fragment sizes were estimated with 10 base pair ladder DNA-sizing markers (Gibco BRL). The sizes of the bands were estimated using the UVIDocMw software (version 99.04 for Windows).
Table 2 Simple sequence repeat markers assayed and polymorphism obtained in the Prunus avium cultivars studied

bp, base pair; N a, number of alleles per locus.
a Data employed in DNA fingerprinting.
Data analysis
Probabilities of identity (P ID) and polymorphic information content (PIC) were calculated as follows:
where p i and p j are the frequencies of the ith and jth alleles and n is the total number of such alleles (Botstein et al., Reference Paetkau, Calvert, Stirling and Strobeck1980; Paetkau et al., Reference Paetkau, Calvert, Stirling and Strobeck1995). These indices provide an estimate of the discrimination ability of each microsatellite by taking into account not only the number of revealed alleles but also their relative frequencies. Hence, different values of P ID and PIC for microsatellites detecting the same number of alleles are due to their different allelic distribution (Pasqualone et al., Reference Pasqualone, Lotti and Blanco1999). P ID measures the probability that two randomly drawn diploid genotypes will be identical assuming observed allele frequencies and random assortment (Paetkau et al., Reference Paetkau, Calvert, Stirling and Strobeck1995).
Match probability (Jeffreys et al., Reference Jeffreys, Macleod, Tamaki, Neil and Monckton1991) based on allele frequencies of a natural northern Greek wild cherry population (Avramidou et al., Reference Avramidou, Ganopoulos and Aravanopoulos2007) was also calculated. A set of five loci common to this study was employed. Match probabilities for multiple loci indicate the probability that one unknown sample will match a sample drawn at random from the population. Independence within and among loci has been assumed. In addition, match probability ratio (MPR) was calculated as the square frequency of the most common allele to provide the most conservative estimate of match rate within the multicultivar assembly. Cumulative MPR was estimated as the sequential product of MPR at each SSR locus (DeNise et al., Reference DeNise, Johnston, Halverson, Marshall, Rosenfeld, McKenna, Sharp and Edwards2004). The percent polymorphic loci (P), number of alleles per locus (N a) and the observed (H o) and expected (H e) heterozygosities (assuming Hardy–Weinberg equilibrium), were calculated using the CERVUS software (Marshall et al., Reference Marshall, Slate, Kruuk and Pemberton1998). The number of effective alleles was calculated as N e = 1/(1 − H e).
The SSR-reproducible fragments were classified as present (1) or absent (0) and analyzed by the FreeTree v. 0.9.1.50 software (Hampl et al., Reference Hampl, Pavlicek and Flegr2001). The similarity of qualitative data was calculated using the Nei and Li/Dice similarity index (Nei, Reference Nei1973) and the similarity estimates were analyzed using unweighted pair group method with arithmetic mean (UPGMA). The matrices of mutual coefficients of similarity calculated by FreeTree were converted to MEGA 4 v. 4.1 software (Tamura et al., Reference Tamura, Dudley, Nei and Kumar2007), and the resulting clusters were expressed as dendrograms. The robustness of the dendrogram was assessed by bootstrap analysis running 2000 iterations, also performed by FreeTree. Principal coordinate analysis (PCoA) was executed with the GenAIEx software (Peakall and Smouse, Reference Peakall and Smouse2006). For the identification of unique genotypes, all possible pairwise comparisons between two cultivars were attempted.
Results
Eleven of the seventeen (64.7%) microsatellite primer pairs used produced stable and repeatable polymorphic amplification fragments (Fig. 1). Six primer pairs were excluded from the analysis. One (BPPCT037) presented complex banding patterns, a finding probably implying locus duplication. Five primer pairs produced monomorphic patterns (P = 0.71). The number of alleles per locus ranged from 2.00 to 5.00, with a mean of 2.82 (N e = 2.41; Table 3). PIC values ranged from 0.192 to 0.693 (average of 0.451) and P ID values ranged from 0.111 to 0.639 (average of 0.327). The most informative markers were BPPCT039 and EMPa018. The match probabilities on a per-cultivar basis were very small ranging from 2.4 × 10− 6 (cultivar Vasiliadi) to 2.0 × 10− 8 (cultivar Lemonidi). Cultivars Mpakirtzeika, Tragana Edessis and Tragana Sarakinon presented intermediate values of 1.0 × 10− 7, 2.0 × 10− 7 and 2.0 × 10− 7, respectively. The MPR was 6.1 × 10− 4 across cultivars. All individual trees sampled from different areas and bearing the same cultivar name presented the same genotype.
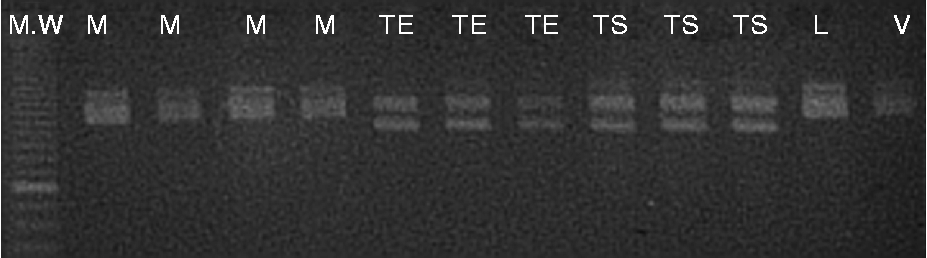
Fig. 1 Metaphor agarose gel showing the allelic profile of nuclear SSR marker BPPCT012 in the sweet cherry cultivars assayed (MW: 10 bp DNA ladder; M, Mpakirtzeika; TE, Tragana Edessis; TS, Tragana Sarakinon; L, Lemonidi; V, Vasiliadi).
Table 3 Genetic diversity of simple sequence repeat loci used on Prunus avium cultivars
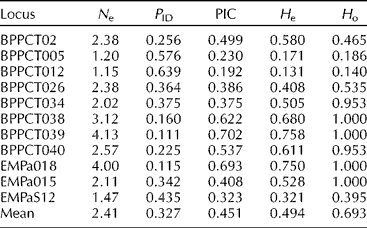
N e, effective number of alleles; P ID, probability of identity; PIC, polymorphic information content; H e, expected heterozygosity; H o, observed heterozygosity.
Expected heterozygosity ranged from 0.171 to 0.758 with an average of H e = 0.494 (Table 3). In this case, H e was equivalent to marker index based on the assumption that in microsatellites each assay reveals a single locus (Powell et al., Reference Powell, Morgante, Andre, Hanafey, Vogel, Tingey and Rafalski1996; Milbourne et al., Reference Milbourne, Meyer, Bradshaw, Baird, Bonar, Provan, Powell and Waugh1997). The observed heterozygosity ranged from 0.140 to 1.000 with a mean value of H o = 0.693 (Table 3). Pairwise comparisons showed genetic differences among cultivar pairs in a range of one to nine loci. The minimum value was observed between the Tragana Edessis and Tragana Sarakinon cultivars and the maximum between the Tragana Sarakinon and Vasiliadi cultivars (data not shown). Any two cultivars differed on average at 6.30 loci. A key for the identification of cultivars by classifying individuals according to an ascending systematic arrangement of the different SSR genotype designations was developed (data not shown).
The dendrogram generated from the UPGMA cluster analysis (Fig. 2) classified all individuals into three groups. The individuals of cultivars Tragana Edessis and Tragana Sarakinon were found closely related and were grouped together. The second group was composed of cultivars Vasiliadi and Lemonidi that appeared to have a common origin. The last group corresponded to individuals of cultivar Mpakirtzeika. The first two coordinates of the PCoA could interpret 87.38% of the total diversity observed and classified the cultivars into four groups (Fig. 3). The Tragana Edessis and Tragana Sarakinon cultivars appeared very closely associated and formed a well-defined group in this analysis as well. The Lemonidi and Vasiliadi cultivars were situated in the same quartile, while the Mpakirtzeika cultivar appeared distinctively differentiated from the other cultivars.
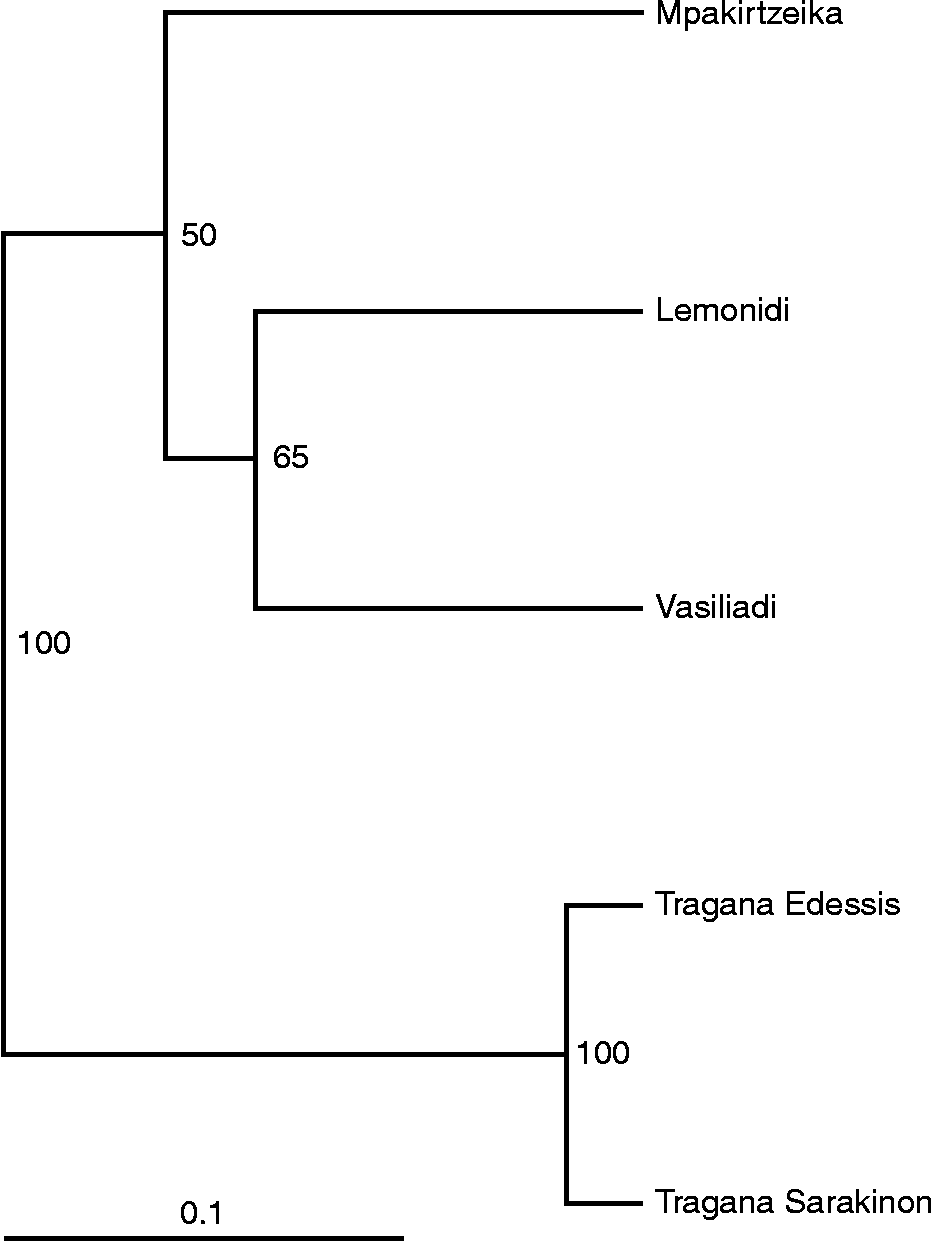
Fig. 2 Unweighted pair group method with arithmetic mean dendrogram showing similarities among five Prunus avium cultivars based on 11 simple sequence repeat loci. Numbers below branches represent bootstrapping values.
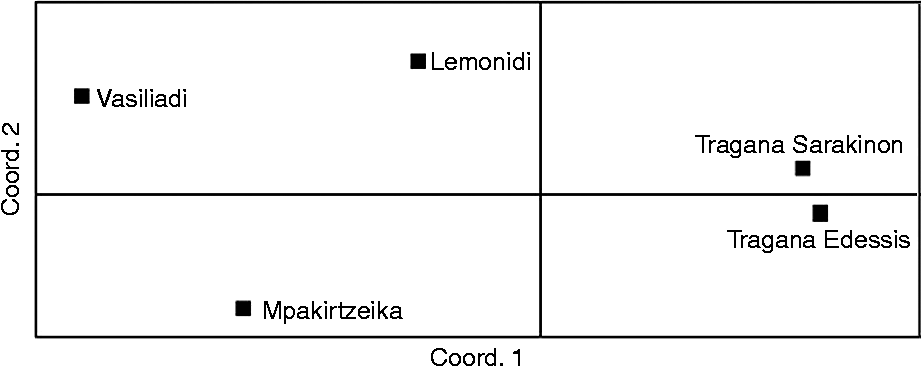
Fig. 3 Scatter plot of the first and second PCoA of the Prunus avium cultivars studied.
Discussion
The results showed a generally high degree of homology for the SSR loci between P. persica and P. avium, indicating marker transportability which agrees with other reports concerning the successful utilization of SSR markers in different Prunus species (Cipriani et al., Reference Cipriani, Lot, Huang, Marrazzo, Peterlunger and Testolin1999; Wunsch and Hormaza, Reference Wunsch and Hormaza2002; Dirlewanger et al., Reference Dirlewanger, Cosson, Tavaud, Aranzana, Poizat, Zanetto, Arus and Laigret2002; Wunsch, Reference Wunsch2009). The amount of polymorphism identified was rather low. Relatively low polymorphism was also detected by employing isoenzyme (Beaver et al., Reference Beaver, Iezzoni and Ramm1995), RAPD (Gerlach and Stosser, Reference Gerlach and Stosser1997; Stockinger et al., Reference Stockinger, Mulinix, Long, Brettin and Iezzoni1996) and SSR markers (Wunsch and Hormaza, Reference Wunsch and Hormaza2002), probably reflecting a generally narrow genetic base in cultivated sweet cherry germplasm (Wunsch and Hormaza, Reference Wunsch and Hormaza2002). The number of alleles per locus was similar to values reported in other sweet cherry studies. Clarke and Tobutt (Reference Clarke and Tobutt2003) genotyped 14 sweet cherry varieties with 19 SSR primers and detected an average of 3.30 alleles per locus. Dirlewanger et al. (Reference Dirlewanger, Cosson, Tavaud, Aranzana, Poizat, Zanetto, Arus and Laigret2002) genotyped 21 sweet cherry cultivars with 33 SSR primers and identified an average of 2.80 alleles per locus.
The absence of intra-cultivar variability was supported in cultivars Mpakirtzeika and Tragana Edessis, where the sample size was adequate for this assessment. Similar results were seen in the rest of the cultivars, although further verification is needed due to small sample sizes. In addition, the MPR indicated that the probability of another unrelated cherry tree having the same genotype was very low. Based on the values of the PIC and P ID parameters, it was evident that the polymorphism detected is adequate for the unequivocal identification of all the cultivars studied. The PIC value found in this study was nevertheless lower than other values reported for P. avium (PIC = 0.65; Marchese et al., Reference Marchese, Tobutt, Raimondo, Motisi, Boskovic, Clarke and Caruso2007) and P. persica (PIC = 0.80; Yoon et al., Reference Yoon, Liu, Song, Liu, Zhang and Li2006). Higher PIC values may be attributed to the use of more informative markers and a larger sample size with relatively more diverse genotypes (Prasad et al., Reference Prasad, Varshney, Roy, Balyan and Gupta2000). The value of locus differences between any two cultivars was high, further supporting the sufficiency of the SSR marker set in cultivar identification that was indicated by PIC and P ID. Average expected heterozygosity assuming Hardy–Weinberg equilibrium is presented to allow for comparisons with pertinent reports. It was within the range reported in earlier sweet cherry studies where expected heterozygosity averaged 0.600 (Dirlewanger et al., Reference Dirlewanger, Cosson, Tavaud, Aranzana, Poizat, Zanetto, Arus and Laigret2002), 0.460 (Clarke and Tobutt, Reference Clarke and Tobutt2003), 0.600 (Vaughan and Russell, Reference Vaughan and Russell2004) and 0.560 (Guarino et al., Reference Guarino, Santoro, De Simone and Cipriani2009).
The UPGMA dendrogram (Fig. 2) depicts two important findings: (1) absence of intra-cultivar variation in all the cultivars studied and (2) clear separation of all the cultivars except Tragana Edessis and Tragana Sarakinon. The principal component analysis scatter plot further supported the dendrogram results in a robust way, considering the high percentage of the total genetic diversity (87.4%) that was accounted for in low multivariate space. In a comparable study of apple cultivars, only 40.43% could be accounted for by the first two coordinates (Song et al., Reference Song, Zhai, Yao, Li and Du2006).
The absence of intra-cultivar variability as indicated by 11 SSR loci, especially in widespread cultivars where a higher within-cultivar sample size was used, is particularly important. Furthermore, both the match probability on a per-cultivar basis and the MPR presented very small values. Previously, there was no information on whether the sweet cherry cultivars employed in the region represent single clones or multiclonal assemblies. Their classification was so far based on the general concordance of descriptors within each cultivar and on the traditional knowledge of local growers. Therefore, the null hypothesis of zero intra-cultivar variability cannot be rejected.
The relation of cultivars Tragana Edessis and Tragana Sarakinon has also been a standing issue that was resolved with DNA fingerprinting. Cultivar Tragana Sarakinon was thought to be synonymous with the Tragana Edessis cultivar (Chatzicharisis et al., Reference Chatzicharisis, Mainou-Plerou, Chatzitheodorou and Kazantzis2000). These cultivars were grouped together in this study, a sign of their genetic affinity; however, they are not identical. Their hypothesized synonymy has to be rejected. It is likely that these cultivars either arose from the same genetic background or one arose as a mutation from the other.
DNA fingerprinting proved by far more useful than phenotypic characterization in this particular cultivar set, as it was possible to unequivocally identify all the cultivars based on a subset of the SSR loci employed. Cultivar relationships have been identified and the null hypothesis of zero intra-cultivar variability could not be rejected, resolving a long-standing question among local scientists and practitioners. Therefore, with a relatively limited number of primers, molecular identification was possible in five of the most important sweet cherry cultivars of northern Greece. To the authors’ knowledge, it is the first time that these cultivars have been DNA-fingerprinted and the absence of intra-cultivar variability was investigated. This SSR primer set could be a useful molecular tool for resolving issues of intra-cultivar variability and synonymy and for providing assurance of genetic identity in the handling and management of the local traditional genetic material.
Acknowledgements
Two anonymous referees are thanked for their constructive comments and suggestions.