
In the 100 years since the ratification of the Nineteenth Amendment to the US Constitution, women voters have shown themselves to be a dynamic force in electoral politics. Although women voters once lagged behind men in turnout, over time both the size of the female voting population and their socialization to the practice of voting have increased (Andersen Reference Andersen1996; Corder and Wolbrecht Reference Corder and Wolbrecht2016). Almost a century later, women now eclipse men in the US electorate both because of their larger proportion in the eligible population and as a function of stronger turnout behavior. At about the same time that women’s turnout began to consistently outpace that of men, a partisan gender gap also appeared. Since the 1980s, women voters supported Democratic Party presidential candidates at a higher rate than male voters (Box-Steffensmeier, DeBoef, and Lin Reference Box-Steffensmeier, DeBoef and Lin2004; Carroll Reference Carroll2006; Kaufmann, Petrocik, and Shaw Reference Kaufmann, Petrocik and Shaw2005; Norrander Reference Norrander and Whitaker2008; Sanbonmatsu Reference Sanbonmatsu and Leighley2010; see sppendix, figures A.1 and A.2). The 2016 election was no exception: the partisan gender gap was 11 percentage points, with 52% of men supporting Donald Trump against 41% of women (CAWP 2017). This partisan gender gap most often results in the conclusion that women are reliable allies of the Democratic Party.
The assumption that women are Democratic is inaccurate for the largest group of women voters, however; in fact, white women are consistent supporters of Republican Party candidates. Although a partisan gender gap in 2016 showed stronger support among women overall for Hillary Clinton, exit poll and survey data revealed that, among white women, an estimated 52% voted for Trump compared to 43% who supported Clinton. The 2016 election was not an anomaly: instead, a majority of white female voters supported the Republican Party presidential candidate in all but two elections throughout the second half of the twentieth century (Junn Reference Junn2017). Although white women support Republicans to a lesser degree than white men, they still vote majority Republican and have done so consistently in presidential elections for more than a half-century. In contrast, party preference among women of color reflects a pattern distinctive from that of white women (Tien Reference Tien2017). African American, Latina, and Asian American women voters cast their ballots heavily in favor of Democratic Party candidates for president and have done so consistently for as long as there have been reliable data for these populations.
This pattern of difference in partisan vote choice by race among women has been apparent in national election data for decades, but has been obscured by the way analysts have approached voting behavior. This article begins by identifying one practice in voting behavior analysis in need of updating: the reliance on interpreting the results for women as a deviation from the patterns shown for men. Instead, we focus on another important dimension of difference in voting by comparing variation in vote choice among women by race. We then present data summarizing partisan preferences of women in presidential elections over time using the American National Election Study (ANES). By orienting the data analysis to focus on women, we show how altering the strategy used to view and analyze data yields important conclusions relevant for understanding voter preferences that have been obscured by standard methods of analysis. We then turn our focus to the 2008, 2012, and 2016 elections to confirm that race matters in partisan vote choice among women voters, even after accounting for the effects of party identification and other individual-level factors.
Seeing the Race Gap among Women Voters
One of the reasons why political scientists have failed to see the distinct variation in partisan choice by race in female voting behavior is the established method of analyzing women in comparison to men. The use of male as the default category sets up a comparative frame of reference in which the normative position is that the baseline voter is male; consequently, the interpretation of female political behavior is the degree of deviation from that norm. This is a problematic starting position today, given that women are the modal voters in presidential elections and outnumber men in the electorate by an estimated 10 million voters. Comparing women’s political behavior to that of men as the ostensible frame of reference has contributed to an incomplete rendering of women’s vote choice, and, in so doing, it has drawn attention away from seeing and analyzing variation in voting behavior by race. When viewed from this different vantage point, it becomes clear that the gender gap is in part driven by a race gap.
Although it may seem obvious or “natural” to analyze women voters together as a group based on the notion that they vote together as a function of sex categorization, doing so obscures important heterogeneity within female voters (but see Frasure Yokley Reference Frasure Yokley2018; Huddy, Cassese, and Lizotte Reference Huddy, Cassese, Lizotte and Whitaker2008; Phillips Reference Phillips2018; Valentino, Wayne, and Oceno Reference Valentino, Wayne and Oceno2018). For example, after the release of the “Access Hollywood” video of Donald Trump during the general election campaign in 2016, many analysts predicted women voters would desert the candidate en masse. This turned out to be untrue for white female voters, a majority of whom voted for Trump. Footnote 1 The inference was based on the assumption that women would find the language and actions reflected in the video to be offensive and would therefore not cast their ballot in favor of Trump. This was true only for women of color, who supported Hillary Clinton by wide margins. Turning our attention to the variation within women voters, rather than the gender gap that defines the comparison against male behavior, the large and consistent gulf in support for Democrats by race becomes clear. The race gap is nearly 10 times the size of the partisan gender gap between white men and women. Nevertheless, it is important to note that there is still a partisan gender gap between white men and white women; in the last several elections the Republican Party has received between 5% and 6% more support from women than from men. But this difference is dwarfed by the magnitude of the variation between female voters on the basis of race.
Similar predictions of electoral misfortune were made about Alabama Republican US senate candidate Roy Moore, who was accused of inappropriate sexual behavior with young women and female children during a special election campaign in 2017. As with Trump the previous year, these revelations about Moore did not cause all women to abandon the Republican Party candidate. Instead, exit poll data show that white women were majority supporters of Moore (“Exit Poll Results,” 2017). In contrast, women of color—particularly African American female voters in Alabama— voted heavily in favor of Democrat Doug Jones, displaying a distinctive set of preferences from white women.
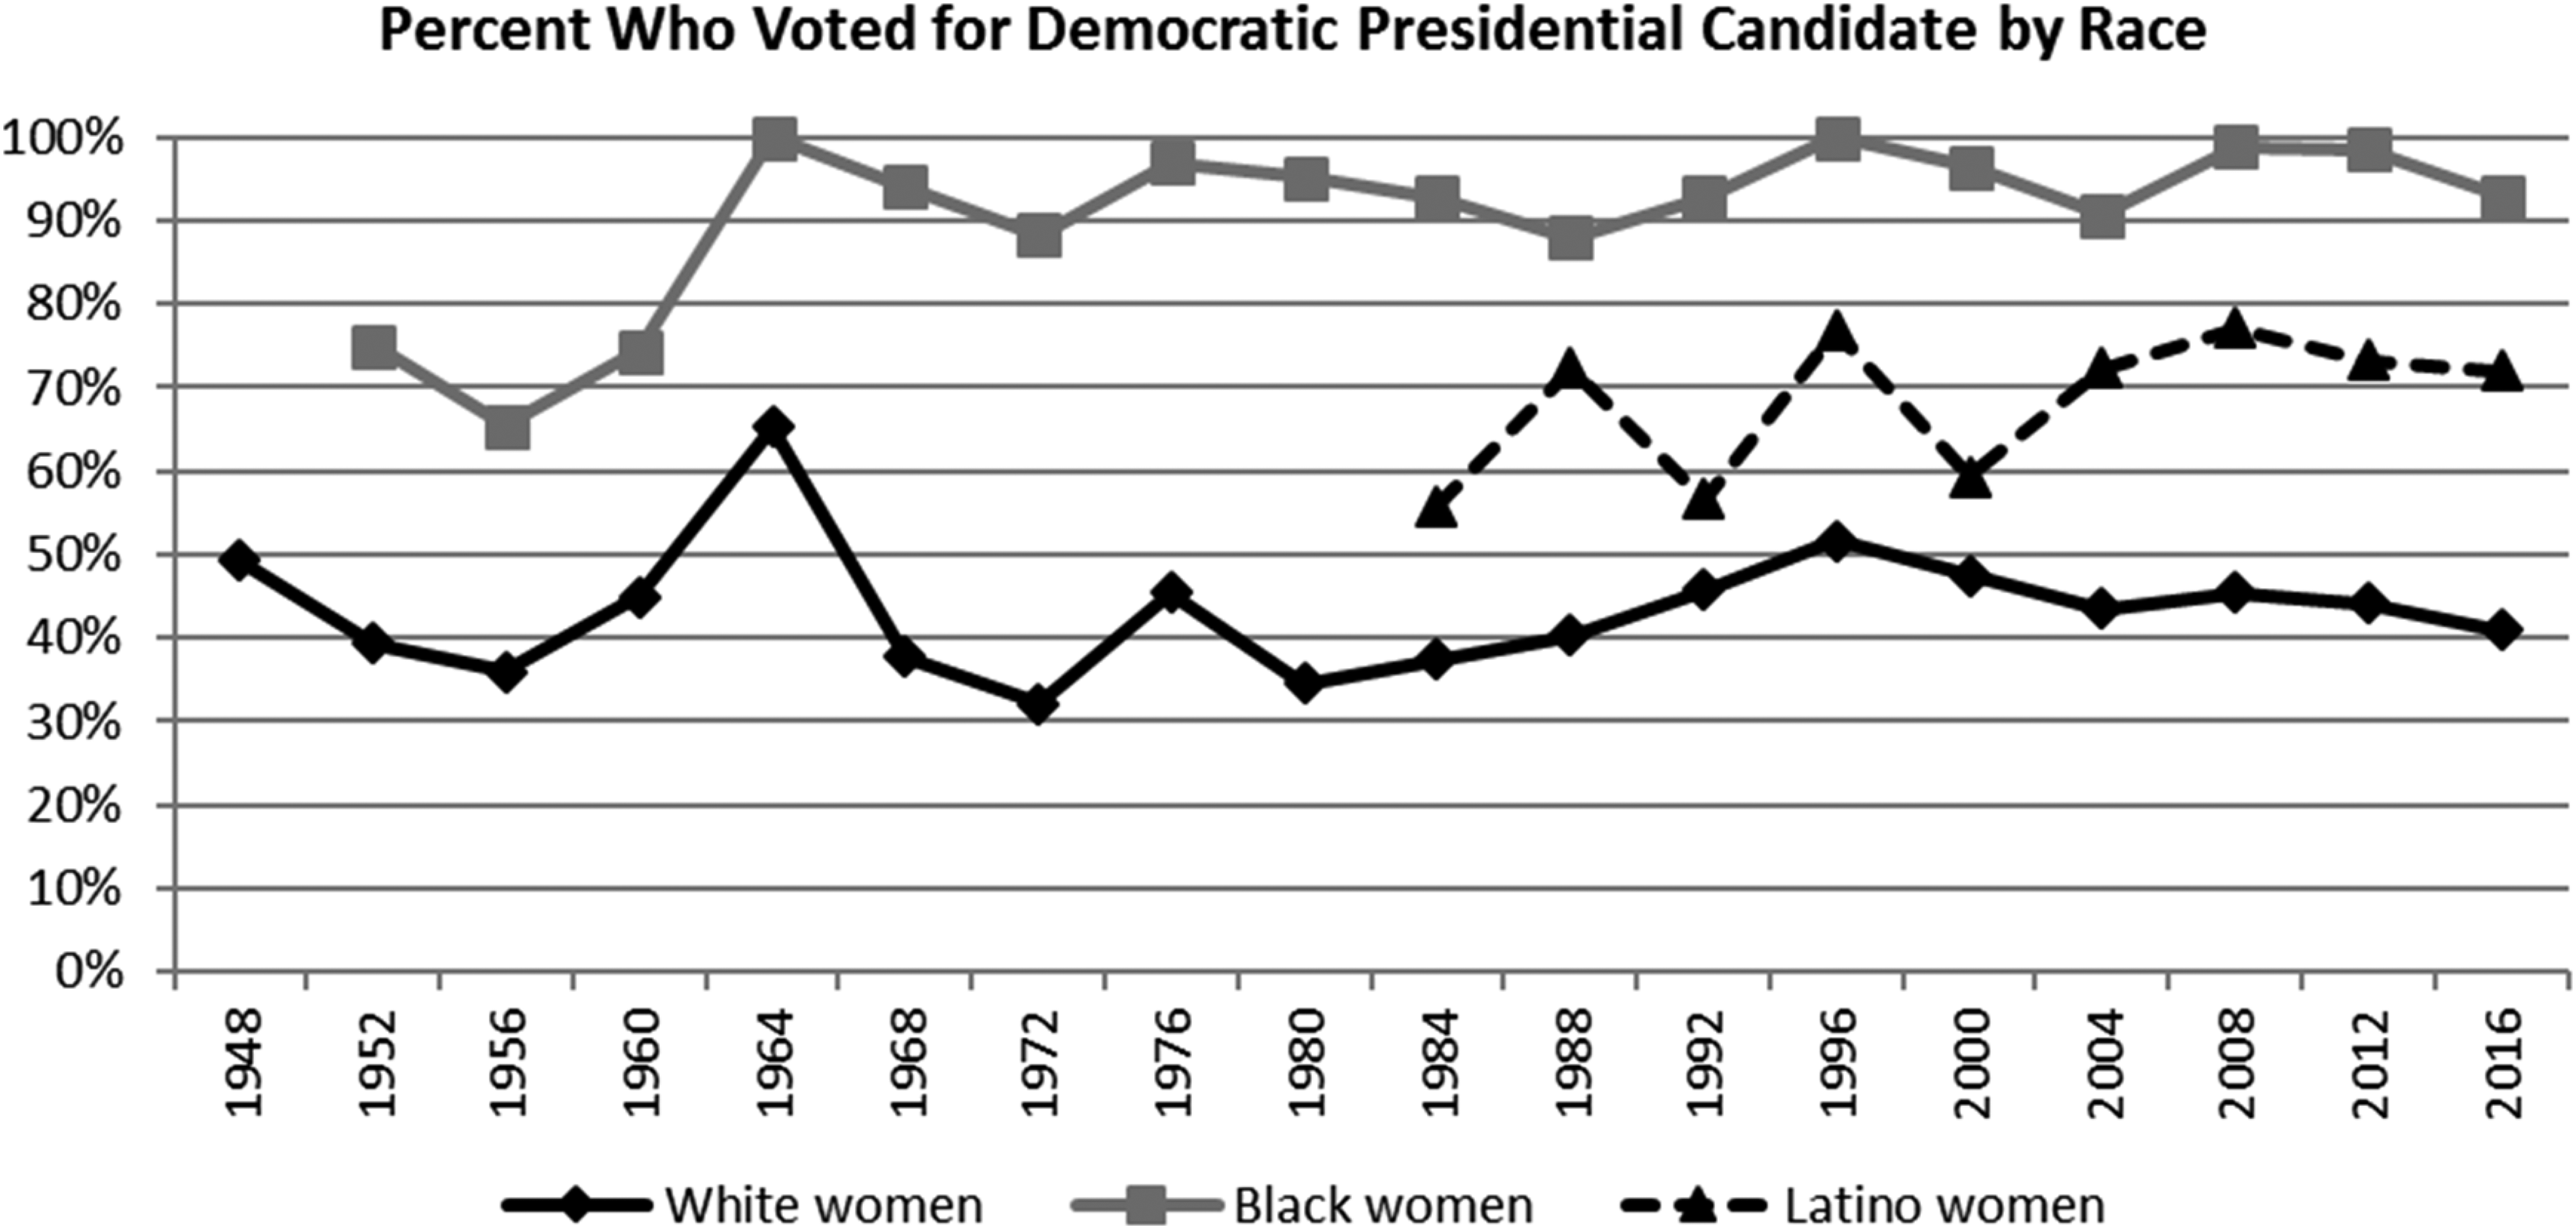
Political scientists are beginning to unpack the relationship between party, race, and gender in voting and making important strides in the analysis of white women’s political behavior (Barnes and Cassese Reference Barnes and Cassese2017; Cassese and Barnes Reference Cassese and Barnes2018; Cassese, Barnes, and Branton Reference Cassese, Barnes and Branton2015; Tesler Reference Tesler2016; Tien Reference Tien2017). Recent elections might encourage the interpretation that the race gap is a unique response to the characteristics of recent campaigns, but ANES data from presidential elections from 1948 to 2016 document clearly the distinctive preferences for Republican and Democratic Party presidential candidates among women based on race and ethnicity (see figure 1). Focusing first on white women, the overall trend shows that white women are more likely to vote Republican than Democratic for president. There are only two elections in which a majority of white women supported the Democratic Party candidate: 1964 and 1996. Moreover, white women’s support level for Republican candidates has been relatively stable and hovers on average above 50%.

Figure 1 Percent Voting Democratic by Race among Women Voters, 1948–2016
Source: American National Election Study, 1948–2016.
In contrast, women of color, particularly Black women, strongly support Democratic candidates, beginning in 1964 and never wavering in subsequent elections. The distinctive political behavior of African American women has been widely documented (Brown Reference Brown2014; Cohen Reference Cohen and Carroll2003; Gay and Tate Reference Gay and Tate1998; Harris-Perry Reference Harris-Perry2011; Jordan-Zachery Reference Jordan-Zachery2007; Prestage Reference Prestage, Githens and Prestage1977; Simien Reference Simien2006). Although the trend line for Latinas is less stable than for African American women voters, some of the variation is due to the relatively small sample sizes of Latina/o respondents in the early attempts of the ANES to survey this growing group of voters; more recent research highlights the unique position of Latinas in US politics (Bejarano Reference Bejarano2013; Bejarano, Manzano, and Montoya Reference Bejarano, Manzano and Montoya2011; Garcia-Bedolla Reference Garcia Bedolla2005; Hardy-Fanta Reference Hardy-Fanta1993). Nevertheless, the data display consistent and strong majority support among Latinas for Democratic Party candidates over time. Indeed, since 2004, Latina support for Democratic candidates has not dropped below 70%. ANES data on partisan candidate preference among Asian American women voters are not provided here because of sample size limitations. However, data from the National Asian American Survey and Comparative Multiracial Political Survey studies provide estimates of strong support for Democratic Party candidates for president among Asian American women voters and distinctive behavior among this group of minority female voters (Barreto et al. 2008; Lien Reference Lien2001; Masuoka et al. Reference Masuoka, Han, Leung and Zheng2018; Wong et al. Reference Wong, Karthick Ramakrishnan, Lee and Junn2011). The pattern for Asian American women is similar to that demonstrated by Latinas, with the proportion voting Democratic hovering in the high 60s for the last three US presidential elections. The explanations for the strong Democratic support among women of color have been discussed in a growing body of research (Bowler and Segura Reference Bowler and Segura2011; Carter and Perez Reference Carter and Pérez2016; Frasure and Williams Reference Frasure, Williams and Dill2009; Garcia Bedolla and Scola Reference Garcia Bedolla and Scola2006; Hardy-Fanta et al. Reference Hardy-Fanta, Dianne Pinderhughes and Marie Sierra2016).
Nevertheless, academics and journalists alike continue to emphasize the partisan gender gap between men and women while overlooking the enormous differences between women of color and white women in support for Democratic Party candidates. Academic research inspired by the gender gap finding has most often focused on explaining why women are liberal by identifying differences in policy attitudes and ideological orientation (Conover Reference Conover1988). Moreover, given that more female elected officials today are Democratic, research shows that voters have developed the stereotype that women in politics are Democrats (Dolan Reference Dolan2004; Huddy and Terkildsen Reference Huddy and Terkildsen1993). In the media, the gender gap is often linked to the strength of the Democratic Party. For example, the Washington Post published yet another article heralding the magnitude of the gender gap, ironically on the day after Hillary Clinton’s historic loss (Paquette Reference Paquette2016). Meanwhile the Pew Research Center (2018) attributes the growing size of the Democratic Party in 2018 to the persistent gender gap.
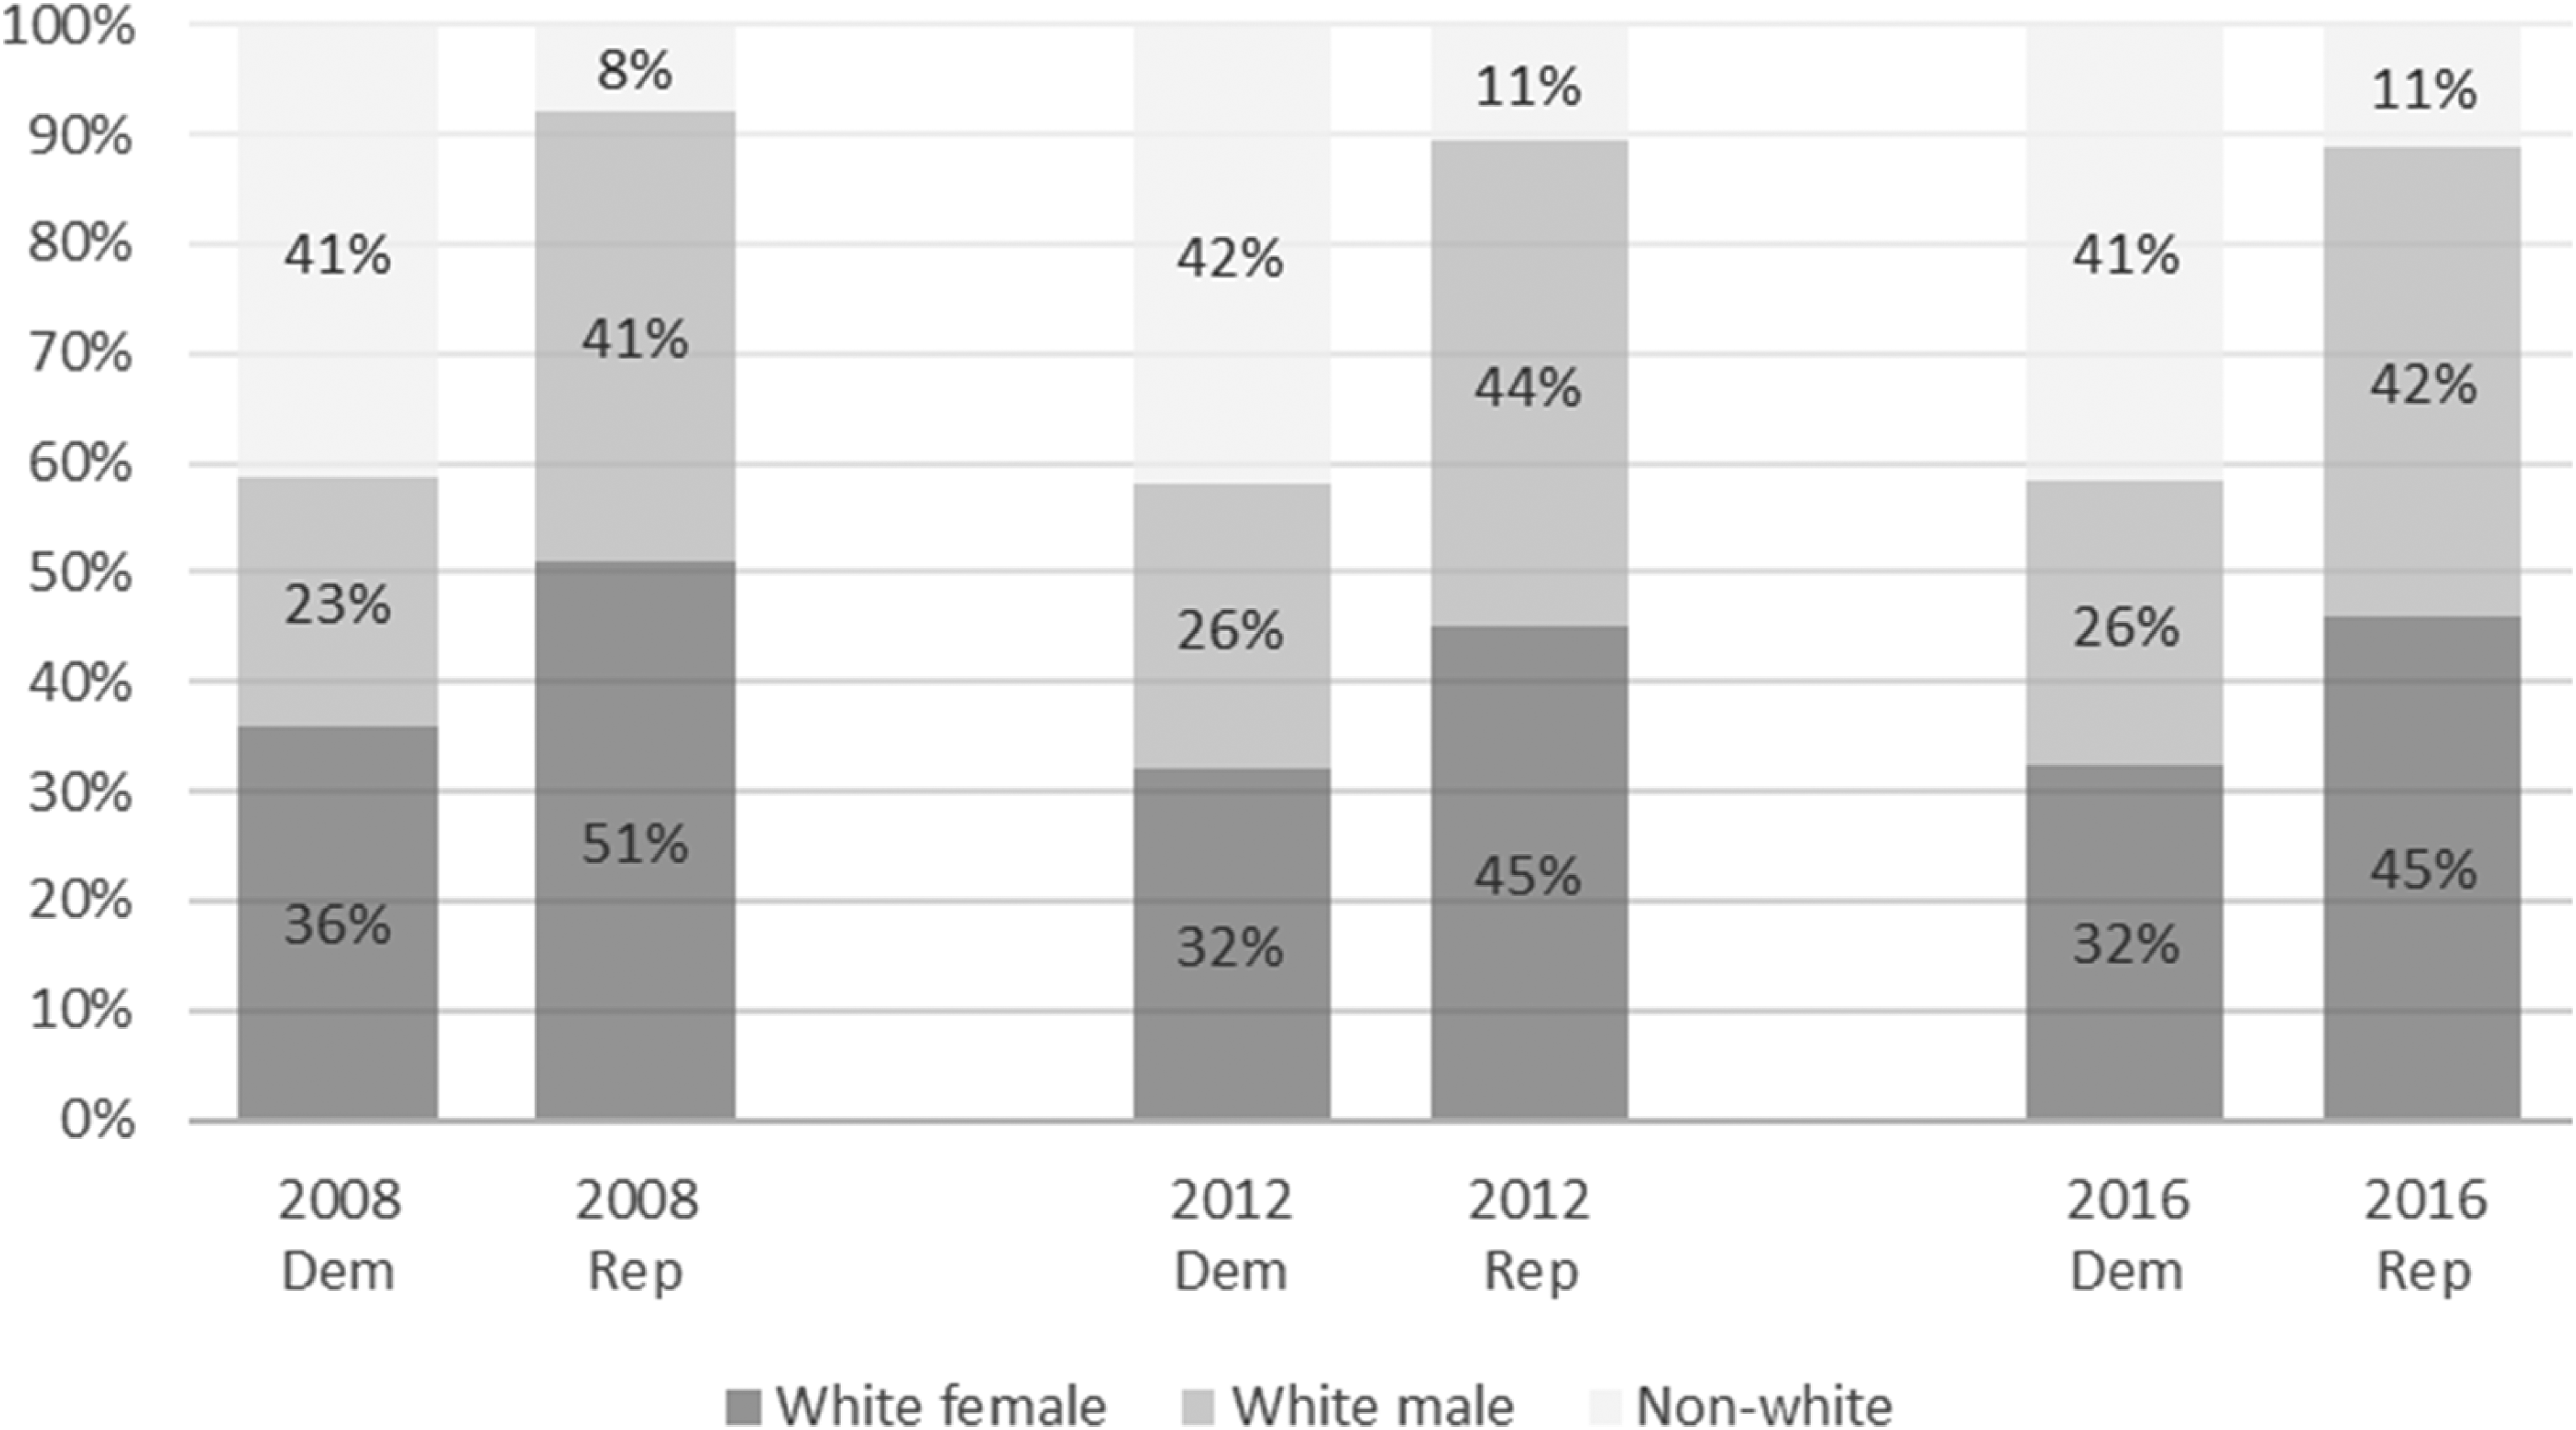
Yet, a different way to orient the data is to understand demographic variation within each political party, rather than focusing on the difference between Democratic and Republican support. Tracking the makeup of voters who supported the Democratic compared to the Republican candidate over time reveals a clear racial pattern. Figure 2 compares the racial and gender makeup of the Republican and Democratic parties in the last three presidential elections. During these elections, white women represented a core demographic base of the Republican electorate, outnumbering even the number of white men who support Republicans. Across all presidential elections for which there are ANES data (since 1948), white women hovered at nearly half of all Republican voters and dropped to a low of 42% of all Republican voters in 1996 (see appendix figures A.3 and A.4). In contrast, the makeup of Democratic Party voters is more racially diverse. Racial minorities made up more than 40% of Democratic voters in the past three elections, and the share among Democrats of racial minority voters has grown over time. For example, in 1968, nonwhites made up 21% of Democratic voters, a proportion that nearly doubled to 41% in 2016. Although white women continue to constitute a large proportion of Democratic voters (32% in 2016), the growth of the Democratic Party is fueled by the inclusion of new minority voters rather than by female voters alone.

Figure 2 Racial Composition of Democratic and Republican Presidential Voters in 2008, 2012, and 2016
Source: American National Election Study, 1948–2016.
It is much easier to see this race gap while simultaneously appreciating the partisan gender gap within groups of voters when the analytical starting point is not a comparison of the political behavior of women voters to that of men. Using analytical strategies beyond the established convention enables a more accurate and detailed picture of women voters to emerge. Although looking at gender alone consistently shows that women vote more Democratic than men, an analysis within gender shows that women of color are Democrats while white women are more likely to be Republicans. By looking at the demographic makeup of each party’s supporters, we find that white women represent a core and consistent voting bloc of the Republican Party, whereas racial diversification is a distinctive trend for Democrats.
Explaining Women’s Partisan Vote Choice
To test the proposition that race matters for explaining partisan vote choice of women voters, we consider its impact, along with frequently implicated contributing factors such as party identification, socioeconomic status, age, religion and region. We limit our analysis to women voters only and estimate logit models that predict having voted for the Democratic Party candidate in the 2008, 2012, and 2016 elections. The models include predictors of vote choice specified in other leading studies of partisan choice (Kinder and Dale-Riddle Reference Kinder and Dale-Riddle2012; Tesler Reference Tesler2016). Although to our knowledge there are no comparable studies analyzing women voters separately, standard treatments of women’s political behavior include many of these same explanatory measures. Perhaps the most important precursor to partisan voting is political party identification itself, and this measure is included as the standard 7-point scale ordered from strong Republican to strong Democrat (Sapiro and Conover Reference Sapiro and Conover1997; Welch Reference Welch1977). Footnote 2 In addition, we include measures of educational attainment, income, age, being employed full-time, having a union member in the household, identifying as evangelical or born again, living in the South, being married, and not having children.
The key variable for this analysis is a dichotomous variable indicating the respondent’s race as white. Although white women make up more than two-thirds of the female respondents, the analysis in the previous section shows that their behavior in supporting Republican presidential candidates is opposite that among women voters overall. Thus, rather than including dummy variables to signify minority group status as a Black woman or as Latina, for example, this analysis specifies race as white as the category that deviates from the norm of women supporting Democrats (Masuoka and Junn Reference Masuoka and Junn2013).
Using data from ANES, we test this model using data from three presidential elections. The ANES surveys of recent elections have also improved in the collection of racially diverse samples of American voters, allowing us to estimate the role of race after accounting for all other predictors. The results of the estimations for each equation in 2008, 2012, and 2016 are shown in table 1.
Table 1 The Effect of Being White on Support for Democratic Party Presidential Candidate among Women Voters in 2008, 2012, and 2016

Source: American National Election Study 2008, 2012, 2016.
Note: Logistic regression. Data are weighted.
*p < 0.05, **p < 0.01.
The results show effects consistent with the literature and, in particular, that political party identification is a strong and significant predictor of partisan vote choice. Indeed, the effect of moving from being a strong Republican to strong Democrat is the largest compared to the other control variables. Several of the other long-standing predictors of partisan candidate choice are significant in the models, but are not always consistently so across all elections. For example, high socioeconomic status predicted support for the Democratic candidate in 2016, but neither educational attainment nor income was a significant predictor in the other two elections. Those who were religious, specifically those who identified as evangelical or born again, were significantly more likely to vote Republican in 2008 and 2012, but not in 2016. Those who lived in the original secession states in the American South were less likely to vote for Democrats in 2008 but not in the other two elections. Finally, being married was a significant and strong predictor of Democratic support only in 2012.
What is most striking in the estimates of the models of women’s vote choice is the strong and significant effect of race and, in particular, of being white. Next to party identification, the race dummy variable is the only one that is consistently significant across all three elections. Although this pattern is clear in the descriptive data, the substantive interpretation of the coefficient estimates is that, above and beyond the other individual-level traits included as predictors in the models, being white predicts opposition to President Obama in 2008 and 2012, as well as opposition to Hillary Clinton in 2016, among women voters.
This multivariate analysis confirms the importance of race in explaining presidential vote choice among women voters; however, what explains white women’s preference for the Republican candidate while women of color are overwhelmingly Democratic? The answer to this question is complex and nuanced and deserves its own separate discussion (cf. Cassese and Barnes Reference Cassese and Barnes2018). Our purpose here is to reorient the view analysts take when constructing research on voting and, in so doing, demonstrate how assessing variation by race can offer useful new insights about women voters. In our discussion of the demographic makeup of the Democratic and Republican Parties in figure 2, it is clear that, although white women make up nearly half of Republican voters, a significant share of white women consistently support Democrats. In contrast, racial minorities are becoming a larger share of the Democratic Party while representing a small share of the Republican Party. Coupled with the pattern demonstrated in figure 1, this suggests that there is variation in partisan choice among white women, whereas women of color demonstrate comparatively little internal variation.
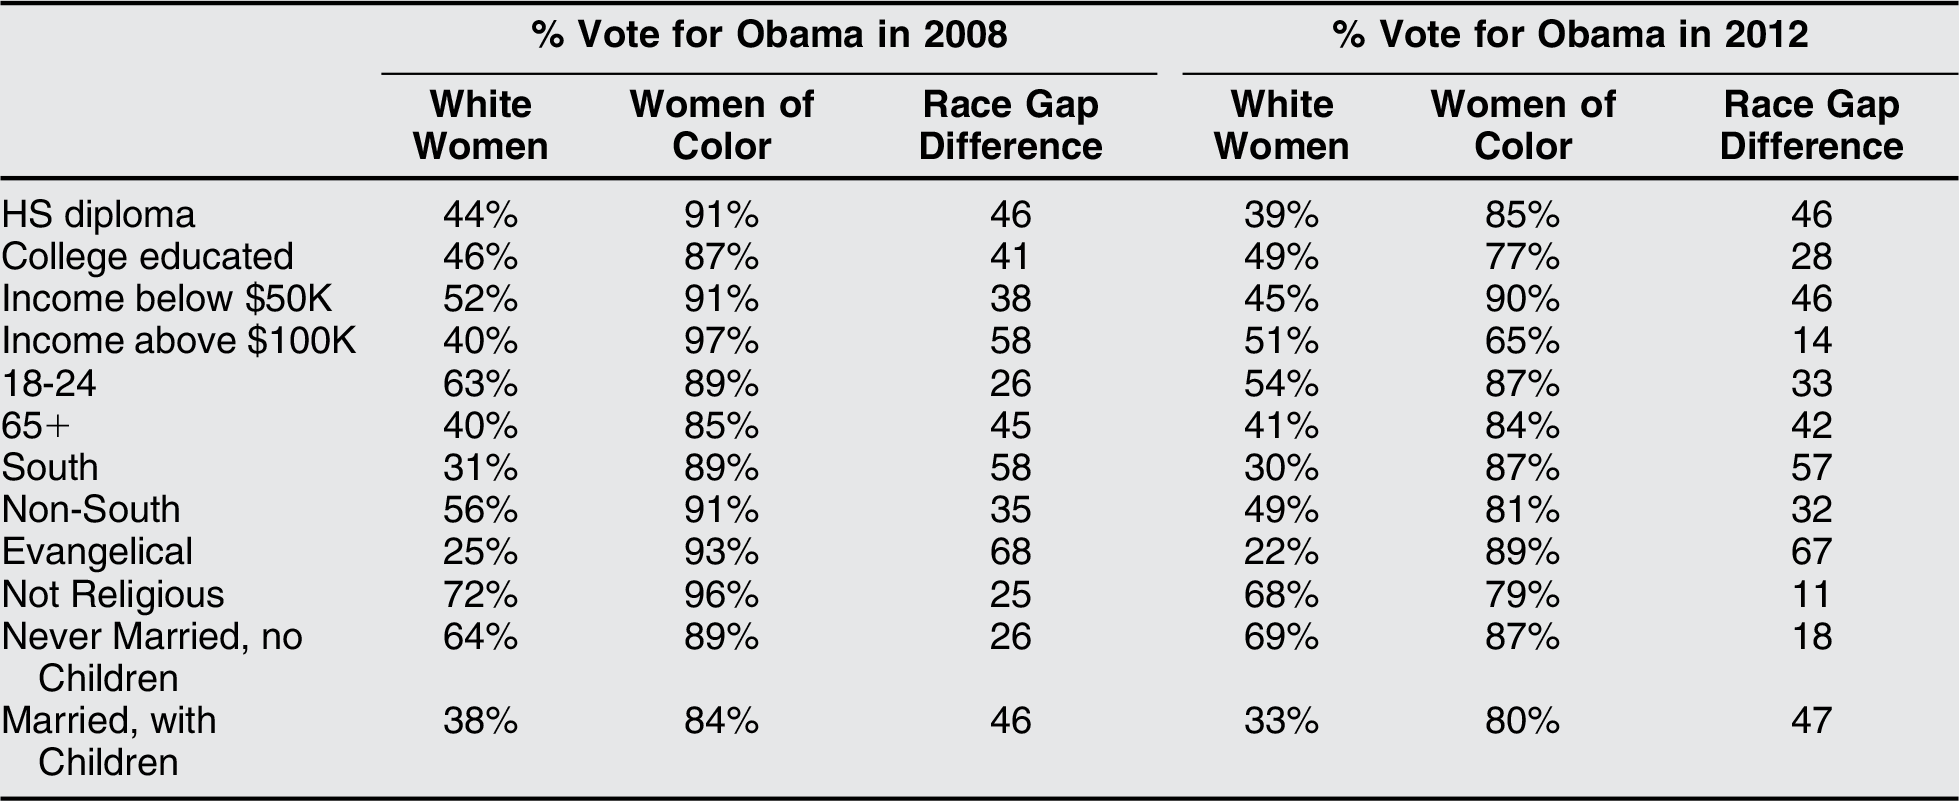
To illustrate this point, we document the variation within women of color and white women by disaggregating each into relevant groups: socioeconomic status (education and income), age, region, religious background, and family composition. Although there are other factors that could be analyzed, we focus on these because they are so often cited as the key characteristics motivating partisan polarization (Campbell et al. Reference Campbell, Converse, Miller and Stokes1960). In table 2, we calculate the percent of each subgroup for white women and for women of color who voted for Clinton in 2016. For comparison, we also ran the same analyses on the 2008 and 2012 elections and found similar patterns (results not shown, see appendix table A1).
Table 2 Partisan Race Gap among Women Voters by Subgroup, 2016
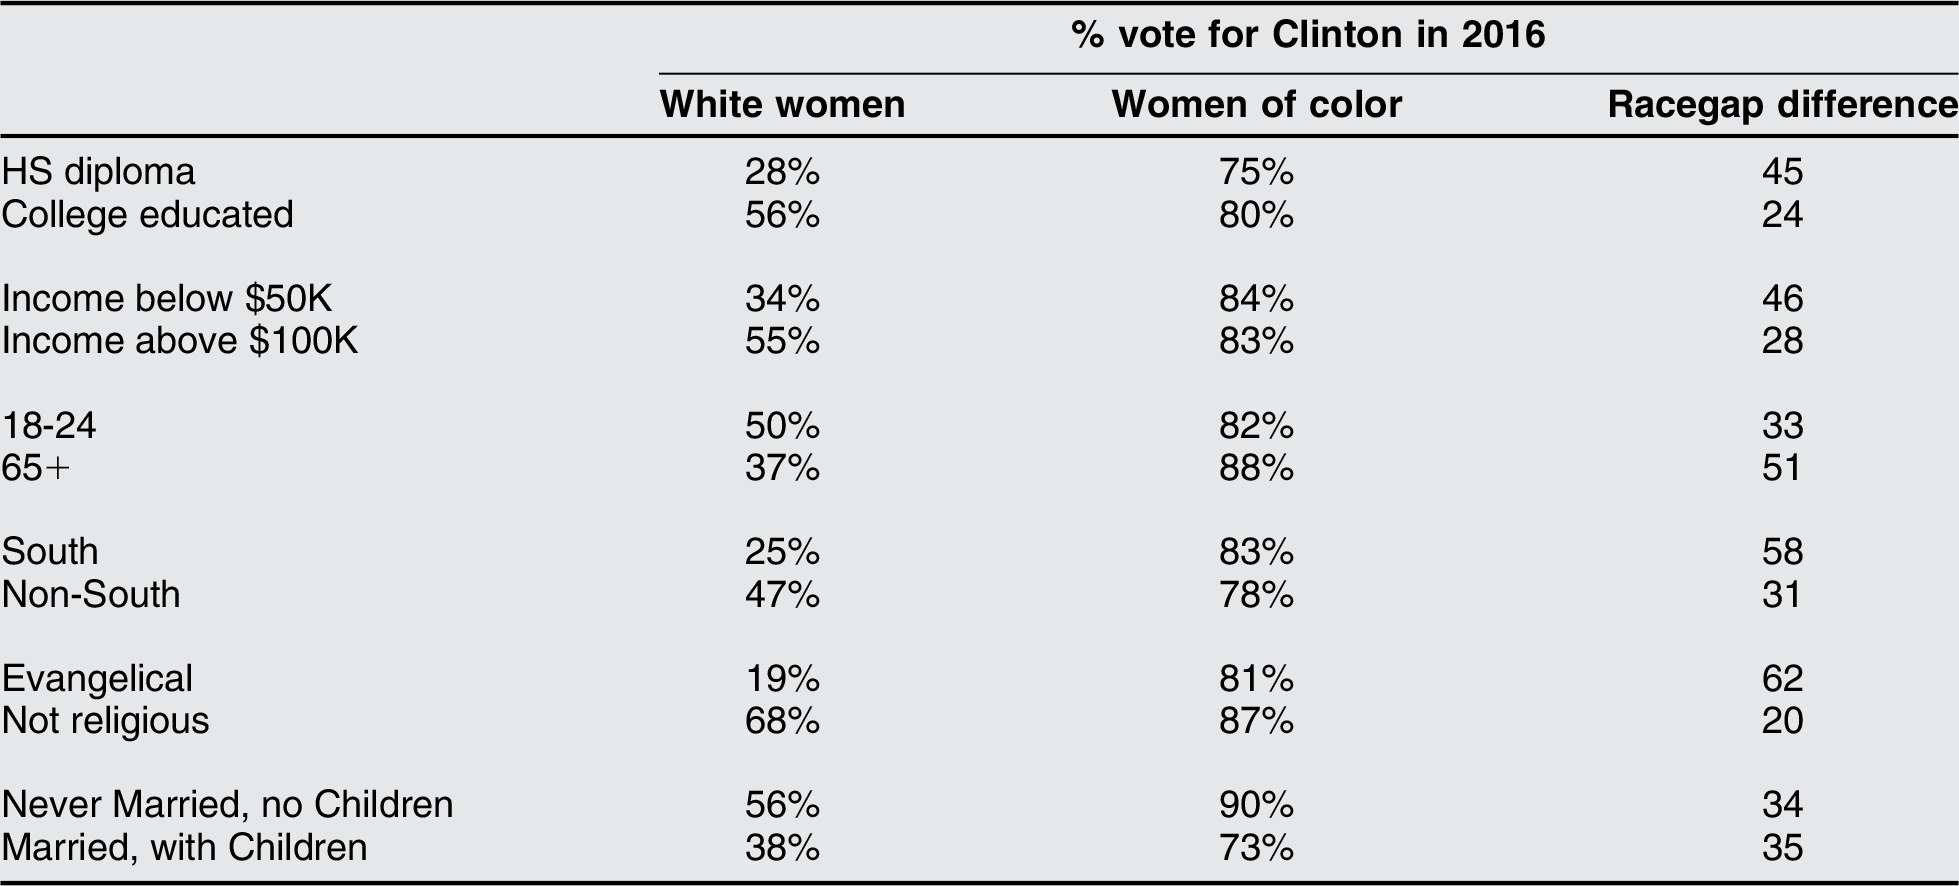
Source: American National Election Study.
Looking first at the breakdown among white women voters in table 2, we find that the characteristics explaining partisan polarization show clear variation. Among white women, larger proportions of the college educated, high income, millennials, nonreligious, those living outside the South, and those who are unmarried with no children voted for Clinton in 2016. At the same time, even though pundits often highlight these demographic subgroups as major divisions, they are not as pronounced as the hype suggests. For example, among white female millennials, half supported Clinton, and for the college educated, only a slight majority of 56% supported Clinton. In contrast to white women, there is striking uniformity across women of color. Although there would likely be more variation if we were able to disaggregate the minority women into racial and ethnic groups, these data with African American, Latina, and Asian American voters combined show clearly that variation in the same traits that demonstrate differences in white women do not explain partisan vote choice among women of color. In contrast, comparing women of color to white women in terms of socioeconomic status, age, religion, residence in the South, and family composition reveals enormous gaps by race in support of Democrat Hillary Clinton in 2016. Thus, although the conventional explanations for partisan polarization can explain partisan preferences of white women and their variation from women of color, these results reveal the need for alternative theories to explain partisan preferences for women of color. We hope future research will address some of these glaring holes in our understanding of partisanship and voting in presidential elections.
US Women Voters and the Significance of Race
This analysis encourages scholars to reconsider the conventional wisdom about gender and partisan vote choice in US presidential elections. The analytical framework used here shows that the conventional method of comparing women against the default category of men yields only a partial explanation of women’s voting patterns at best and, at worst, obscures substantial differences by race among female voters. Once we turn our attention to the variation among women, the results demonstrate the significance of race and, in particular, the effect of being white in determining stronger opposition to Democratic Party candidates among women voters in recent elections. As a result, we learn that it is important to first sort women by race before identifying which types of demographic groups are Democratic and which are Republican. By doing so, new questions about voting patterns arise. Which types of white women are Republicans and which type are Democrats? Is there a smaller race gap among millennial women compared to older women? Questions like these, however, arise only after our attention is oriented toward the variation across women voters, which remains fertile ground for new research.
Building from this analysis, we glean three important insights into partisan vote choice. First, there is greater partisan variation across features such as socioeconomic status, religion, US region, and age among white women compared to women of color. Women of color are predominantly Democratic, which means that it is difficult to identify key sources of individual-level variation across these women in partisan voting. On the one hand, this could indicate that women of color are politically homogeneous. But qualitative data, along with an assessment of different ideologies present within minority groups as well as across communities of color, show that women of color hold a variety of political worldviews, rather than one uniform worldview (Beltran Reference Beltran2010; Dawson Reference Dawson2003). Instead, women of color offer their overwhelming support to the Democratic Party because of the heavily racialized political context that prevents racial minorities from competitively taking the position of the electoral swing vote (Frymer Reference Frymer2010). Research on the intersectional location of women of color in relatively marginalized positions in the race and gender hierarchy provides an important basis for theorizing about partisan vote choice by race (Collins Reference Collins1990; Crenshaw Reference Crenshaw1989; Hancock Reference Hancock2007, Reference Hancock2015).
Second, these results lend support to the conclusion that compositional change in the electorate is a crucial driver for continued Democratic competitiveness in national elections. Democratic Party loyalty among women of color explains why women overall look more Democratic even as white women consistently vote majority Republican. It is no coincidence that the partisan gender gap between men and women first appeared in the 1980s at the same time that African American voters consolidated behind the Democratic Party after the passage of the Civil Rights Act in 1964 and the Voting Rights Act in 1965 (Tate Reference Tate1993), and larger numbers of new immigrants from Latin America and Asia entered the electorate through naturalization, a generation after the Immigration and Nationality Act of 1965 became law. The partisan gender gap appears in part because women of color enter the electorate and vote heavily Democratic, simultaneously expanding the size of the denominator of women voters while adding disproportionately to the numerator in support of Democratic Party candidates. In contrast, white women remain consistent supporters of Republican Party candidates. Women are assumed today to be Democrats in large part because of the increasing presence of minority women in the electorate.
Finally, compositional change is also implicated in analyzing turnout mobilization. Given the variation in partisan preferences among women voters classified by race and ethnicity, analysts would benefit from considering how women of color and white women are mobilized in a given election. Indeed, the fluctuation in the number of female voters from election to election reflects variation in the success of mobilization. For example, the same number (53.1 million) of white female voters turned out in 2016 as in 2008, despite the fact that the size of the white female population in the United States grew during those years (CAWP 2017). In contrast, voting participation among women of color increased steadily during that same time period, reflecting both a growth in the population of eligible women of color voters and turnout behavior to match. Different candidates generate distinct mobilization patterns among voters in terms of both gender and race, and what is clear is that white women are more diverse in their partisan candidate preferences than are Black, Latina, and Asian American female voters. With a larger proportion of Republican Party supporters among white women, their static turnout behavior in 2016 (compared with 2008) can be interpreted as both another consistent data point in majority support for Republicans and as a potential indicator of weaker mobilization for white women voters compared with minority female voters in the 2016 election. Women in the United States are the most important and consequential voters in the US electorate: their collective dynamism is relevant not only for the presence and interpretation of the gender gap, but also for the electoral fortunes of US presidential hopefuls in 2020 and beyond.
Supplementary Materials
To view supplementary material for this article, please visit https://doi.org/10.1017/S1537592719003876
Appendix: Additional Tables
Table A1 Partisan Race Gap among Women Voters by Subgroup, 2008 and 2012
Source: American National Election Study.
Appendix: Coding of Variables
Vote Choice
-
2008=V085044a; 2012=prevote2012_x; 2016=V162062x
-
1=Vote for Democratic party candidate
-
0=Vote for a non-Democratic party candidate
White
-
2008=V083251a, V083251b; 2012=dem_raceth_x; 2016=V161310x
-
1=white, non-Hispanic
-
0=all other races (including Latinos)
Party Identification
-
2008=V083098x; 2012=pid_x; 2016=V161158x
-
1=Strong Republican
-
7=Strong Democrat
Education
-
2008=V083218x; 2012=dem_educgroup_x; 2016=V161270
-
1=highest grade completed 0–8 grade
-
6=highest grade completed advanced degree
Income
-
2008=V083248x; 2012=incgroup_prepost_x; 2016=V161361x
-
1=household income is less than $2,999
-
25=household income is $150,000 or more
Never Married
-
2008=V083216x; 2012=dem_marital; 2016=V161268
-
1=never married
-
0= all other statuses
Age
-
2008=V083215x; 2012=age; 2016=V161267
-
Age in years
No Children (in household)
-
2008=V083265a, V083265b; 2012=dem2_numchild; 2016=V161324
-
1=no children
-
0=has children
South
-
2008=V081201b; 2012=sample_stfips; 2016=V162026a
-
1=Lives in one of the 11 secession states: Alabama, Arkansas, Florida,
-
Georgia, Louisiana, Mississippi, North Carolina, South Carolina, Tennessee, Texas, and
-
Virginia (for 2016, state in which respondent is registered)
-
0=All other states
Union member
-
2008=V083246; 2012=dem_unionhh; 2016=V161302
-
1=union member
-
0=non-union member
Employed
-
2008=V083222a; 2012=dem_empstatus_1digitfin_x; 2016=V161276x
-
1=fully employed
-
0=all other statuses
Evangelical or Born again
-
2008=V083203; 2012=relig_7cat_x; 2016=V161265x
-
0=other religion
-
1=evangelical or born again
Not religious or atheist
-
2008=V083185b; 2012=relig_7cat_x; 2016=V161265x
-
0=affiliates with specific religious denomination
-
1= not religious or atheist