


INTRODUCTION
The availability of adequate amounts of high quality genomic DNA is essential for genetic studies such as diagnosis and genotyping. Genotyping and subtyping of clinical and environmental isolates is desirable as it allows source tracking and better understanding of molecular epidemiology and population structure (Anderson et al. Reference Anderson, Haubold, Williams, Estrada-Franco, Richardson, Mollinedo, Bockarie, Mokili, Mharakurwa, French, Whitworth, Velez, Brockman, Nosten, Ferreira and Day2000; Han et al. Reference Han, Zschausch, Meyer, Schneider, Loos, Bhakdi and Maeurer2000; Mallon et al. Reference Mallon, MacLeod, Wastling, Smith and Tait2003; Burgos et al. Reference Burgos, Méndez and Ribon2004; Smith et al. Reference Smith, Cacciò, Cook, Nichols and Tait2007). Unfortunately, such isolates are often unculturable, yielding a very limited amount of DNA for study. Cryptosporidium, an emergent protozoan parasite causing mainly diarrhoeal illness in humans and animals, is particularly difficult to propagate. Although Cryptosporidium oocysts are excreted in high numbers in the faeces during acute clinical episodes (Goodgame et al. Reference Goodgame, Genta, White and Chappell1993), the purification methods used to obtain clean DNA, suitable for downstream molecular methods, usually result in losses. This presents difficulties for the study of isolates present in lower numbers, such as those in environmental samples or during subclinical infection. These issues have limited biological studies to C. parvum calf propagated strains, particularly the IOWA reference strain (Cama et al. Reference Cama, Arrowood, Ortega and Xiao2006).
Several subtyping techniques have been applied to Cryptosporidium species using different markers: glycoprotein GP60 (Strong et al. Reference Strong, Gut and Nelson2000; Leav et al. Reference Leav, Mackay, Anyanwu, O'Connor, Cevallos, Kindra, Rollins, Bennish, Nelson and Ward2002), double-stranded RNA element (Leoni et al. Reference Leoni, Gallimore, Green and McLauchlin2003) and mini- and microsatellite repeats (Cacciò et al. Reference Cacciò, Homan, Camilli, Traldi, Kortbeek and Pozio2000; Mallon et al. Reference Mallon, MacLeod, Wastling, Smith and Tait2003). Ideally, each new isolate should be tested using a panel of markers. However, this is usually limited by the amount of DNA available. Whole genome amplification (WGA) can be used to increase the amount of nucleic acid available from clinical and environmental samples of waterborne pathogens (reviewed by Bouzid et al. Reference Bouzid, Steverding and Tyler2008) and application of this technique to Cryptosporidium isolates should address the perceived need for multilocus typing (Smith et al. Reference Smith, Cacciò, Tait, McLauchlin and Thompson2006).
The first described WGA methods were degenerate oligonucleotide-primed PCR (DOP–PCR) (Telenius et al. Reference Telenius, Carter, Bebb, Nordenskjöld, Ponder and Tunnacliffe1992; Cheung and Nelson, Reference Cheung and Nelson1996) and primer extension preamplification (PEP) (Zhang et al. Reference Zhang, Cui, Schmitt, Hubert, Navidi and Arnheim1992). However, these PCR-based techniques produced short products (<3 kb) and were limited by substantial amplification bias and incomplete coverage of genetic markers (Paunio et al. Reference Paunio, Reima and Syvänen1996; Dean et al. Reference Dean, Hosono, Fang, Wu, Faruqi, Bray-Ward, Sun, Zong, Du, Du, Driscoll, Song, Kingsmore, Egholm and Lasken2002; Hawkins et al. Reference Hawkins, Detter and Richardson2002; Park et al. Reference Park, Beaty, Boyce, Scott and McIntosh2005). New strategies for WGA have been developed including multiple displacement amplification (MDA) and OmniPlex WGA (Park et al. Reference Park, Beaty, Boyce, Scott and McIntosh2005). MDA is an isothermal amplification using degenerate hexamers and the bacteriophage phi-29 DNA polymerase, which possesses high processivity, strand-displacement abilities and a proof-reading activity resulting in error rates 100 times lower than the Taq polymerase (Eckert and Kunkel, Reference Eckert and Kunkel1991; Esteban et al. Reference Esteban, Salas and Blanco1993; Dean et al. Reference Dean, Hosono, Fang, Wu, Faruqi, Bray-Ward, Sun, Zong, Du, Du, Driscoll, Song, Kingsmore, Egholm and Lasken2002; Nelson et al. Reference Nelson, Cai, Giesler, Farchaus, Sundaram, Ortiz-Rivera, Hosta, Hewitt, Mamone, Palaniappan and Fuller2002; Hawkins et al. Reference Hawkins, Detter and Richardson2002). MDA was first described by Blanco et al. (Reference Blanco, Bernad, Lázaro, Martín, Garmendia and Salas1989) and then used for WGA of different targets such as lymphoma and leukaemia clinical specimens (Luthra and Medeiros, Reference Luthra and Medeiros2004), complex mixtures of DNA (Shoaib et al. Reference Shoaib, Baconnais, Mechold, Le Cam, Lipinski and Ogryzko2008), whole blood and tissue-culture cells (Dean et al. Reference Dean, Hosono, Fang, Wu, Faruqi, Bray-Ward, Sun, Zong, Du, Du, Driscoll, Song, Kingsmore, Egholm and Lasken2002), human blastomeres (Snabes et al. Reference Snabes, Chong, Subramanian, Kristjansson, DiSepio and Hughes1994), plasmid constructs and whole bacterial genomes (Detter et al. Reference Detter, Jett, Lucas, Dalin, Arellano, Wang, Nelson, Chapman, Lou, Rokhsar, Hawkins and Richardson2002). The OmniPlex WGA technique uses libraries of 200–2000 bp fragments created by random chemical cleavage of genomic DNA, followed by ligation of adaptor sequences to both ends and PCR amplification (Barker et al. Reference Barker, Hansen, Faruqi, Giannola, Irsula, Lasken, Latterich, Makarov, Oliphant, Pinter, Shen, Sleptsova, Ziehler and Lai2004; Bergen et al. Reference Bergen, Haque, Qi, Beerman, Garcia-Closas, Rothman and Chanock2005). This fragmentation/ligation/PCR-based method amplifies the entire genome several 1000-fold, and could be even re-amplified to achieve a final amplification of over 1 000 000-fold without introducing inaccuracies (Langmore, Reference Langmore2002). Currently, several commercial kits for MDA and Omniplex based WGA are available.
We report here the results of the first study to evaluate the suitability of WGA for the accurate expansion of genomic DNA from Cryptosporidium isolates using commercial kits.
MATERIALS AND METHODS
Cryptosporidium DNA
Ten clinical samples were selected from the collection of the Cryptosporidium reference unit (CRU), Swansea. They originated from diarrhoea patients with confirmed cryptosporidiosis from different geographical locations in the UK. DNA was isolated from semi-purified oocyst suspensions prepared from stool samples by saturated-salt solution centrifugation and extracted using QIAamp DNA mini kit spin columns (Qiagen Ltd, Crawley, UK) as previously described by Elwin et al. (Reference Elwin, Chalmers, Roberts, Guy and Casemore2001). For each sample, the speciation was performed by PCR-RFLP of the Cryptosporidium oocyst wall protein (COWP) gene as previously described by Spano et al. (Reference Spano, Putignani, McLauchlin, Casemore and Crisanti1997) and by real-time PCR using simplex Lib 13 primers for C. parvum and C. hominis as described by Tanriverdi et al. (Reference Tanriverdi, Arslan, Akiyoshi, Tzipori and Widmer2003). For this study, we tested the DNA of 5 C. hominis and 5 C. parvum isolates as these two species are the cause of the majority of human cases of cryptosporidiosis. Table 1 detailed the origin and the epidemiological data of the tested isolates. All DNA samples were quantified by spectrometry using Nanodrop ND-1000 (Thermo Fisher Scientific, Leicestershire, UK). In addition, C. parvum IOWA reference strain DNA extracted from a purified oocyst suspension from a commercial source (ATCC/LGC Promochem, Teddington, UK) was tested as a positive control and its DNA concentration was quantified as 5·8 ng/μl.
Table 1. Origin and epidemiological data of clinical isolates of Cryptosporidium hominis and C. parvum used for this study
(The concentration of each DNA suspension was evaluated by nanodrop.)
WGA kits
Three commercial WGA kits were tested during this study: illustra GenomiPhi V2 DNA amplification Kit (GE Healthcare, Buckinghamshire, UK), REPLI-g Ultra-fast Mini Kit (Qiagen, Crawley, UK) and GenomePlex® Complete WGA Kit (Sigma, Dorset, UK). Illustra GenomiPhi and REPLI-g kits are MDA-based WGA, while GenomePlex kit is based on the Omniplex technique. All 3 kits were used according to the manufacturer's instructions. The manufacturer's recommended starting genomic DNA concentration was 1 ng for the illustra kit and 10 ng for both the REPLI-g and GenomePlex kits. As the DNA concentrations of Cryptosporidium isolates ranged from 3·5 to 13·2 ng/μl (with a mean of 7·7 ng/μl), 1 μl of each sample was used for WGA. WGA techniques are well established in the literature to give amplification levels from 10-fold less than our lowest template concentration (0·3 ng) to 20-fold higher than our highest concentration (300 ng) (Dean et al. Reference Dean, Hosono, Fang, Wu, Faruqi, Bray-Ward, Sun, Zong, Du, Du, Driscoll, Song, Kingsmore, Egholm and Lasken2002), which raises the prospect for them to be used widely for clinical samples. Thus, in our study all of the samples lie well within the range we would expect to give good amplification by the kits under test and the range recommended by the manufacturers.
Quantification of genomic DNA after WGA
After WGA, the amplified products were analysed by agarose gel electrophoresis. In addition, 3 methods were used to quantify the amplified genomic DNA: Nanodrop, Hoechst and PicoGreen. Hoechst 33258 dye exhibits enhanced fluorescence when bound to dsDNA under high ionic strength conditions (Goumenou and Machera, Reference Goumenou and Machera2004). Serial dilutions of calf thymus DNA stock solution (1 mg/ml) (Sigma, Dorset, UK) were performed yielding concentrations ranging from 100 ng/ml to 2500 ng/ml. Fifty μl of each preparation was used for measurement. All DNA samples were diluted in TNE buffer (100 mm Tris, 1 m NaCl, 10 mm Na2EDTA, pH 7·5). For each DNA sample, an equal volume of 2x Hoechst Dye solution (200 ng/ml) (Sigma, Dorset, UK) was added. Fluorescence was read using a microplate reader FLUOstar, BMG Labtech (Aylesbury, UK) after incubation for 5 min at room temperature. The blank solution was prepared by adding an equal volume of TNE buffer and 2x dye solution. The average value of the blank measurement was subtracted from the measurements made at each concentration and the results plotted. A linear regression was performed on the standard curve to allow the determination of the DNA concentrations of the tested samples. PicoGreen was also used as an ultrasensitive fluorescent nucleic acid stain for accurate quantification of double-stranded DNA (dsDNA). Quanti-iT™ Picogreen® dsDNA kit (Molecular Probes, Invitrogen, Paisley, UK) was used according to the manufacturer's instructions. We also used GeneTools software (Syngene, Cambridge, UK) for densitometry-based DNA quantification.
Integrity and fidelity of amplified genomic DNA
The integrity of the amplified DNA for the 3 kits was evaluated by PCR using Cry15/Cry 9 primers amplifying 550 bp of the COWP gene (Spano et al. Reference Spano, Putignani, McLauchlin, Casemore and Crisanti1997). In addition, 2 newly designed primers were also used, amplifying 270 bp and 247 bp of Cgd6_5020 and Chro.20156 genes, respectively. COWP and Cgd6_5020 markers are on Chromosome 6 and Chro.20156 gene is on Chromosome 2. The primer sequences were as follows: Cgd6_5020F (AACAGGAGCTGACGATTGCT), Cgd6_5020R (ACATTGTGCCATTCCAAGGT), Chro.20156F (TTCGCTTGAAGCCGTAAACT) and Chro20156R (GGCATTGATACCAGGCAAGT). All DNA templates were diluted 1/25 after WGA, PCR conditions were the same for genomic DNA and for post-WGA subsequent amplifications. The PCR mix for each primer set consisted of 1·5 mm MgCl2, 0·2 mm of each dNTP (Bioline, UK), 0·6 μm of each primer and 2·5 U of HotStar Taq DNA polymerase (Qiagen Ltd, Crawley, UK) in a 50 μl final volume. The cycling conditions were as follows: an initial hot-start at 95°C for 15 min, followed by 40 cycles of 94°C for 50 s, 57°C for 30 s and 72°C for 50 s and a final extension at 72°C for 10 min. The PCR reactions were performed using Techne TC-512 thermal cycler (SLS, Nottingham, UK). PCR products were run on a 2% agarose gel stained with ethidium bromide in TBE buffer and visualized under UV.
The fidelity of the amplification was assessed by PCR product sequence analysis before and after WGA of 2 C. hominis samples (W15507, W15519), 2 C. parvum samples (W15511, W15516) and the reference strain C. parvum IOWA. PCR products were purified using QIAquick® PCR purification Kit (Qiagen Ltd, Crawley, UK) and were sequenced using the Big-Dye Terminator cycle sequencing system and an ABI 3770 DNA sequencer at the genome lab, John Innes Centre (www.jic.ac.uk). The sequences were aligned using Vector NTI Advance™ 10 (Invitrogen, Paisley, UK).
Comparative analysis of Cryptosporidium genomic DNA before and after WGA
The comparative analysis of genomic DNA and paired WGA DNA was limited to the samples which were prepared using the most promising WGA method as explained below. After WGA, the amplified products were compared to the original genomic DNA using a species-specific, semi-quantitative real-time PCR assay. Briefly, real-time PCR using simplex Lib 13 primers for C. parvum and C. hominis (Tanriverdi et al. Reference Tanriverdi, Arslan, Akiyoshi, Tzipori and Widmer2003) was used in triplicate to amplify 2 μl of genomic DNA and 2 μl of its paired WGA DNA (both diluted 1 in 25 v/v). We used Corbett Rotorgene 3000 platform (Corbett Life Science, Sydney, Australia). Melt curve analysis was performed to identify Cryptosporidium species and CT (threshold cycle) values were recorded to compare each paired sample, before and after WGA. This assay shows a demonstrable difference of 3 CT units per 10-fold difference in DNA target copy number (CRU unpublished data). Since the WGA DNA originated from 1 μl of genomic DNA producing 10 μl of product (representing a 10-fold dilution in comparison with the genomic DNA), the final CT values for the WGA DNA were decreased by 3 CT units.
RESULTS
Success rate and yield of WGA kits
The reliability and robustness of WGA kits to variation in DNA acquired from clinical samples were assessed by agarose gel electrophoresis. A successful amplification was considered when genomic DNA was visible on the gel. One sample W15508 did not amplify with any of the 3 kits tested.
Illustra GenomiPhi and REPLI-g kit-amplified DNA was of high molecular weight (~10 kb) for all the tested samples. The success rate was 90·91% (10/11 samples) for illustra GenomiPhi kit and 45·46% (5/11) for REPLI-g kit (Fig. 1). For GenomePlex amplified samples, the generated DNA was of smaller size ranging between 200 and 1000 bp (mean size ~400 bp) (Fig. 1). The success rate was 72·73% (8/11 samples). For illustra GenomiPhi and REPLI-g kits, samples W15521, W15516 and IOWA showed the strongest bands, suggesting better amplification. However, when the GenomePlex kit was used, W15504, W15521, W15516 and W15517 showed a high level of amplification, but, surprisingly commercially obtained IOWA DNA did not.
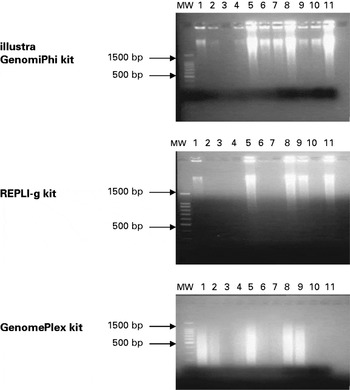
Fig. 1. Agarose gel electrophoresis of 8 μl of amplified genomic DNA. MW: molecular weight marker, 1: W15504, 2: W15507, 3: W15508, 4: W15519, 5: W15521 (1–5: Cryptosporidium hominis samples), 6: W15509, 7: W15511, 8: W15516, 9: W15517, 10: W15518 (6–10: C. parvum), 11: C. parvum IOWA.
DNA quantification after WGA was initially assessed by 4 methods: nanodrop spectraphotometry alone, Hoechst and PicoGreen fluorimetry and agarose gel-based ethidium bromide fluorescence densitometry. Presumably because of the presence of residual random hexamers in the reaction mix (Ahn et al. Reference Ahn, Costa and Emanuel1996; Singer et al. Reference Singer, Jones, Yue and Haugland1997) the first 2 methods required additional purification before DNA quantification, PicoGreen quantification gave good quantitative data for 2 of the 3 kits tested (illustra GenomiPhi and GenomePlex kits) but only gel-based densitometry was able to provide DNA concentrations for all 3 kits without an additional purification step.
The results of WGA for the samples tested are summarized in Table 2. For each kit, yield was determined by calculating the amount of DNA in the final reaction volume (10 μl for illustra GenomiPhi and 75 μl for GenomePlex kit). Level of amplification was determined as a ratio of concentrations between template and WGA DNA for each sample. The typical yield of illustra GenomiPhi kit was 0·7–7 μg range. The highest yield was 10 μg achieved from IOWA DNA giving over 180-fold amplification. The typical yield of GenomePlex kit gave a 4·5–46 μg range and the level of amplification was 10 to 70-fold. For the REPLI-g kit the yield was of a 0·6–2 μg range (final volume 20 μl), corresponding to 50 to 160-fold amplification.
Table 2. Comparison of the performances of the 3 trialed WGA commercial kits
(Success rate was the number of samples with positive amplification as determined by agarose gel electrophoresis. The size of amplified product was determined by comparison to a molecular weight marker. Picogreen quantification column showed the successful quantification without prior sample purification. Yield and level of amplification were determined based on PicoGreen results for illustra GenomiPhi and GenomePlex kits. * for REPLI-g kit, densitometry was used to determine the yield and the level of amplification. Secondary amplification was the success rate of post-WGA PCR reactions. Fidelity was determined by the number of identical nucleotides before and after WGA.)

Integrity of amplified DNA
The integrity of the amplified genomic DNA was assessed by PCR using 3 primer sets. For Cry 15/9 primers, amplifying a 550 bp of the COWP gene, all 11 samples were positive before WGA (data not shown). After WGA, 10/11 illustra GenomiPhi amplified samples (91%), 6/11 REPLI-g amplified samples (54·6%) and 9/11 GenomePlex amplified samples (81·9%) were PCR positive (Fig. 2). For Cgd6_5020 primers, amplifying 270 bp, all 11 samples were also positive before WGA. After WGA, 10/11 illustra GenomiPhi amplified samples (91%), 8/11 REPLI-g amplified samples (72·8%) and 11/11 GenomePlex amplified samples (100%) were PCR positive (data not shown). For Chro.20156 primers, amplifying 247 bp, 10/11 samples were positive before WGA, only W15519 sample was negative (data not shown). After WGA, 9/11 illustra GenomiPhi amplified samples (81·9%), 7/11 REPLI-g amplified samples (63·7%) and 11/11 GenomePlex amplified samples (100%) were PCR positive. The overall post-WGA PCR success rates from the 3 kits were 87·88%, 63·64% and 93·94% for illustra GenomiPhi, REPLI-g and GenomePlex kits, respectively (Table 2).
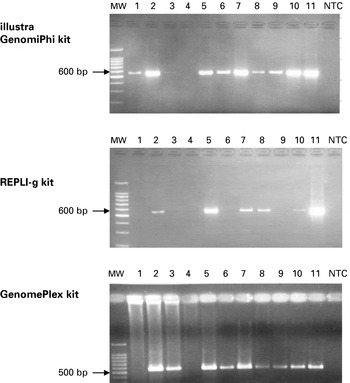
Fig. 2. PCR products of WGA amplified Cryptosporidium DNA isolates using Cry15/9 primers. MW: molecular weight marker, 1: W15504, 2: W15507, 3: W15508, 4: W15519, 5: W15521, 6: W15509, 7: W15511, 8: W15516, 9: W15517, 10: W15518, 11: C. parvum IOWA, NTC: non-template control.
Fidelity of WGA kits
The fidelity of amplification was assessed by PCR product sequence analysis, generated with and without a WGA intermediate step. For Cry 15/9 primers, PCR product sequences were identical using all 3 kits for W15507, W15511 and IOWA isolates (supplemental data). For W15516 isolate, WGA using REPLI-g kit produced 3 nucleotide errors and the use of GenomePlex kit produced 1 error, corresponding to 99·34% and 99·78% sequence concordance, respectively. For Cgd6_5020 and Chro.20156 primers, PCR product sequences were identical before and after WGA for all the samples. The overall fidelity of the 3 kits was 100%, 99·62% and 99·87% for illustra GenomiPhi, REPLI-g and GenomePlex kits, respectively (Table 2).
Interestingly, one of the samples tested (W15519) failed to amplify using Chro.20156 primers without WGA or after WGA using illustra GenomiPhi and REPLI-g kits, but did amplify when GenomePlex amplified DNA was used. The identity of the PCR product was confirmed by sequencing.
Comparative analysis of Cryptosporidium genomic DNA before and after WGA
Melt curve analysis of genomic DNA and WGA DNA amplified using the Illustra GenomiPhi confirmed that the same species of Cryptosporidium was present before and after WGA in each of the samples tested (data not shown). The unadjusted CT values show that 8/11 of the samples had a lower CT after WGA than before, indicating that in these samples the WGA did amplify Cryptosporidium DNA. After adjustment to allow for the 10-fold dilution applied through the WGA process, all of the samples had a lower CT value after WGA confirming that Cryptosporidium DNA was present in higher copy numbers in the samples post-WGA than before (Table 3). The highest difference of CT before and after WGA was 10·13 for sample W15516, which corresponds to over 30-fold increase in DNA target copy number. This is in accordance with the overall level of amplification. For the other samples, the difference in CT values before and after WGA ranged between 2·63 (for sample W15504) and 8·11 (for sample W15511), corresponding to an 8 to 27-fold increase in copy numbers. For sample W15508, the difference in CT value was 0·73 supporting a poor amplification.
Table 3. Real-time analysis of Cryptosporidium DNA before and after WGA and estimation of the increase in copy numbers after WGA using the illustra GenomiPhi kit

DISCUSSION
In this study, we successfully used WGA commercial kits for amplification of Cryptosporidium genomic DNA from clinical isolates. The Illustra GenomiPhi and GenomePlex kits successfully amplified the majority of the tested isolates (90·91% and 72·73%, respectively). The REPLI-g Kit, however, amplified less than half of the samples. One sample W15508 did not amplify with any of the 3 kits tested, while the reason for this cannot be known and the template concentration was well within the recommended range for the kits under test, it did correlate with the sample having the lowest concentration of template DNA tested and thus may reflect some degree of degradation of the DNA in that sample or relative enrichment of inhibitors carried through the DNA purification process.
For MDA-based kits (illustra GenomiPhi and REPLI-g), the amplified DNA was of high molecular weight. It was noticeable that most of the DNA remains in the well when run out on an agarose gel, this is likely due to the formation of very high molecular weight DNA forms, independent of the genome size, as previously reported by Detter et al. (Reference Detter, Jett, Lucas, Dalin, Arellano, Wang, Nelson, Chapman, Lou, Rokhsar, Hawkins and Richardson2002). OmniPlex-amplified DNA was of smaller size, which is due to the method used, involving fragmentation of the genomic DNA followed by linker ligation to enable amplification (Thorstenson et al. Reference Thorstenson, Hunicke-Smith, Oefner and Davis1998; Fiegler et al. Reference Fiegler, Geigl, Langer, Rigler, Porter, Unger, Carter and Speicher2007).
PicoGreen DNA quantification of the amplified DNA proved effective for Illustra GenomiPhi and GenomePlex kits. The yield range was 0·7–10 μg and 4·5–46 μg, respectively, which is in accordance with the manufacturer's claims. The apparent higher yield of GenomePlex kit corresponds with a higher reaction volume (10 μl versus 75 μl). In our hands, the PicoGreen quantification of REPLI-g kit amplified samples was not effective without prior purification of the amplified DNA.
The integrity of the amplified DNA was assessed by the ability to generate PCR product for 3 genetic loci and 87·88% (29/33), 63·64% (21/33) and 93·94% (31/33) of Cryptosporidium samples, amplified by illustra GenomiPhi, REPLI-g and GenomePlex kits, respectively, were PCR positive. For 1 sample, the W15519 isolate, no PCR amplification using Chro.20156 primers was observed before WGA or after WGA using illustra GenomiPhi and REPLI-g kits. However, GenomePlex amplified DNA of the same sample was PCR positive and the identity of the PCR product was confirmed by sequencing. These results suggest that the use of WGA-amplified DNA as PCR template can sometimes actually increase PCR sensitivity from clinical samples. Similar findings were reported for the detection of Trypanosoma species from blood samples (Pinchbeck et al. Reference Pinchbeck, Morrison, Tait, Langford, Meehan, Jallow, Jallow, Jallow and Christley2008). Further work to more thoroughly test the integrity of the amplified DNA and assessing amplification biases should focus on amplification of longer sequences and broader genomic coverage utilizing sequences from each of the 8 nuclear chromosomes, from the telemeres, centromeres, ribosomal DNA, mitochondrial DNA, and repetitive regions.
The fidelity of the amplification was assessed by PCR products sequence analysis before and after WGA. In our hands, for this sample set, the overall error rate observed was 0% for illustra GenomiPhi kit, 0·38% for REPLI-g kit and 0·13% for GenomePlex kit. Interestingly, all the errors arose from the same clinical sample using the same set of primers. This could be explained by a variety of factors such as the presence of impurities affecting the enzyme proof-reading activity, the secondary structure of the DNA, or by a low concentration of the starting material, which can decrease the amplification fidelity as reported by Bergen et al. (Reference Bergen, Haque, Qi, Beerman, Garcia-Closas, Rothman and Chanock2005). It is also important to bear in mind that although the sequences analysed were short ones, both the secondary amplification step and the sequencing step have the potential to introduce errors which would not be discriminated from errors arising during the WGA.
Sequence analysis of WGA amplified PCR products using Cry 15/9 primers showed the preservation of 6 species-specific Single Nucleotide Polymorphisms (SNP)s, one of which at position 66 is of particular interest as it corresponds to an RsaI restriction site used for Cryptosporidium genotyping as previously described (Spano et al. Reference Spano, Putignani, McLauchlin, Casemore and Crisanti1997). In addition, sequence analysis showed the preservation of 1 species-specific SNP for Cgd6_5020 gene and 5 species-specific SNPs for Chro.20156.
Comparative analysis of Cryptosporidium genomic DNA and paired WGA DNA using real-time PCR assay confirmed that Cryptosporidium DNA was specifically amplified using illustra GenomiPhi kit, resulting in higher copy numbers post-WGA than before for all the samples tested.
These results were obtained from semi-purified oocyst suspensions, themselves requiring reasonable numbers of oocysts in the original sample. They carry significant contamination of bacterial, fungal and even animal DNAs also amplified by the process. Real-time PCR for faecal marker DNAs such as genes from E. coli might be useful to determine whether there is any predisposition to amplifying contaminating DNAs rather than the cryptosporidium DNA in the samples. Additional investigation of the effect of other oocyst purification methods (immunomagnetic separation) on the performance of WGA should also be performed. Importantly, since many investigators use DNA extracted from raw stool without prior oocyst purification, independent validation of the suitability of this material for WGA and downstream analysis should also be undertaken.
For our collection of Cryptosporidium clinical isolates, illustra GenomiPhi WGA kit had the best performance, with 90·91% success rate, generating a high concentration of high molecular weight DNA with 100% fidelity. The additional cost of WGA is not prohibitive for clinical usage – using illustra GenomiPhi kit based on the 2009 recommended retail price in the UK the cost is roughly £3.60 per sample added to the PCR cost for routine detection of Cryptosporidium DNA. These are preliminary results, highlighting the usefulness of MDA based WGA for the accurate amplification of Cryptosporidium genomic DNA for the purposes of immortalization of clinical isolates and enabling extensive genetic testing.
This study investigated the suitability of Cryptosporidium DNA after WGA for genotyping purposes. We tested COWP marker as it is routinely used for Cryptosporidium speciation by RFLP, together with 2 novel markers. Our results showed efficient and specific amplification of Cryptosporidium DNA. Further validation of these WGA techniques for routine subtyping of Cryptosporidium (GP60, double- stranded RNA and mini and micro-satellite repeats) would be necessary and desirable before adopting WGA for routine characterization of clinical and environmental isolates of Cryptosporidium species.
ACKNOWLEDGEMENT
Thanks are extended to Guy Robinson for helpful suggestions.
FINANCIAL SUPPORT
This work was partially supported by funds from the European Commission for the HEALTHY WATER project (FOOD-CT-2006-036306). The authors are solely responsible for the content of this publication. It does not represent the opinion of the European Commission. The European Commission is not responsible for any use that might be made of data appearing therein.


