Introduction
Trypanosoma cruzi, the aetiological agent of Chagas disease, presents special features when compared with other eukaryotes, like a single mitochondrion that presents interlocked DNA circles (kDNA) contained in the kinetoplast and a typical cytoskeleton array (Soares, Reference Soares1999; De Souza, Reference De Souza2002). The arrangement of trypanosomatid cytoskeleton is simpler than those of most other eukaryotic cells; however, it is precisely organized and constituted by stable microtubules. Such microtubules compose the mitotic spindle, the basal body, the flagellar axoneme and the subpellicular microtubules, which are connected to each other and also to the plasma membrane, thus forming a helical arrangement along the central axis of the trypanosomatid cell body (Souto-Padron et al., Reference Souto-Padron, Cunha, Silva and De Souza1993; Schneider et al., Reference Schneider, Plessmann and Weber1997; Kohl and Gull, Reference Kohl and Gull1998; Alonso et al., Reference Alonso, Ritagliati, Cribb, Cricco and Serra2016; Vidal and De Souza, Reference Vidal and De Souza2017).
As in other eukaryotes, trypanosomatid microtubules are formed by α/β-tubulin heterodimers, comprising 13 typical protofilaments connected to each other (Vidal and De Souza, Reference Vidal and De Souza2017). In Trypanosoma brucei, the microtubule plus ends, more dynamic in tubulin polymerization/depolymerization, are found in the posterior end of the cell body. Microtubules are more stable in the protozoan anterior end that contains the flagellum, emerging from the basal body, which is physically linked to the kinetoplast (Robinson et al., Reference Robinson, Sherwin, Ploubidou, Byard and Gull1995).
The microtubules and tubulin undergo several post-translational modifications (PTMs), such as phosphorylation, glycosylation, ubiquitination, methylation and acetylation, which influence microtubule dynamics, organization, as well as cell differentiation and motility (Song and Brady, Reference Song and Brady2015; Wloga et al., Reference Wloga, Joachimiak, Louka and Gaertig2017). Tubulin was the first non-histone protein to be discovered as a PTMs target. Acetylation on Lys40 (K40) of α-tubulin is conserved from lower eukaryotes to mammals (L'hernault and Rosenbaum, Reference L'hernault and Rosenbaumt1985) and was associated for a long time with microtubule stability. This statement led to a controversial issue: does tubulin acetylation stabilize microtubules or is tubulin acetylated once it is stable? Currently, the second hypothesis is accepted as correct. It is also known that K40 acetylation occurs significantly on flagella, centrioles, cilia, basal body and the mitotic spindle (Piperno and Fuller, Reference Piperno and Fuller1985; Cambray-Deakin and Burgoyne, Reference Cambray-Deakin and Burgoyne1987; Szyk et al., Reference Szyk, Deaconescu, Spector, Goodman, Valenstein, Ziolkowska, Kormendi, Grigorieff and Roll-Mecak2014; Sadoul and Khochbin, Reference Sadoul and Khochbin2016).
Tubulin acetylation is better known in higher eukaryotes. In T. cruzi, molecular analyses identified two homologous sequences for tubulin-acetyltransferases (Alsford and Horn, Reference Alsford and Horn2011). Regarding deacetylases, SIR2 RP1 in Leishmania major was the first sirtuin (SIRT) homologue reported in trypanosomatids. Similarly to human SIRT2 and histone deacetylase 6 (HDAC6), SIR2 RP1 associates with the microtubule cytoskeleton and is able to deacetylase α-tubulin (Yahiaoui et al., Reference Yahiaoui, Taibi and Ouaissi1996; Tavares et al., Reference Tavares, Ouaissi, Santarém, Sereno, Vergnes, Sampaio and Cordeiro-Da-Silva2008). In T. brucei, SIR2 RP1 is located in the nucleus and is related to chromatin condensation and histone deacetylation (García-Salcedo et al., Reference García-Salcedo, Gijón, Nolan, Tebabi and Pays2003). According to the TriTryp gene bank, the T. cruzi genome presents two coding sequences for lysine deacetylases homologous to HDAC6 and two for sirtuins (http://tritrypdb.org/tritrypdb/). This parasite also presents the BDF3 protein, which plays a role in tubulin acetylation (Alonso and Serra, Reference Alonso and Serra2012; Alonso et al., Reference Alonso, Villanova, Ritagliati, Motta, Cribb and Serra2014).
Like tubulins, histones are also subject to several PTMs. In trypanosomatids, histones differ from their human counterparts regarding sequence, size and PTMs. In these parasites, histones are highly acetylated at the H2A C-terminus and contain multiple acetylation and methylation sites at the H4 and H3 N-terminus. Histone variants, such as H2Az and H2Bv, are also subject to PTMs (Thatcher and Gorovsky, Reference Thatcher and Gorovsky1994; Da Cunha et al., Reference Da Cunha, Nakayasu, De Almeida and Schenkman2006; Janzen et al., Reference Janzen, Fernandez, Deng, Diaz, Hake and Cross2006; De Jesus et al., Reference De Jesus, Nunes, Lopes, Martil, Iwai, Moretti, Machado, De Lima-Stein, Thiemann, Elias, Janzen, Schenkman and Da Cunha2016).
Histone acetylation and deacetylation are epigenetic marks that require two classes of enzymes: histone acetyltransferases (HATs) and HDACs. When HATs add an acetyl group to a histone lysine residue, the lysine positive charge is neutralized, possibly reducing the association between the histone octamer and the DNA. This results in a more relaxed chromatin state associated with an increase in transcription activation. HDACs act by removing the acetyl group of histones, resulting in an increase in histone and DNA interaction, associated with chromatin compaction and transcription suppression (Alsford and Horn, Reference Alsford and Horn2004; Khorasanizadeh, Reference Khorasanizadeh2004; Monneret, Reference Monneret2005; Legartová et al., Reference Legartová, Stixová, Strnad, Kozubek, Martinet, Dekker, Franek and Bártová2013; Angiolilli et al., Reference Angiolilli, Baeten, Radstake and Reedquist2017).
Histones are not the exclusive target of HATs and HDACs, which can act on transcriptional factors, nuclear receptors, chaperones, cytoskeleton components and DNA binding proteins. In trypanosomatids, HDACs are related to cell cycle, transcriptional repression, euchromatin organization and the expression of the genes that encode variant surface glycoproteins in T. brucei (Alsford and Horn, Reference Alsford and Horn2004; Marks et al., Reference Marks, Richon, Miller and Kelly2004; Monneret, Reference Monneret2005; Martinez-Iglesias et al., Reference Martínez-Iglesias, Ruiz-Llorente, Sánchez-Martínez, García, Zambrano and Aranda2008).
HDAC inhibitors (HDACi) have been widely used in chemotherapy against cancer and as a tool to understand the roles of these enzymes. Trichostatin A (TSA) is a derivative of hydroxamic acid isolated from Streptomyces hygroscopicus and first characterized as an anti-fungal agent (Tsuji et al., Reference Tsuji, Kobayashi, Nagashima, Wakisaka and Koizumi1976; Marks et al., Reference Marks, Richon, Miller and Kelly2004; Campo, Reference Campo2017). This compound is able to bind irreversibly to the catalytic site of HDAC I and II, preventing their connection to histones and resulting in their hyperacetylation (Toth, Reference Toth2004). TSA effects against cell proliferation, cell cycle progression and DNA condensation in tumour cell lines are well known, even when used in nanomolar concentrations (Martínez-Iglesias et al., Reference Martínez-Iglesias, Ruiz-Llorente, Sánchez-Martínez, García, Zambrano and Aranda2008; Legartová et al., Reference Legartová, Stixová, Strnad, Kozubek, Martinet, Dekker, Franek and Bártová2013).
Although TSA has been widely applied in studies with cancer cells, its effects on protozoan parasites, such as trypanosomatids, have been less exploited. In T. cruzi, TSA modulates the expression of genes required for division and differentiation, besides inhibiting metacyclogenesis, which is essential for parasite infectivity (Campo, Reference Campo2017). In the present study, it is demonstrated that TSA affects T. cruzi proliferation and viability, also promoting cell cycle arrest in the G2/M phase. Here we show for the first time, that this compound increased acetylation not only in parasite histones but also in tubulin, thus promoting microtubule cytoskeleton remodelling.
Material and methods
Trypanosoma cruzi culture
Epimastigote forms of T. cruzi Y were grown at 28 °C in liver infusion tryptose medium (Camargo, Reference Camargo1964) supplemented with 10% fetal calf serum for 3 days, corresponding to the growth exponential time.
Anti-trypanosomal activity assays
TSA (Sigma-Aldrich, Germany) was diluted in dimethyl sulphoxide (DMSO), obtaining a 5 mm stock solution. To verify inhibitor effects on T. cruzi, the compounds were applied at 1, 5, 10, 50 and 100 µ m for up to 72 h. The concentration of DMSO used was equivalent to the highest concentration of TSA. Parasites were collected every 24 h for counting in a Neubauer chamber. To compare the controls and the treated groups, paired t-tests were applied to the results at a 95% confidence interval (GraphPad Prism version 5.00 for Windows; GraphPad Software Inc., San Diego, CA, USA). To evaluate protozoa viability in the presence of the above-mentioned inhibitors, parasites were incubated with MTS [3-(4,5-dimethylthiazol-2-yl)-5-(3-carboxymethoxyphenyl)-2-(4-sulfophenyl)-2H-tetrazolium] and PMS (phenazine methosulphate) (Promega) for 4 h (Henriques et al., Reference Henriques, Moreira, Maia-Brigagão, Henriques-Pons, Carvalho and De Souza2011). Untreated parasites were fixed in 0.4% formaldehyde for 10 min and used as the negative control. The percentage of viable parasites was obtained through a spectrofluorometer (Molecular Devices Microplate Reader, SpectraMax M2/M2e, Molecular Devices, USA) at 490 nm. This analysis was performed by three independent experiments each one performed in duplicate.
Fluorescence light microscopy
To assess the occurrence of multinucleated parasites, cells were washed in PBS and fixed in 4% formaldehyde in PBS for 5 min and then deposited on slides previously coated with poly-L-lysine for 10 min and incubated with 4′,6-diamidino-2-phenylindole (DAPI, from Molecular Probes, USA) diluted at 1:500 for 5 min. The slides were then washed, mounted in ProLong Gold Antifade Mountant (Thermo Fisher Scientific, USA) and observed under Leica TCS-SPE (63× objective and 405 nm laser) and Elyra PS.1 (100× objective and 405 nm laser) microscopes. To determine the percentage of polynucleated parasites, 200 cells were counted. This analysis was performed by two independent experiments.
Immunofluorescence microscopy
To evaluate TSA effects on tubulin and acetylated tubulin expression, protozoa were washed in PBS and fixed and deposited on slides as previously described. Subsequently, parasites were incubated for 30 min in a blocking solution containing 3% bovine serum albumin, 0.5% teleostean gelatin (Sigma-Aldrich) and 1% saponin diluted in PBS (pH 8.0). The slides containing the cells were then incubated with antibodies against tubulin (1:100) (Sigma-Aldrich T5168) and acetylated tubulin (1:150) (Sigma-Aldrich T7451) overnight. The parasites were washed and incubated for 45 min with Alexa Fluor® 488 and Alexa Fluor® 546 (1:400) (Thermo Fisher Scientific). Samples were also incubated with DAPI for 5 min. The slides were then mounted and observed under Leica TCS-SPE (63× objective, 405 and 532 nm lasers) and Elyra PS.1 (100× objective, 405 and 543 nm lasers) microscopes. This analysis was performed by two independent experiments.
Cell cycle analysis by flow cytometry
To analyse the progression of the T. cruzi cell cycle during treatment with TSA, parasites were fixed in 1 mL of 0.25% formaldehyde in PBS for 5 min, and then washed and resuspended in 70% cold ethanol for 30 min. Subsequently, cells were washed and incubated with 5 µ m SYTOX® Green (Invitrogen, USA) for 30 min at room temperature. Trypanosoma cruzi was treated with 10 µ m camptothecin (CPT) as a cell cycle blockade, control (Zuma, et al., Reference Zuma, Mendes, Reignault, Elias, De Souza, Machado and Motta2014). The analysis was performed on a BD Accuri C6 flow cytometer (Becton Dickinson Bioscience BDB, San Jose, CA, USA), and data were analysed by the BD Accuri C6 software. This analysis was performed by two independent experiments.
Tubulin expression analysis by flow cytometry
For the analyses of tubulin and acetylated tubulin expressions, control and TSA-treated parasites were fixed, permeabilized and incubated with specific antibodies as described previously in item 2.5. Protozoa were then resuspended in PBS and the analysis was performed as described in the above item. This analysis was performed by two independent experiments.
Transmission electron microscopy
To assess TSA effects on T. cruzi ultrastructure, protozoa were fixed in 2.5% glutaraldehyde diluted in 0.1 M cacodylate buffer (pH 7.2) for 1 h and then washed in the same buffer. Parasites were post-fixed in 1% osmium tetroxide and 0.8% potassium ferricyanide, diluted in the same buffer, for 1 h. After washing in cacodylate buffer, cells were dehydrated in a graded series of acetone and embedded in Epon (Electron Microscopy Sciences, Hatfield, PA, USA). Ultra-thin sections were stained with uranyl acetate for 40 min and lead citrate for 5 min. The samples were observed under a Zeiss 900 transmission electron microscope (Zeiss, Oberkochen, Germany). This analysis was performed by two independent experiments.
Ultrastructural cytochemical analysis using phosphotungstic acid
Parasites were fixed as described above, dehydrated in ethanol and then post-fixed as previously mentioned. Subsequently, cells were incubated for 2 h in a solution containing 2% phosphotungstic acid (PTA) diluted in absolute ethanol and embedded in Epon. Ultra-thin sections were stained and observed as described above. This analysis was performed by two independent experiments.
Negative staining technique
To assess TSA effects on T. cruzi microtubule cytoskeleton, parasites were centrifuged and resuspended in culture media. Following this, 8 µL of this suspension were added on formvar film-coated grids, previously submitted to glow discharge (PELCO easiGlow™, USA) for 30 s. Grids containing the adhered cells were incubated with 0.1 M PHEM buffer (5 mm HEPES, 60 mm PIPES, 10 mm EGTA, 2 mm MgCl2) and 1% NP-40 (Sigma-Aldrich) for 5 min. After that, parasites were fixed as described above in PHEM buffer for 10 min. Then, samples were washed three times with deionized water for 5 min and contrasted with 8 µL of 1% aurothioglucose diluted in deionized water. The grids were then placed onto a sheet of filter paper to remove excess water and immediately observed. This analysis was performed by two independent experiments.
Scanning electron microscopy
To study T. cruzi morphology in the presence of TSA, parasites were fixed as presented in item 2.9 and adhered to poly-L-lysine-coated microscope coverslips. The samples were post-fixed, dehydrated (as previously described), critical point dried in CO2 and ion sputtered. The samples were observed under a Quanta X50 scanning electron microscope (SEM; FEI Company, The Netherlands). This analysis was performed by two independent experiments.
SEM after detergent membrane extraction
To analyse the organization of the T. cruzi microtubule cytoskeleton by SEM, parasites were washed in PHEM buffer, adhered to microscope coverslips and incubated with 1% NP-40 for 15–20 min at room temperature. Then, the samples were washed in PHEM and fixed for 20 min. Parasites were subjected to the same steps described above prior to viewing under the microscope. This analysis was performed by two independent experiments.
Quantitation of acetylated histones by LC-MS/MS
For proteomic analyses, protozoa were grown to a final concentration of 1 × 10⁷ cells mL−1 in a total volume of 5 mL. After 24 h, parasites were treated with 100 µ m of TSA or the equivalent volume of DMSO (control). Experiments were performed in triplicate. Cells were harvested after 72 h of treatment, washed in PBS solution and the pellets were then separated and kept at −80 °C.
Histones were extracted from the parasite pellets as described previously (De Jesus et al., Reference De Jesus, Nunes, Lopes, Martil, Iwai, Moretti, Machado, De Lima-Stein, Thiemann, Elias, Janzen, Schenkman and Da Cunha2016). Briefly, chromatin was extracted (Toro and Galanti, Reference Toro and Galanti1990) and histones were acid-extracted by HCl 0.3 M. Protein samples were quantified by the bicinchoninic acid protein assay kit (Thermo Fisher, USA) and 10 µg of each sample were trypsin-digested as described previously (Villén and Gygi, Reference Villén and Gygi2008). Peptides were resuspended in 0.1% formic acid and fractionated on an in-house reversed phase capillary emitter column (10 cm × 75 µm, filled with 5 µm C18 Aqua resins-Phenomenex) coupled to a nanoHPLC (1D plus – Proxeon). Fractionation was carried out on a 60 min gradient of 5–35% of acetonitrile in 0.1% formic acid followed by a 5 min gradient of 40–95% at a flow rate of 200 nL min−1. The eluted peptides were analysed by a LTQ-Orbitrap Velos (Thermo Scientific) (source voltage – 1.9 kV, capillary temperature – 200 °C) in data-dependent mode, where each full mass spectrometry (MS) scan (200–2000 m/z range) was followed by 10 MS/MS (from the most intense ions). The resolution was set as 30 000 and normalized collision energy at 35. Data were processed and analysed by the MaxQuant software (1.5.8.0). Searches were performed against a database containing all T. cruzi histones (57 sequences) downloaded at http://tritrypdb.org/tritrypdb/. Variable modifications were set as acetylation (N-terminus and K), methylation (K and R), demethylation (K and R) and trimethylation (K). MS1 (first stage of MS) tolerance was set at 10 ppm and MS2 (second stage of MS) of 0.5 Da. False discovery rate was set as 1%. Proteins classified as contaminants were removed from further analysis. A t-test was used for statistical analysis of acetylated peptides. For this end, intensity values (from protein groups output files) of acetylated peptides were normalized against the corresponding total histone content detected by LFQ values as performed previously (De Jesus et al., Reference De Jesus, Nunes, Lopes, Martil, Iwai, Moretti, Machado, De Lima-Stein, Thiemann, Elias, Janzen, Schenkman and Da Cunha2016). This analysis was performed by three independent experiments.
Statistical analyses
The statistical analyses were performed using two-way analysis of variance (ANOVA) and Bonferroni post-tests in the GraphPad Prism 7.0 software, with significance set at P < 0.05.
Results
The effect of TSA on T. cruzi epimastigote proliferation was the first aspect evaluated herein. Parasite growth was inhibited by 46 and 58% after treatment with 50 and 100 µ m TSA for 72 h, respectively. After applying lower concentrations of this inhibitor, such as 1, 5 and 10 µ m, no significant decrease in cell proliferation was observed (P > 0.05), even after a long period of treatment. The IC50 value obtained after 72 h of treatment was 60 µ m (Fig. 1).
Fig. 1. T rypanosoma cruzi epimastigote proliferation in the presence of TSA. The drug was added to the medium after 24 h of growth (arrow). The higher concentrations (50 and 100 µ m) inhibited parasite proliferation after 72 h of treatment. These data are the average of three independent experiments performed in duplicate. Two-way ANOVA and Bonferroni post-tests were performed considering *P < 0.05 and **P > 0.05.
Concerning cell viability, TSA caused a decrease in the number of viable parasites even when low concentrations were applied (P < 0.05). Thus, treatment with 5 and 10 µ m for 24 h reduced parasite viability in 22 and 26%. Higher doses, such as 50 and 100 µ m, led to 60 and 79% reduction in cell viability after the same treatment period (P < 0.001). Protozoa incubation at the highest concentration (100 µ m) for 72 h indicated that approximately 50% of treated cells were viable, suggesting a recovery of T. cruzi epimastigote viability (Fig. 2).
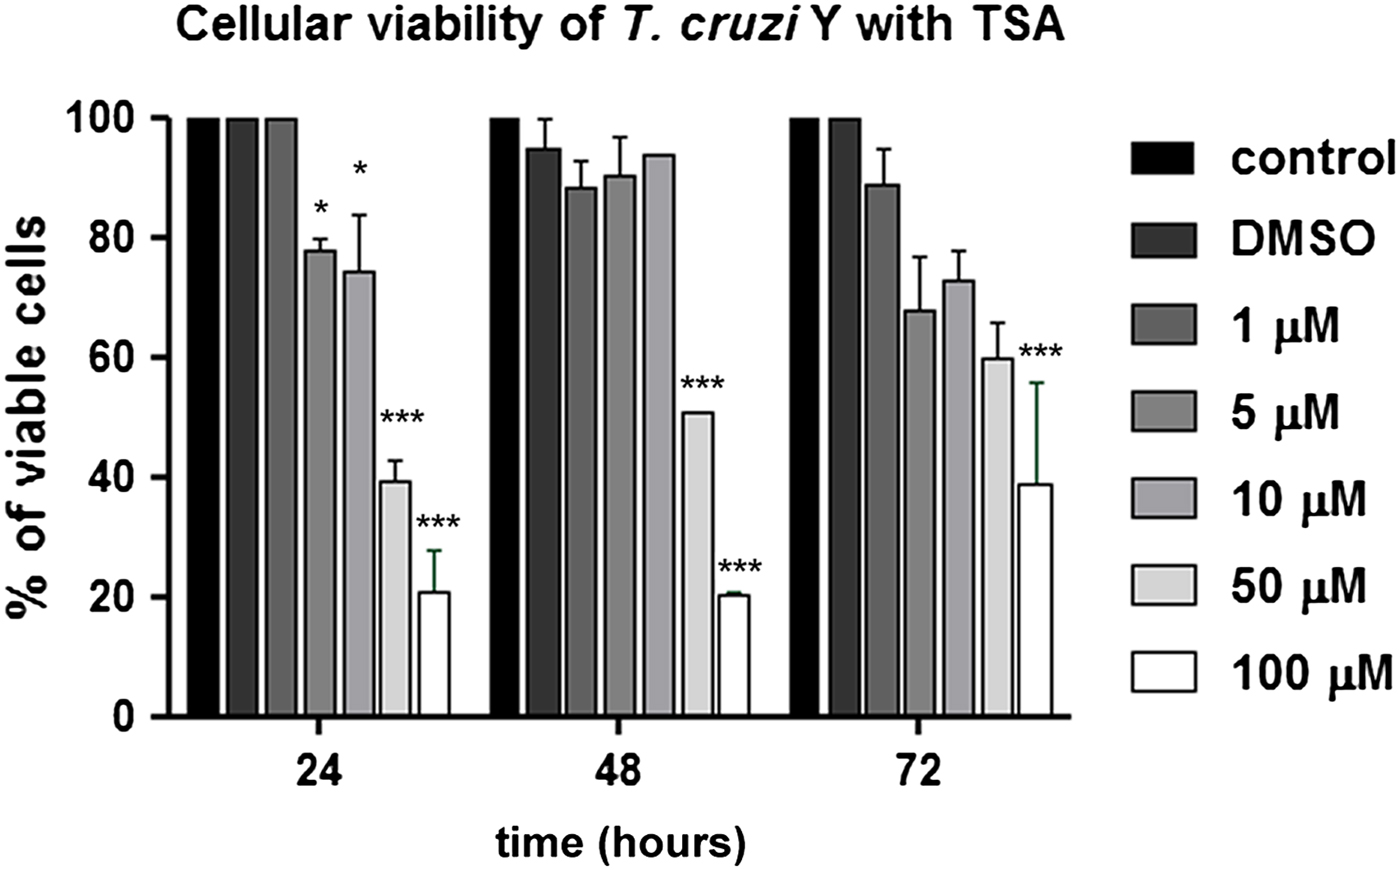
Fig. 2. Analysis of T. cruzi epimastigote viability in the presence of TSA using the MTS/PMS method. The 50 and 100 µ m concentrations promoted the highest reduction in cell viability. After 24 h in the presence of the compound, the percentage of viable parasites decreased to 40 and 21%, respectively. This graph represents the average of three independent experiments, in triplicate. Two-way ANOVA and Bonferroni post-tests were performed considering *P < 0.05 and ***P < 0.001.
Considering TSA effects on parasite proliferation and viability, the next step was to investigate if parasite ultrastructure was affected. Thus, cells were treated with different concentrations of the inhibitor for 72 h and analysed by transmission electron microscopy (TEM). Control parasites presented a spherical nucleus, with a central electron-dense region corresponding to the nucleolus, and condensed heterochromatin close to the nuclear envelope. The kinetoplast was observed in its characteristic bar shape, containing a condensed kDNA (Fig. 3A). When parasites were treated with TSA, even at high concentrations for long periods, no nuclear ultrastructural alterations were observed, opposite of what was expected, since it is well described that this inhibitor can affect DNA compaction and organization (Fig. 3B and C). kDNA topology was not affected either (Fig. 3B). Considering that the use of low TSA concentrations for short periods did not affect DNA packing, we have privileged analyses after long treatment with the highest drug concentration (100 µ m for 72 h). In such conditions, signs of cell death were not observed and approximately 40% of protozoa were viable.

Fig. 3. Transmission electron micrograph of T. cruzi epimastigotes treated or not with trichostatin A. (A) Control parasites. Note the nucleus containing the nucleolus (nu) in the central region and the heterochromatin (ht) compacted in the periphery. The kinetoplast (k) presented the typical epimastigote bar shape and contained the kDNA with the characteristic arrangement. (B–C) Epimastigotes treated with 5 and 50 µ m for 72 h of TSA, respectively. (D) The PTA technique did not evidence alterations in nuclear or mitochondrial DNA compaction even after treatment with 100 µ m for 72 h of the inhibitor. g, Golgi complex.
In a next step, TSA-treated cells were submitted to the PTA ultrastructural cytochemistry technique that reveals basic proteins, such as histones, to possibly observe heterochromatin unpacking. However, no evidence of nuclear DNA or kDNA unpacking was observed using this cytochemical approach (Fig. 3D). In order to verify this hypothesis, histone PTMs were evaluated in more details. Briefly, histones were extracted from control cells and from parasites treated for 72 h with 100 µ m TSA and analysed by LC-MS/MS. All histones were detected by MS with similar quantitative results in both conditions, indicating that TSA treatment did not alter their overall levels (no significant statistical difference). LFQ values in control vs TSA-treated samples for H2AZ + / − SEM: 2.6 × 10⁸ + / − 1.9 × 10⁷ and 3.2 × 10⁸ + / − 1.6 × 10⁷, respectively; LFQ values in control and TSA-treated samples for H4 + / − SEM: 2.6 × 10⁹ + / − 1.6 × 10⁸ and 3.0 × 10⁹ + / − 2.3 × 10⁸, respectively.
Acetylated histone peptides were detected and quantified for histone H4 (two sites), H2AZ (3 sites) and H1 (1 site). Interestingly, acetylation was enhanced in different histone types and sites after 72 h treatment with 100 µ m TSA (Fig. 4). Acetylation of H4K10 (H4K10ac/total H4 + / − SEM for control: 6.9 × 10⁻⁵ + / − 2.3 × 10⁻⁵; and for 100 µ m TSA: 2.6 × 10⁻⁴ + / − 2.7 × 10⁻⁵) and H4K10K14 (H4K10K14ac/total H4 + / − SEM for control: 1.5 × 10⁻⁴ + / − 2.4 × 10⁻⁵; and for 100 µ m TSA: 4.2 × 10⁻⁴ + / − 6.9 × 10⁻⁵) was increased, on average, 5.24- and 3.02-fold, respectively, upon TSA treatment. Increases in H2AZ acetylation were even more evident (quantitative intensity values + / − SEM: at residues 55 or 59: 2.5 × 10⁵ + / − 1.3 × 10⁵; at 32 or 36: 1.0 × 10⁶ + / − 5.5 × 10⁵ and at 168 or 169: 3.1 × 10⁶ + / −2.7 × 10⁵) since no acetylated peptides were observed in this histone at control samples. Histone H1 (TcCLB.509837.40) acetylated at residue 64 was detected only upon TSA treatment (quantitative intensity value of 1.1 × 10⁶ + / − 1.3 × 10⁴). Of note, fold changes for H2AZ and H1 acetylated peptides were not calculated since the corresponding acetylated peptide was not detected at the control samples. Thus, even though no major ultrastructural alterations in nuclear DNA compaction were observed upon TSA treatment, histone acetylation was deeply affected.
Fig. 4. T rypanosoma cruzi histone acetylation in the presence of TSA. After 72 h, acetylation at H4K10 and H4K10K14 was 5.4- and 3.02-fold higher, respectively, when compared with non-treated parasites. These data are the average of three independent experiments. Two-way ANOVA and Bonferroni post-tests were performed considering *P < 0.05 and **P < 0.01.
The TEM analysis, interestingly, indicated that, contrary to control cells (Fig. 5A–C), parasites treated with 50 or 100 µ m TSA for 72 h presented an atypical phenotype: basal bodies did not move apart during kDNA replication, resulting in abnormal protozoa presenting multiple nuclei and a single kinetoplast (Fig. 5D–F). Parasite morphology was also investigated by SEM in control- and TSA-treated cells. Non-treated epimastigotes presented a characteristic elongated cell body, thinner at the posterior end (Fig. 6A). TSA treatment led to the appearance of cytoplasmic projections at the posterior region of the parasite body, while the central area became rounded with protozoa presenting cell body shortening and torsion (Fig. 6B–D). The morphological changes described above corresponded to 32% of a total of 220 parasites. These results indicate that TSA could also affect tubulin acetylation that consequently promoted microtubule cytoskeleton remodelling. In order to explore this hypothesis, treated protozoa were analysed by combining different technical approaches.

Fig. 5. Transmission electron microscopy for the ultrastructural analysis of the T. cruzi epimastigote form. (A–C) In control parasites, the nucleus (n) contains the nucleolus (nu) in the central region while heterochromatin (ht) is mainly observed in the nuclear periphery. The kinetoplast (k) presents the typical bar shape and contains the kDNA with the characteristic arrangement of epimastigotes. (B–C) In control cells, the kDNA duplicates and segregates attached to the basal bodies (arrowheads), which move apart during this process. (D–F) In parasites treated with 100 µ m TSA, the duplicated kDNA is not segregated and doubled basal bodies are observed close to each other (arrowheads). As consequence, some cells present a single kinetoplast and multiple nuclei. g, Golgi complex.
Fig. 6. Scanning electron micrographs of T. cruzi epimastigotes. (A) Non-treated cell. Note the elongated cell body with thinner posterior end and with the occurrence of vesicles at the cell surface (thin arrows). (B–D) After TSA treatment, epimastigotes developed distinctive phenotypes. (B) Cell presenting double cytoplasmic projections on the posterior end of the cell (arrow). (B–C) Rounding of the cell body at the central region and shortening of the parasite body. (D) Protozoan with cell body torsion. The inset shows a higher magnification of the cytoplasmic projections on the posterior end of the body (arrow).
First, the microtubule cytoskeleton of T. cruzi epimastigotes was investigated by the negative staining method. TEM images demonstrated that control cells presented the typical parallel array of subpellicular microtubules, extending from the anterior to the posterior end of the parasite (Fig. 7A). In TSA-treated protozoa, cells presented an atypical microtubule arrangement, where the distance between microtubules seemed to have increased, resulting in cell body enlargement (Fig. 7B and C), as previously observed by SEM (Fig. 6). Furthermore, the posterior end of the parasites was often disrupted (Fig. 7B) and some cells presented two nuclei and a single kinetoplast (Fig. 7C).
Fig. 7. Negative staining of T. cruzi epimastigotes after membrane removal by a detergent to evaluate the microtubule subpellicular corset organization. (A) Control parasite. Note the uniform organization of microtubules, regularly interspaced and maintaining their cell shape even after membrane extraction. (B–C) Cells treated with TSA 100 µ m for 72 h. The parasite microtubule corset lacks its typical arrangement and becomes looser, especially at the posterior region of the cell. (C) Some parasites became multinucleated with a single kinetoplast after TSA treatment.
Analysis by confocal laser scanning microscopy demonstrated that parasites treated with 100 µ m TSA for 72 h presented higher fluorescence intensity of the cell body and flagellum when labelled with anti-acetylated tubulin antibody compared with non-treated protozoa. It was interesting to observe that the posterior end of cells was faintly labelled, and the occurrence of multinucleated parasites was also observed (Fig. 8A–F). Protozoa treated with TSA containing two nuclei and one kinetoplast (2N1K) represented almost 8% of the culture, whereas this phenotype was observed in only 2% of non-treated parasites.
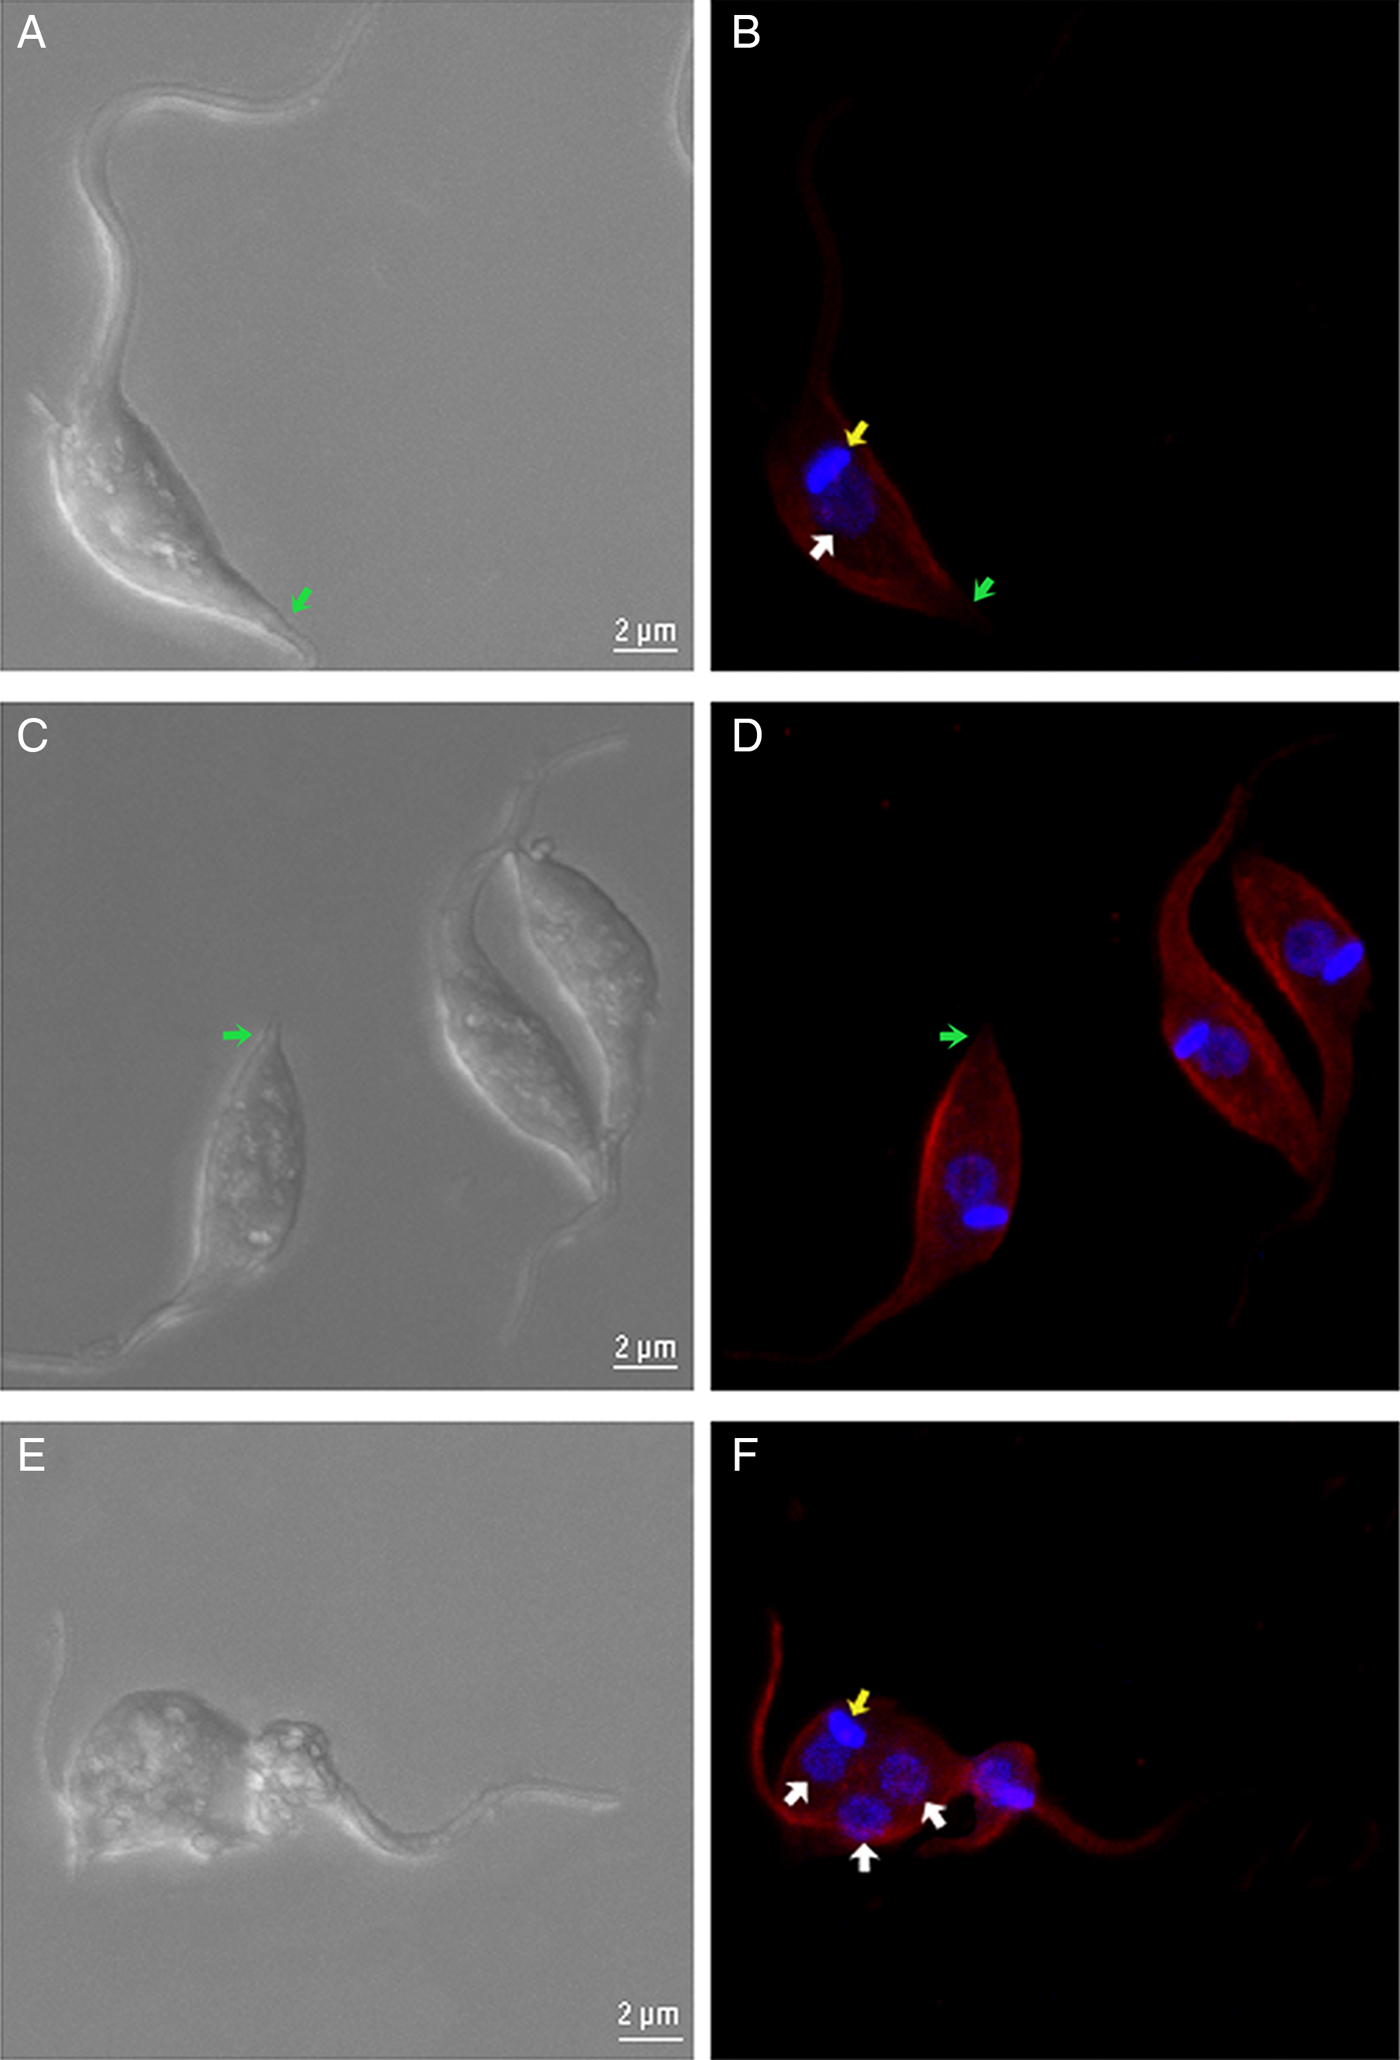
Fig. 8. Confocal fluorescence microscopy of control and TSA-treated parasites. (A), (C) and (E) DIC. (B), (D) and (F) parasites labelled with anti-acetylated tubulin antibodies and DAPI. (A and B) Non-treated cells. (C–F) Cells treated with 100 µ m TSA. In treated parasites, an increase in the fluorescence intensity is evident when compared with control cells. Note that the extreme posterior region of the cells (arrows), which contains the more dynamic plus end microtubule region, remains unlabelled. (F) A multinucleated phenotype was also observed. Red – acetylated tubulin; blue – DAPI; white arrow – nucleus; yellow arrow – kinetoplast; green arrow – extreme posterior end.
As a next step, the effect of TSA on tubulin acetylation was analysed by flow cytometry after labelling cells with anti-α-tubulin or anti-acetylated tubulin. When compared with non-treated cells, results indicated that parasite fluorescence intensity for total α-tubulin was enhanced after 24 h of treatment with 50 µ m TSA by 68%, whereas the use of 100 µ m of the inhibitor promoted an increase of 114%. Considering this same treatment period, values obtained for fluorescence intensity were augmented in 63 and 82% in cells labelled for acetylated tubulin after using 50 or 100 µ m TSA, respectively (Fig. 9A). As the treatment of epimastigotes with TSA proceeded up to 72 h, these values increased as follows: approximately 45 and 201% after using 50 or 100 µ m TSA, respectively, in cells labelled for total α-tubulin; 99 and 215% after applying 50 or 100 µ m TSA, respectively, in protozoa labelled for acetylated tubulin (Fig. 9B). Taken together, these data reveal that TSA increases the amounts of α-tubulin and acetylated tubulin in a concentration and time-dependent manner.

Fig. 9. Quantification of α-tubulin and acetylated tubulin labelling in control and TSA-treated cells. (A) Twenty-four hours TSA-treated cells. (B) Seventy-two hours TSA-treated cells. Two-way ANOVA and Bonferroni post-tests were performed considering **P < 0.01 and ***P < 0.001.
Cell cycle progression was also investigated by flow cytometry considering the increased number of cells containing two nuclei and one kinetoplast (2N1K) after TSA treatment. In control cells, most parasites were in G1, as expected. Treatment with 50 µ m TSA for up to 72 h did not affect significantly protozoa cell cycle. When 100 µ m of the inhibitor was used for 24 h, the number of parasites in G2/M increased by 7% in relation to the control group. After 72 h in the presence of the same drug concentration, this percentage reached 15% (Fig. 10). As a positive control of cell cycle arrest, parasites were treated with 10 µ m CPT since this compound is able to block the T. cruzi cell cycle at G2/M (ZUMA et al., Reference Zuma, Mendes, Reignault, Elias, De Souza, Machado and Motta2014). In this case, the percentage of cells in G2/M was 80% after treatment for 72 h.
Fig. 10. Cell cycle progression after TSA treatment. Control cells presented a typical pattern of DNA amount throughout the cell cycle: most of the parasites are in G1, generating a higher peak, followed by a steep slope representing the cells in S and, lastly, a smaller than G1 peak representing the cells in G2. Camptothecin (Cpt), a positive control of cell cycle arrest in G2. Two-way ANOVA and Bonferroni post-tests were performed considering **P < 0.01.
Discussion
Chagas disease is a serious and neglected health problem in Latin America and currently represents an emerging illness in non-endemic countries. Since its discovery, a wide range of compounds has been tested against T. cruzi, the aetiological agent of this pathology. Among tested drugs, some target enzymes involved with PTMs. Histone acetylation has emerged as a main epigenetic mark that modifies gene expression, thus affecting cell division and influencing environment adaptation (Clayton and Shapira, Reference Clayton and Shapira2007; Fan et al., Reference Fan, Krautkramer, Feldman and Denu2015). TSA is a HDACi that impairs the proliferation of tumour cell lines and human pathogens, such as Plasmodium falciparum, T. brucei and Toxoplasma gondii, being more effective against the two first species (Suzuki et al., Reference Suzuki, Yokozaki, Kuniyasu, Hayashi, Naka, Ono, Ishikawa, Tahara and Yasui2000; Jones-Brando et al., Reference Jones-Brando, Torrey and Yolken2003; Sheader et al., Reference Sheader, Te Vruchte and Rudenko2004; Wu et al., Reference Wu, Zhang, Chao, Zhang and Zhang2007; Zou et al., Reference Zou, Li, Wang, Cui, Li, Fu and Jiang2008; Wilson et al., Reference Wilson, Langer, Goodman, Mcfadden and Beeson2013). In the present study, we demonstrated that treatment of T. cruzi epimastigotes with TSA was relatively ineffective in blocking cell proliferation, since the IC50 value was 60 µ m after 72 h of treatment. This is in accordance with a previous report demonstrating that T. cruzi epimastigote growth belonging to the CL Brener strain were not affected after incubation with TSA (0.4 or 40 µ m) for 3 days (Campo, Reference Campo2017). Considering cell viability, 24 h TSA treatment led to an 80% reduction in the number of viable protozoa. However, after 72 h, the percentage of dead cells dropped to 44%, suggesting an ability of the parasite to revert mitochondrial damages over time, thus culminating in an increased number of viable protozoa. TSA is not a trypanocidal drug since it inhibits parasite proliferation instead of causing T. cruzi death. Considering MTS/PMS is based on mitochondrial activity, treated parasites present reduced mitochondrial activity but they are still able to proliferate. It is important to remember that trypanosomatids are capable of performing aerobic fermentation when the respiratory chain is inefficient (Cazzulo, Reference Cazzulo1992; Bringaud et al., Reference Bringaud, Reviere and Coustou2006). In tumour cells, TSA treatment decreased cellular viability in 60% when tested in synergy with 1 µ m tubastatin A (TST), which specifically targets HDAC6 (Sun et al., Reference Sun, Han, Liu, Fang, Tian, Zhou, Ma and Wu2014; Chao et al., Reference Chao, Lai, Liou, Chang, Wang, Pan and Teng2015).
According to the literature, TSA is able to promote unpacking, or even fragmentation, of nuclear heterochromatin (Toth, Reference Toth2004; Zou et al., Reference Zou, Li, Wang, Cui, Li, Fu and Jiang2008). Contrary to what was expected, T. cruzi nuclear organization was not affected after treatment with TSA and DNA condensation level was preserved, as demonstrated by TEM. To the best of our knowledge, this was the first time that TSA effects on T. cruzi histone acetylation were deeply analysed and quantified. Previously, Campo demonstrated that this inhibitor also enhanced the acetylation of H4 and H2B histones in epimastigotes and trypomastigotes belonging to the CL Brener strain. However, this analysis was performed by Western-blot assays using commercial antibodies (Campo, Reference Campo2017). In other human parasites, TSA was also shown to modulate gene expression in Entamoeba histolytica and P. falciparum (Ehrenkaufer et al., Reference Ehrenkaufer, Eichinger and Singh2007; Andrews et al., Reference Andrews, Gupta, Tran, Fairlie, Gobert and Bozdech2012).
Some reports associating TSA with cytoskeleton remodelling are available. One demonstrated that F-actin rearrangement is necessary for TSA-induced apoptosis in HeLa human cervical cancer cells. This is related to the fact that cytoskeleton dynamism is required for tumour cell death and is also associated with drug resistance (Yang et al., Reference Yang, Lee, Lee and Moon2014). The effect of TSA on tubulin acetylation has been attributed to its inhibitory action on HDAC6 (Furumai et al., Reference Furumai, Komatsu, Nishino, Khochbin, Yoshida and Horinouchi2001). In accordance with this hypothesis, CG-4 cells (a glioma cancer cells) presented increased acetylation levels of their microtubule network after treatment with 1 µ m TSA (Mangas-Sanjuan et al., Reference Mangas-Sanjuan, Oláh, Gonzalez-Alvarez, Lehotzky, Tőkési, Bermejo and Ovádi2014). Considering the effect of HDACi on tubulin acetylation, emphasis has been given to TST, which selectively inhibits the HDAC6, a cytosolic enzyme. In human breast cancer cells, TST enhances microtubule acetylation and increases its stability, thus suppressing individual microtubule dynamics (Asthana et al., Reference Asthana, Kapoor, Mohan and Panda2013).
In this study, morphological changes in T. cruzi epimastigotes can be attributed to tubulin hyperacetylation, which may have induced microtubule cytoskeleton reorganization. Thus, several atypical phenotypes were observed, such as parasites presenting a rounding central region, as well as cell body torsion and membrane projections at the posterior end. An investigation using the negative staining technique in TSA-treated protozoa revealed that the subpellicular microtubules seemed more distanced from each other and also presented a modified orientation when compared with the control group. Because of the accumulation of acetyl radicals, it is possible that proteins that associate neighbour microtubules or that link microtubules to the membrane had their activity altered or even prevented. The causal relationship between tubulin acetylation and microtubule stability is still not clear, but it has been discussed that deacetylase inhibitors may increase HDAC6 binding to microtubules. Thus, this enzyme would act as a microtubule-associated protein, capable of affecting cytoskeleton dynamism (Asthana et al., Reference Asthana, Kapoor, Mohan and Panda2013).
It was interesting to observe, by fluorescence microscopy, that the posterior end of the parasites was faintly labelled with anti-acetylated tubulin. This is associated with the fact that this region contains the plus end of microtubules, usually more dynamic and, thus, less acetylated. TSA-treated cells analysed by negative staining presented microtubule disruption at the posterior end of the cell body, reinforcing the idea that this structure is less stable in this region. In T. brucei, the RNAi knockdown of CAP51, a protein found in association with subpellicular microtubules, also promoted microtubule rearrangement. Enlargement of the central region of the cell body was reported, a phenotype observed herein in TSA-treated parasites (Portman and Gull, Reference Portman and Gull2014).
Our data obtained by flow cytometry clearly showed that microtubule acetylation increased after TSA treatment and it is associated with the fact that parasites showed cell body enlargement, as observed by negative staining images. Some studies have showed that TSA increased dramatically tubulin acetylation on cancer cells, while the induction of acetylated histone was considerably smaller (Androutsopoulos and Spandidos, Reference Androutsopoulos and Spandidos2017). Furthermore, TSA has been related to the orientation of the microtubule organizing centre (Serrador et al., Reference Serrador, Cabrero, Sancho, Mittelbrunn, Urzainqui and Sánchez-Madrid2004), acetylation of protein involved in mitotic spindle assembly (Park et al., Reference Park, Kwon, Paik, Kim, Lee, Choi and Lee2017) and cell motility impairment (Parab et al., Reference Parab, Shetty, Gaonkar, Balasinor, Khole and Parte2015). Thus, these data give us support to suggest that TSA induces microtubule cytoskeleton remodelling in T. cruzi. Nevertheless, T. cruzi microtubules may not be the main target of TSA, since the proteomic analysis pointed to alterations on histone acetylation, showing that the nucleus is also a cellular target of this compound. Based on that, it should take into account that on this parasite the mechanism of action of TSA may not be totally dependent on tubulin.
A coordinated duplication of nuclear and kinetoplast DNA during the S phase of the cell cycle is observed in T. cruzi epimastigotes. After kDNA replication, the kinetoplast assumes a more elongated disk shape and segregates at the beginning of the G2 phase. At that moment, cells present two basal bodies, both linked to the kDNA network (Elias et al., Reference Elias, Da Cunha, De Faria, Mortara, Freymüller and Schenkman2007). TSA treatment caused an atypical division pattern during T. cruzi cell cycle, namely the occurrence of multinucleated parasites containing two nuclei and one kinetoplast. Another interesting effect observed herein was the presence of parasites presenting replicated kDNA, associated with basal bodies, but without completing its segregation. It is worth mentioning that the treatment of T. cruzi with compounds that affect the parasite cytoskeleton, such as colchicine and taxol, is related to the occurrence of multiple organelles, atypical division patterns (two nuclei and one kinetoplast) and cytokinesis impairment (Baum et al., Reference Baum, Wittner, Nadler, Horwitz, Dennis, Schiff and Tanowitz1981; Potenza and Tellez-Iñón, Reference Potenza and Tellez-Iñón2015).
This indicates that TSA somehow promotes the stabilization between kDNA and basal bodies, which are composed by microtubules, thus impairing parasite cytokinesis. This may be related to the enhancement of microtubule acetylation, resulting in an increased number of T. cruzi epimastigote-treated cells in the G2/M phase.
The inhibition of HDACs by TSA has been described in cancer cell lines and human pathogens (Bauer et al., Reference Bauer, Varadarajan, Pidroni, Gross, Vergeiner, Faber, Hermann, Tribus, Brosch and Graessle2016; Altieri et al., Reference Altieri, Di Stadio, Federico, Miselli, De Palma, Rippa and Arcari2017; Garmpis et al., Reference Garmpis, Damaskos, Garmpi, Dimitroulis, Spartalis, Margonis, Schizas, Deskou, Doula, Magkouti, Andreatos, Antoniou, Nonni, Kontzoglou and Mantas2017). However, acetylation of non-histone proteins represents another important target that may regulate many essential cell functions, including protein–protein interactions and protein stability.
Conclusions
In the present study, we demonstrated for the first time that TSA affects microtubules in trypanosomatids, as evidenced by cytoskeleton remodelling and cytokinesis impairment. Our results reveal new concepts regarding microtubule cytoskeleton organization and structure in trypanosomatids. In the future, further assays are necessary to prove that this compound acts as a dual inhibitor by blocking protein deacetylase activity, both in the nucleus and cytosol.
Author ORCIDs
Aline Araujo Zuma http://orcid.org/0000-0002-1286-7045.
Acknowledgements
This work was supported by Fundação Carlos Chagas Filho de Amparo à Pesquisa do Estado do Rio de Janeiro (FAPERJ) and Conselho Nacional de Desenvolvimento Científico e Tecnológico (CNPq).