


Introduction
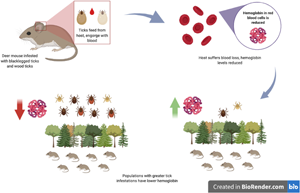
Blood-feeding by haematophagous ectoparasites, such as hard-bodied ticks (Acari: Ixodidae), is required to reach subsequent life stages (Arsnoe et al., Reference Arsnoe, Hickling, Ginsberg, McElreath and Tsao2015), and can have severe negative effects on the physiology and fitness of their vertebrate hosts (Dryden and Gaafar, Reference Dryden and Gaafar1991; Carleton, Reference Carleton2008; Pfäffle et al., Reference Pfäffle, Petney, Elgas, Skuballa and Taraschewski2009; Bordes et al., Reference Bordes, Blumstein and Morand2007; Godinho et al., Reference Godinho, Cripps, Coulson and Lumsden2013; Hersh et al., Reference Hersh, LaDeau, Previtali and Ostfeld2014; Jones et al., Reference Jones, Pekins, Kantar, Sidor, Ellingwood, Lichtenwalner and O'Neal2019). These effects include reduced haemoglobin levels (Carleton, Reference Carleton2008), regenerative anaemia (Pfäffle et al., Reference Pfäffle, Petney, Elgas, Skuballa and Taraschewski2009) and mortality related to blood loss (Jones et al., Reference Jones, Pekins, Kantar, Sidor, Ellingwood, Lichtenwalner and O'Neal2019).
The relationship between haematophagous parasites and the effects of their blood-feeding on their hosts is not clear (Kutzer and Armitage, Reference Kutzer and Armitage2016; Papkou et al., Reference Papkou, Gokhale, Traulsen and Schulenburg2016). Several black-legged ticks (Ixodes scapularis) can feed from white-footed mice (Peromyscus leucopus) at once or in succession due to exposed skin lesions that allow ticks to infest the same host despite a strong inflammatory response at the attachment sites that can increase host resistance (Anderson et al., Reference Anderson, Moore, Nagata, Ribeiro, Valenzuela and Sonenshine2017). Yet, insufficient immune responses could result in mice being vulnerable to other bacterial infections (Rosales et al., Reference Rosales, Jang, Pinero, Erikson, Beard and Ross1999; Dlugosz et al., Reference Dlugosz, Downs, Khokhlova, Degen and Krasnov2014).
Black-legged ticks and American dog ticks (Dermacentor variabilis) tend to feed on Peromyscus mice at immature stages (Ostfeld et al., Reference Ostfeld, Miller and Hazler1996; Sonenshine, Reference Sonenshine2018), and have been documented sharing the same areas on a host (Morshed et al., Reference Morshed, Scott, Fernando, Mann and Durden2003; Shaw et al., Reference Shaw, Keesing, McGrail and Ostfeld2003; Gómez-Rodríguez et al., Reference Gómez-Rodríguez, Gutiérrez-Granados, Montiel-Parra, Rodríguez-Moreno and Sánchez-Cordero2015). Deer mice (Peromyscus maniculatus) are competent vectors of several tick-borne pathogens, including Borrelia burgdorferi and Anaplasma phagocytophilum (Rand et al., Reference Rand, Lacombe, Smith, Rich, Kilpatrick, Dragoni and Caporale1993; Larson et al., Reference Larson, Lee and Paskewitz2018). However, because ticks feed on mice for a short period of time, it is difficult to measure any long-term impacts that they may have on host fitness.
Other ectoparasites that feed on Peromyscus mice for long periods of time (i.e. fleas, mites) are consistently affecting the vulnerability of their host' immune response (Mize et al., Reference Mize, Tsao and Maurer2011), reducing the amount of iron in the blood due to constant blood loss (O'Brien et al., Reference O'Brien, Morrison and Johnson2003), which could cause an insufficient production of haemoglobin (Judy and Price, Reference Judy and Price1958; Andrews, Reference Andrews1997). Iron-deficient black rats (Rattus rattus) were found to be susceptible to infections of the pathogen Salmonella typhimurium (Baggs and Miller, Reference Baggs and Miller1973) and botfly infections can decrease haemoglobin levels in deer mice, potentially reducing their capacity for thermogenesis and aerobic performance (Wilde et al., Reference Wilde, Wolf, Porter, Stager, Cheviron and Senner2018). Investigating how ectoparasite feeding habits influence the haematology of deer mouse hosts – with and without the presence of ticks – will allow us to better understand how black-legged and American dog ticks may impact host populations as these ticks move northward (Leighton et al., Reference Leighton, Koffl, Pelcat and Ogden2012).
The objective of this study was to determine if ticks have a significant effect on the haematology of deer mice by examining how tick prevalence and intensity influence host haemoglobin levels. Here, we focused on the relationship between haemoglobin levels in deer mice and ticks in general, as well as individual species: black-legged ticks and American dog ticks. It was hypothesized that: (1) if mice are parasitized by a greater intensity of ticks, then they will have lower haemoglobin levels compared to mice infested with ticks at low intensities because more blood-feeding is occurring at one time and (2) Deer mice that live in areas where ticks are prevalent should have lower haemoglobin levels than deer mice living in unestablished areas because they are being affected by blood-feeding. Individual mice that are infested with higher abundances of ticks are expected to have lower haemoglobin levels compared to a mouse with low tick abundance as more ticks are feeding from the same source at one time. Furthermore, mice that inhabit areas where ticks are prevalent and at high intensities are expected to have lower haemoglobin levels than mice that are ecologically naïve to these parasites. Examining the differences between naïve and experienced mouse populations as well as variation among individual mice can bridge the gap in understanding tick effects on a host to help make better predictions on how haematology can affect the ecology of Peromyscus.
Materials and methods
Field methods
Three sites in Ontario, Canada were visited for data and specimen collection from May to August 2019. The most southern site, Long Point Provincial Park (LP; 42.5817° N, −80.3952° W) is an area where both black-legged and American dog tick populations have been long-established (Watson and Anderson, Reference Watson and Anderson1976; Lindsay et al., Reference Lindsay, Barker, Surgeoner, McEwen, Elliott and Kolar1991). The other two sites, Queen Elizabeth II Wildlands Provincial Park (QEW; 44.7534° N, −78.7844° W) and Algonquin Provincial Park (AP; 45.3402° N, −78.2618° W) are areas with no established populations of black-legged ticks, although QEW has known established American dog tick populations (Minigan et al., Reference Minigan, Hager, Peregrine and Newman2018; P. Careless, QEW Park Biologist, personal communication). Neither black-legged ticks nor American dog ticks have colonized AP (Public Health Ontario, 2019). The sites chosen for this experiment convey the progression of the geographic expansion of black-legged ticks and American dog ticks in Ontario from both its southern and eastern populations (Hamer et al., Reference Hamer, Hickling, Walker and Tsao2014; Clow et al., Reference Clow, Ogden, Lindsay, Michel, Pearl and Jardine2016, Reference Clow, Leighton, Ogden, Lindsay, Michel, Pearl and Jardine2017; Minigan et al., Reference Minigan, Hager, Peregrine and Newman2018), and are areas within the geographical habitat range of deer mice; Bedford and Hoekstra, Reference Bedford and Hoekstra2015). Traplines were placed in similar forest types across sites to maintain a consistent or similar habitat, although sites were from different ecozones (Crins et al., Reference Crins, Gray, Uhlig and Wester2009).
At each site, three traplines at least 0.3 km apart from each other were set up with twenty Longworth traps (Penlon Ltd., Oxford, UK) set per line. Traplines were 90 m long and had two Longworth traps 10 m apart from each other every 10 m (Fryxell et al., Reference Fryxell, Falls, Falls and Brooks1998; Falls et al., Reference Falls, Falls and Fryxell2007). Traps were baited with water-soaked sunflower seeds and were set half an hour before sunset (2000 h-2100 h). Traps were checked half an hour before sunrise (0430 h-0530 h) after the mice had been active through the night (Clark and Durden, Reference Clark and Durden2002). The traps were set 5 days each week. They were checked 3 days consecutively, with a 1-day break, and then checked for two more consecutive days to reduce the amount of stress mice may have from repeated captivity or trap response behaviour (Nichols et al., Reference Nichols, Hines and Pollock1984). To account for a change in seasonality, and the difference in parasite assemblages that occurs within the spring-summer months, sampling alternated between the three sites in ascending latitude, spending 1 week at each site, three times, for a total of 3 weeks (‘sessions’) per site. Sessions were divided by early (May–June), mid (June–July) and late (July–August) summer. By alternating sites within the season, it was possible to account for the different assemblages that may be occurring within populations, as temperatures change, and specific parasites occur in different quantities.
Mice caught in traps were removed and weighed using a Pesola® scale (±0.1 g). Age was determined by body mass, where mice that were 15 g or less were considered juveniles, while mice greater than 15 g were considered adults (Banfield, Reference Banfield1974; Schmidt et al., Reference Schmidt, Mykytczuk and Schulte-Hostedde2019). Sex and reproductive status were determined visually. Enlarged testes in males and perforated vagina and the presence of nipples in females indicated reproductive individuals (Gaitan and Millien, Reference Gaitan and Millien2016). No pregnant females were included in this study. The age of ticks was determined by the number of legs the tick had, where the larva has six legs, and nymphs have eight (Lindquist et al., Reference Lindquist, Galloway, Artsob, Lindsay, Drebot, Wood and Robbins2016).
Upon capture, each mouse was examined for 60 seconds for a sampling of ectoparasites (Patterson et al., Reference Patterson, Neuhaus, Kutz and Ruckstuhl2013). Individual arthropod specimens were combed off the host using a louse comb sterilized with ethanol (Hawlena et al., Reference Hawlena, Krasnov, Abramsky, Khokhlova, Saltz, Kam, Tamir and Degen2006; Patterson et al., Reference Patterson, Neuhaus, Kutz and Ruckstuhl2013) or plucked off, using sterilized tweezers (Bobbie et al., Reference Bobbie, Schmidt, Foley and Schulte-Hostedde2016). These specimens were then placed in a collection vial with 80% ethanol (Krogmann and Holstein, Reference Krogmann, Holstein, Eymann, Degreef, Hauser, Monje, Samyn and VandenSpiegel2010). Tick identification was completed using guides (Lindquist et al., Reference Lindquist, Galloway, Artsob, Lindsay, Drebot, Wood and Robbins2016; Dubie et al., Reference Dubie, Grantham, Coburn and Noden2017), and were later confirmed by Dr Robbin Lindsay from the National Microbiology Laboratory (Winnipeg, Manitoba, Canada).
Captured mice were placed in a 50 mL Falcon conical centrifuge tube with a hole in the tip to allow for the mouse to breathe. By pushing gently above the tibia, the right hind leg of the mouse could be extended out of the tube and shaved using an electric trimmer (Parasuraman et al., Reference Parasuraman, Raveendran and Kesavan2010). Needles (20G) were used with a 1 mL syringe in accordance with the Standard Operating Procedure for Laurentian University and general principles of laboratory blood collection (Parasuraman et al., Reference Parasuraman, Raveendran and Kesavan2010). Blood samples consisted of 0.007 mL of blood/g of the mouse' body mass taken from the saphenous vein in the shaved hind leg of the mouse via needled syringe (Randolph, Reference Randolph1980; National Research Council Institute for Laboratory Animal Research, 1996; PREDICT One Health Consortium, 2016). On site, the blood samples were placed in a microcuvette specialized for the handheld haemoglobin analyser to test for haemoglobin concentrations: HemoCue Hb 201+ analyser (HemoCue AB, Ängelholm, Sweden; Tufts et al., Reference Tufts, Revsbech, Cheviron, Weber, Fago and Storz2013; Weldon et al., Reference Weldon, Abolina, Lenzi, Bourne, Riley and Viney2015). Results were provided immediately by the analyser and recorded.
It was necessary to shave the legs of the mice to acquire blood samples and so the shaved areas were also used as markers on the mice to indicate that they were already sampled to prevent sampling an individual more than once (Powell and Proulx, Reference Powell and Proulx2003). Although it is common for small mammals to be given ear tags for identification purposes in field studies (Harper and Austad, Reference Harper and Austad2001; Hersh et al., Reference Hersh, LaDeau, Previtali and Ostfeld2014; Torre et al., Reference Torre, Freixas, Arrizabalaga and Diaz2016; Buchholz and Dick, Reference Buchholz and Dick2017), Ostfeld et al. (Reference Ostfeld, Miller and Schnurr1993) found that this method will increase tick infestations on the host' ears. It should be noted that the exposed shaved legs of the mice in this study were never observed to have ticks or bite marks in this specific area, implying shaving the legs of the mice did not result in the same bias as ear tags do in attracting ticks. Instead, because their right legs were shaved, it was clear which mice were recaptures when returning to each site every 3 weeks, as the fur on these mice had not fully regrown. These mice were documented as recaptures and were not resampled. The legs of these recaptures were re-shaved, however, so that upon returning to the site in the next cycle, they could be clearly identified again.
Statistical methods
Prevalence and mean intensity of ectoparasites were completed using QPweb (Reiczigel et al., Reference Reiczigel, Marozzi, Fabian and Rozsa2019), where prevalence refers to the percentage of mice in a population with one or more ectoparasites (Bush et al., Reference Bush, Lafferty, Lotz and Shostak1997). For this study, mean intensity refers to the mean number of ectoparasites found across mice in a population, whereas abundance refers to the number of ectoparasites found on individuals (Bush et al., Reference Bush, Lafferty, Lotz and Shostak1997). An abundance of ticks was determined by the number of parasites per host (Rózsa et al., Reference Rózsa, Reiczigel and Majoros2000). Prevalence was examined as parasite species presence/absence per individual host. A total of 44 individual deer mice haemoglobin measurements were included in analyses among all sites. This included haemoglobin measurements from 16 adult female mice and three juvenile female mice, 20 adult male mice and five juvenile male mice.
Statistical analyses were conducted in the R environment (R core Team Reference R Core Team2019) r: a language and environment for statistical computing. r foundation for statistical computing, vienna, austria. https://www.r-project.org/. [v3.6.1]) using base R and the package ‘ggplot2’ (Wickham, Reference Wickham2016 [v3.2.1]) for figures. To determine differences in haemoglobin levels among source populations, a one-way ANOVA and Tukey' Honest Significance test were conducted, where haemoglobin levels were the response variable, and source population (LP, QEW, AP) was the predictor. The effect of differences in tick prevalence on mouse population haemoglobin levels was measured by comparing mean haemoglobin levels between population sources and across all individuals (LP + QEW + AP) when (1) all mice were included, (2) only mice infested with ticks were included, or (3) only mice not infested with ticks were included. Standard deviations of these means were also included. One-way ANOVAs were conducted for all individuals, and for each source population site comparing haemoglobin levels and tick prevalence (both black-legged and American dog tick together).
Due to the small sample size (n = 44), host age, sex and sexual reproduction were not included as predictor variables (Bouchard et al., Reference Bouchard, Beauchamp, Nguon, Trudel, Milord, Lindsay, Bélanger and Ogden2011). The predictor variables included in three statistical models were: (1) interaction term between general tick abundance per host and source population (LP, QEW, AP), tick nymph presence, and the session when each site was visited, (2) an interaction term between an abundance of American dog ticks per host and source population, an interaction term between an abundance of black-legged ticks per host and source population, tick nymph presence and session and (3) abundance of American dog ticks per host, an abundance of black-legged ticks per host, an interaction term between abundances of black-legged ticks and American dog ticks, and tick nymph presence. Since two tick species were involved in the analyses and their distributions varied, it was important to consider their interactions together and separately to determine any effects on deer mice haemoglobin levels.
The package ‘tidyverse’ (Wickham et al., Reference Wickham, Averick, Bryan, Chang, D'Agostino McGowan, Francois, Grolemund, Hayes, Henry, Hester, Kuhn, Pedersen, Miller, Bache, Muller, Ooms, Robinson, Seidel, Spinu, Takahashi, Vaughan, Wilke, Woo and Yutani2019 [v1.3.0]) was used to test multicollinearity between independent variables via variance inflation factors (VIF). All explanatory variables considered in analyses had VIF values <3 (Harrison et al., Reference Harrison, Donaldson, Correa-Cano, Evans, Fisher, Goodwin, Robinson, Hodgson and Inger2018; Frost, Reference Frost2019). Models were fitted as generalized linear models (GLMs) with a Gaussian distribution using a continuous variable as the response variable (haemoglobin levels). Shapiro–Wilk's tests showed that haemoglobin levels were distributed normally across individuals (P = 0.09). All other parametric assumptions were met via Breusch−Pagan test per model (for homoscedasticity; Breusch and Pagan, Reference Breusch and Pagan1979), and residual vs fitted plots (for linearity between the response variable and each predictor). No model had a leverage hat value >1.
Pearson' correlation formula was used to determine correlation coefficients between all predictor variables included in the final models and haemoglobin levels to determine effect sizes (Weber et al., Reference Weber, Stevens, Diniz-Filho and Grelle2016). Black-legged ticks and American dog ticks were weakly correlated (0.31). The source population was moderately to highly correlated with general tick, black-legged tick and American dog tick abundances (r = −0.76, r = −0.64 and −0.54, respectively). To avoid multicollinearity between these variables, Models 1 and 2 included an interaction term between tick abundances and source population.
Results
Across hosts, a total of 111 American dog ticks (16 of which were nymphs) and 28 black-legged ticks (two of which were nymphs; Table 1) were found. The average population sizes for each site across sessions (early, mid and late summer) were determined by the Lincoln–Peterson index (Grimm et al., Reference Grimm, Gruber and Henle2014): LP = 28 mice, QEW = 18 mice, AP = 11 mice (Table A1). LP had the greatest intensity and prevalence of both focal tick species, while AP had neither species present.
Table 1. Descriptive results including mean haemoglobin levels per site and prevalence and mean intensity (average abundance) of ectoparasites found on deer mice (Peromyscus maniculatus) across all sites and per site

Numbers in parentheses indicate the sample size of hosts for each column. LP, Long Point Provincial Park; QEW, Queen Elizabeth II Wildlands Provincial Park; AP, Algonquin Provincial Park; IS, black-legged ticks (Ixodes scapularis) abundance; DV, American dog ticks (Dermacentor variabilis) abundance.
Three general linear models were considered to analyse predictor variables that may be affecting the response variable – deer mouse haemoglobin levels. Across the models, the abundance of ticks (both species measured together and individually) were significantly correlated with deer mouse haemoglobin levels (P < 0.05; Tables 2–4), but only in LP (P < 0.05; Tables 2 and 3, Fig. 1). In general, the abundance of black-legged ticks and American dog ticks were also found to be significantly negatively correlated with haemoglobin levels in deer mice (P = 0.002 and P = 0.007, respectively), but their interaction was not (P = 0.521; Table 4; Figure 2). Pearson correlation coefficients between haemoglobin levels and tick species (both tick species together, black-legged ticks and American dog ticks separately) were moderately and negatively correlated (r = −0.49, −0.51, −0.5, respectively; Table A2), suggesting moderate effect size (Weber et al., Reference Weber, Stevens, Diniz-Filho and Grelle2016). The prevalence of nymphs was also found to significantly affect haemoglobin levels in Model 2 and Model 3, (P = 0.025; Table 3 and P = 0.033; Table 4), but not Model 1 (P = 0.292; Table 2, Fig. 3). This is likely due to the Pearson correlation value for nymphs, which was both negatively and weakly correlated with haemoglobin (−0.14; Table A2), suggesting a small effect size (Weber et al., Reference Weber, Stevens, Diniz-Filho and Grelle2016). For all models, the relationship between deer mice haemoglobin levels and the predictor field session (LP, QEW, AP) had P values >0.05 (Tables 2 and 3), suggesting that this variable had no significant effect on haemoglobin levels.

Fig. 1. Generalized linear regression results depicting the effect of general tick abundance on haemoglobin levels in deer mice (Peromyscus maniculatus; n = 44) when the source population is specified. Each point indicates an individual host. Shaded area indicates the 95% confidence interval. In this model, tick abundance was found to be significantly affecting haemoglobin levels at LP (Long Point) only (P value <0.01; Table 2).

Fig. 2. Generalized linear regression results depicting the effects of black-legged and American dog tick abundances on haemoglobin levels in deer mice (Peromyscus maniculatus; n = 44) when source population is specified. Each point indicates an individual host. Shaded area indicates the 95% confidence interval. (A) American dog tick abundance is significantly affecting haemoglobin levels (P value <0.01) as is (B) black-legged tick abundance (P value <0.01; Table 3).

Fig. 3. Generalized linear regression results depicting the effects of black-legged and American dog tick abundances on haemoglobin levels in deer mice (Peromyscus maniculatus; n = 44) when nymph presence is specified on the host. Each point indicates an individual host. The shaded area indicates the 95% confidence interval. (A) American dog tick abundance is significantly affecting haemoglobin levels (P value <0.01) as is (B) black-legged tick abundance (P value <0.01; Table 4), but not their interaction. Nymph presence was also found to be significantly affecting haemoglobin levels (P value <0.01; Table 4).
Table 2. Results of the general linear model on the effects of session when sample was collected (early, mid, late summer), nymph presence (Y/N) and the interaction between tick abundance (Ticks) and source population on haemoglobin levels in deer mice (Peromyscus maniculatus)

The symbols ‘**’ and ‘***’ indicate P values <0.01 and <0.001, respectively.
Null deviance: 148.48 on 43 degrees of freedom. Residual deviance: 105.58 on 38 degrees of freedom. LP, Long Point Provincial Park; QEW, Queen Elizabeth II Wildlands Provincial Park; AP, Algonquin Provincial Park.
Table 3. Results of the general linear model on the effects of session when sample was collected (early, mid, late summer), nymph presence (Y/N) and the interactions between black-legged tick and American dog tick abundances independently and source population on haemoglobin levels in deer mice (Peromyscus maniculatus)

The symbols ‘*’, ‘**’ and ‘***’ indicate P values <0.05, <0.01 and <0.001, respectively.
Null deviance: 148.48 on 43 degrees of freedom. Residual deviance: 77.67 on 38 degrees of freedom. IS, black-legged ticks (Ixodes scapularis) abundance; and DV, American dog ticks (Dermacentor variabilis) abundance. LP, Long Point Provincial Park; QEW, Queen Elizabeth II Wildlands Provincial Park; AP, Algonquin Provincial Park.
Table 4. Results of the general linear model on the effects of nymph presence (Y/N), black-legged tick abundance, American dog tick abundance and the interaction between black-legged tick and American dog tick abundances on haemoglobin levels in deer mice (Peromyscus maniculatus)

The symbols ‘*’, ‘**’ and ‘***’ indicate P values <0.05, <0.01 and <0.001, respectively.
Null deviance: 148.48 on 43 degrees of freedom. Residual deviance: 77.43 on 39 degrees of freedom. IS, black-legged ticks (Ixodes scapularis) abundance; and DV, American dog ticks (Dermacentor variabilis) abundance. LP, Long Point Provincial Park; QEW, Queen Elizabeth II Wildlands Provincial Park; AP, Algonquin Provincial Park.
An ANOVA testing the differences in haemoglobin levels across sites showed that there was a significant difference in haemoglobin levels among the sampled locations (P = 0.01). A Tukey' honest significance test showed that AP haemoglobin levels were significantly higher than those at LP (P adj = 0.01), and the differences between LP and QEW haemoglobin levels and between QEW and AP were not significant (P adj = 0.09 and P adj = 0.99, respectively; Figure 4). These differences are further explained by the differences in haemoglobin levels due to tick prevalence. ANOVA results showed a significant difference when ticks were present vs absent on a host across sites (P = 0.012), although within sites, this difference was not significant: QEW (P = 0.492), and AP (P = 0.814; Table 4). Since LP mice were all infested, tick prevalence could not be compared, however, LP mice did have the lowest mean haemoglobin levels overall (Table 4).

Fig. 4. Deer mouse (Peromyscus maniculatus) haemoglobin levels across each site (LP: n = 20. QEW: n = 7, AP: n = 17). ANOVA results show a significant difference across sites (P = 0.01). Based on a Tukey' Honest Significance test the comparative differences between sites are LP-QEW (P adj = 0.09), LP-AP (P adj = 0.01) and QEW-AP (P adj = 0.99). LP , Long Point Provincial Park; QEW, Queen Elizabeth II Wildlands Provincial Park; AP, Algonquin Provincial Park.
Discussion
Tick abundance
It was found that the abundance of black-legged ticks and American dog ticks negatively affected haemoglobin levels in individual hosts, though more specifically these abundances affected hosts in LP. The average haemoglobin measurement for non-infested mice in this study was 16.46 g dL−1. This is similar to the results in Wilde et al.'s (Reference Wilde, Wolf, Porter, Stager, Cheviron and Senner2018) study comparing haemoglobin levels of deer mice that are infested and not infested with botflies, where the average haemoglobin measurement for hosts not infected with botflies (Cuterebra sp.) was 15.79 g dL−1. However, the average haemoglobin level for mice with botfly infestations in Wilde et al.'s study (12.54 g dL−1) was lower than the results for mice in this study (15.17 g dL−1), suggesting other (endo)parasites may have greater negative effects on their hosts. However, it is important to note that haemoglobin variation can be affected by several different variables, such as altitude (Storz et al., Reference Storz, Sabatino, Hoffman, Gering, Moriyama, Ferrand, Monterio and Nachman2007), age (Wilde et al., Reference Wilde, Wolf, Porter, Stager, Cheviron and Senner2018) and dehydration (Kim et al., Reference Kim, Kim and Ryu2017).
The prevalence and intensity of ticks has been shown to have a negative effect on haemoglobin levels in several mammals. Two studies found that cattle calves infested with ticks had substantially lower haemoglobin levels compared to their non-infested counterparts (Rahman et al., Reference Rahman, Mostofa, Jahan and Kamal2009; Kaur et al., Reference Kaur, Jaiswal and Mishra2017). Similarly, a study on moose calves (Alces alces) that were moderately to severely infested with winter ticks (Dermacentor albipictus) had high mortality rates (Jones et al., Reference Jones, Pekins, Kantar, Sidor, Ellingwood, Lichtenwalner and O'Neal2019). Results from this study also show that both black-legged tick and American dog tick abundance affect haemoglobin levels in individual deer mice, which could be detrimental to their physiology. In European hedgehogs (Erinaceus europaeus), the blood-feeding activity of two tick species of the genus Ixodes (I. ricinus and I. hexagonus) resulted in lower haemoglobin levels and led to regenerative anaemia in several individuals (Pfäffle et al., Reference Pfäffle, Petney, Elgas, Skuballa and Taraschewski2009). Gaitan and Millien (Reference Gaitan and Millien2016) reported that white-footed mice infested with higher intensities of black-legged ticks tended to have lower movement rates than mice hosting fewer ticks, suggesting that higher infestation rates incapacitate these mice in some way. This may be related to lower haemoglobin levels, which can have a negative effect on oxygen transport (Storz et al., Reference Storz, Sabatino, Hoffman, Gering, Moriyama, Ferrand, Monterio and Nachman2007) and thermogenesis (Wilde et al., Reference Wilde, Wolf, Porter, Stager, Cheviron and Senner2018).
These studies suggest that the negative impacts of parasitism by black-legged ticks and American dog ticks could be detrimental, although not necessarily fatal. Hersh et al. (Reference Hersh, LaDeau, Previtali and Ostfeld2014) found that larval tick burdens do not affect the survival of Peromyscus hosts, and most of the ticks found in LP and QEW were found at the larval stage. Since larval ticks cannot transmit pathogens, but rather acquire them during this life stage (and then pass them on as nymphs; Huang et al., Reference Huang, Kay, Davis, Tufts, Gaffett and Tefft2019), Hersh et al.' (Reference Hersh, LaDeau, Previtali and Ostfeld2014) study suggests that it is not the tick burden alone which is affecting their hosts.
Black-legged ticks were only found in LP, therefore only LP mice have been seen to have their haemoglobin levels altered by this tick species, although it is possible that other mouse populations could see similar effects if they encountered black-legged ticks. The prevalence and intensity of American dog ticks at LP was also much higher relative to QEW and so it could be that tick parasite loads are only negatively affecting their hosts at high infestation rates. The interaction between the focal tick species in this study was not found to be significant. This suggests that there are no confounding effects occurring when both species are infesting a host.
Moreover, despite both species having a significant negative effect on haemoglobin levels in mice, the abundances of black-legged ticks and American dog ticks varied greatly. Infections can play a role in the haematology of the host, reducing blood cell counts, which can result in anaemia (Westblade et al., Reference Westblade, Simon, Mathison and Kirkman2017). Some infections can affect a host' haematology, such as Babesia protozoans that invade mature red blood cells and directly affect haemoglobin concentrations (Borggraefe et al., Reference Borggraefe, Yuan, Telford, Menon, Hunter, Shah, Spielman, Gelfand, Wortis and Vannier2006). Black-legged ticks can transmit Babesia protozoans to their Peromyscus hosts, but American dog ticks cannot (Westblade et al., Reference Westblade, Simon, Mathison and Kirkman2017), so it may be possible that black-legged ticks are indirectly affecting haemoglobin levels in hosts rather than directly by transmitting pathogens that affect the blood. A recent study found that Babesia odocoilei was identified in black-legged ticks at Long Point (Milnes et al., Reference Milnes, Thronton, Levéillé, Delnatte, Barta, Smith and Nemeth2019), so it is possible this may be occurring in the focal host species, but this variable was not examined in this analysis.
Nymph prevalence
Nymph ticks were shown to have a significant effect in the investigated models. Since nymph ticks are larger than larval ticks and can feed from hosts for longer periods of time (Estrada-Peña & de la Fuente, Reference Estrada-Peña and La Fuente2014; Kocan et al., Reference Kocan, de la Fuente and Coburn2015), they should consume more blood than their larval counterparts. Nymphs are also more likely to spread diseases, further affecting their host' physiology (Lindquist et al., Reference Lindquist, Galloway, Artsob, Lindsay, Drebot, Wood and Robbins2016). The larger blood meals and potential effects nymphs have on their host' physiology could explain how the prevalence of nymphs negatively affected haemoglobin levels. Yet, most nymphs in this study were American dog ticks, with only two black-legged nymphs counted. Few studies have compared the differences in blood meal volume between tick species in general, but Koch and Sauer (Reference Koch and Sauer1984) found that adult female wood ticks ingested greater volumes compared to black-legged ticks. Although there has not been any comparison between larval and nymph ticks of these species, wood ticks tend to be larger than black-legged ticks when unfed and engorged (Lindquist et al., Reference Lindquist, Galloway, Artsob, Lindsay, Drebot, Wood and Robbins2016). It is thus possible that nymph wood ticks can acquire greater blood volumes than nymph black-legged ticks, though further testing is required.
Haemoglobin variation across sites and tick prevalence
It was expected that the variation in tick species prevalence between deer mouse populations would affect haemoglobin levels, such that deer mice from a population where ticks have not established would have higher haemoglobin levels than mice from a population where ticks have established. Within sites, it was expected that there would be a difference in haemoglobin levels depending on the tick species intensities. It was found that haemoglobin levels significantly differed across sites, but not within sites. Haemoglobin levels differed significantly between LP, which had the highest tick intensity and greatest tick prevalence, and AP, which did not have an established American dog tick or black-legged tick population Table 5.
Table 5. Mean haemoglobin levels from each site including all deer mice (Peromyscus maniculatus) hosts, only hosts infested with ticks and only hosts not infested with ticks

The symbols ‘*’, ‘**’ and ‘***’ indicate P values <0.05, <0.01 and <0.001, respectively.
P values given are one-way ANOVA results between haemoglobin levels of deer mice infested with ticks vs mice without ticks. LP, Long Point Provincial Park; QEW, Queen Elizabeth II Wildlands Provincial Park; AP, Algonquin Provincial Park. It should be noted for AP, only one tick was documented at this site; was not a focal species.
As the global climate warms and more habitat becomes suitable for ixodid tick species, the geographic ranges of these species continue to expand and establish, infesting host populations previously naïve to such parasites (Leighton et al., Reference Leighton, Koffl, Pelcat and Ogden2012; Clow et al., Reference Clow, Ogden, Lindsay, Michel, Pearl and Jardine2016, Reference Clow, Leighton, Ogden, Lindsay, Michel, Pearl and Jardine2017; Minigan et al., Reference Minigan, Hager, Peregrine and Newman2018). Little is known about the effect of tick infestations on naïve mammal host populations (such as AP mice who have not been exposed to either focal tick species), despite the geographic expansion of these pathogen vectors (Rand et al., Reference Rand, Lacombe, Smith, Rich, Kilpatrick, Dragoni and Caporale1993; Larson et al., Reference Larson, Lee and Paskewitz2018; Sonenshine, Reference Sonenshine2018). In general, naïve hosts are especially vulnerable to initial parasitic interactions (Brockhurst et al., Reference Brockhurst, Buckling, Poullain and Hochberg2007), yet hosts that have prior exposure to ectoparasites tend to be more resistant than hosts that have not been exposed to them, due to their adaptive responses that have led to stronger immune defences (Kennedy, Reference Kennedy2010; Jones et al., Reference Jones, Brunner, Scoles and Owen2015).
Within sites, there was no significant effect of ticks on haemoglobin levels. However, the sample sizes across sites were imbalanced, and QEW had a small sample size (n = 8), with only two infested hosts, while the one individual infested with a tick in AP, was not infested with a focal species. Nonetheless, these results suggest that in general, tick abundance can reduce a host' haemoglobin level and that tick intensity affects haematology. Within a population, however, haemoglobin levels are not significantly different between infested mice and non-infested mice. It is possible that by having prior exposure (or lacking exposure) to these ectoparasites in a population, the immune defences within the population are similar (Nédélec et al., Reference Nédélec, Sanz, Baharian, Szpiech, Pacis, Dumaine, Grenier, Freiman, Sams, Hebert, Sabourin, Luca, Blekhman, Hernandez, Pique-Regi, Tung, Yotova and Barreiro2016). This could result in non-significant differences in haemoglobin levels, regardless of whether ticks are prevalent on individual hosts in that population.
Conclusion
Overall, haemoglobin levels varied depending on tick abundance across individuals and prevalence across populations. The most significant difference was between a population with a high infestation rate and a population with little to no infestation. Given that the baseline haemoglobin level for non-infested mice did not differ across populations, it is plausible that low infestation rates do not negatively affect the haemoglobin of deer mice. Tick abundance appeared to contribute most to haemoglobin differences in LP, where tick infestation was highest. When examining the effects of both tick species together, black-legged ticks only and wood ticks only, haemoglobin levels declined significantly when there were greater intensities of ticks on an individual. Despite black-legged ticks being found at lower intensities than wood ticks, both species significantly affected haemoglobin levels. These results should be considered as both focal tick species expand their geographic ranges and are introduced into new host populations (such as AP). The susceptibility to tick infestations and their effects has the potential to alter ecosystem processes that can ultimately affect other host species as zoonotic pathogens are transmitted from mice to ticks to other host species at higher trophic levels, including humans.
Data
The data that support the findings of this study are available from the corresponding author upon request.
Acknowledgements
We thank LR Lindsay, for his contributions to specimen identification, J Curtis for his contribution to data collection, and two anonymous reviewers for their insightful comments and suggestions.
Author contributions
EF conceived and designed the study, conducted data gathering and performed statistical analyses. EF wrote the manuscript with supervision, reviewing and support from ASH.
Financial support
Research for this paper was funded by a Discovery grant from the Natural Sciences and Engineering Research Council of Canada to ASH.
Conflict of interest
The authors declare there are no conflicts of interest.
Ethical standards
All methods in this study were approved by the Animal Care Committee (ACC) at Laurentian University, file number 6017269.


