INTRODUCTION
A positive relation between prevalence (percentage of infested hosts) and abundance (mean number of parasites per host individual) has been reported for various parasite and host taxa (Shaw and Dobson, 1995; Morand and Guégan, 2000; Krasnov et al. 2002, 2005a,b; Simkova et al. 2002). In general, this relation is a manifestation of one of the most pervasive ecological patterns, namely the positive relation between occupancy and abundance (Gaston, 2003). Various mechanisms have been suggested for the explanation of a positive relation between abundance and occupancy in general (see Gaston et al. 1997; Gaston, 2003) and between abundance and prevalence of parasites, in particular (see Anderson and Gordon, 1982).
Based on the universality of the occupancy/abundance relationships, Morand and Guégan (2000) hypothesized that prevalence of parasites could be successfully predicted using an epidemiological model with a minimal number of parameters such as mean abundance of a parasite, its variance and a parameter describing the parasite aggregation. Indeed, they found this for nematodes parasitic in mammals (Morand and Guégan, 2000). Because the aggregation parameter can be calculated from an empirical relationship between mean abundance and its variance, known as Taylor's power law (Taylor, 1961), the prevalence of nematodes was predicted accurately by a simple model involving only mean abundance of parasites and its variance. Similar results were reported for fleas parasitic on small mammals in temperate (central Slovakia) and arid (the Negev desert, Israel) regions by Krasnov et al. (2005a,b). In particular, in the temperate region, observed prevalences of fleas did not differ significantly from prevalences predicted from the epidemiological model using mean abundances of fleas and their variances (Krasnov et al. 2005a). However, in the arid region, additional information on host density was needed for the successful prediction of flea prevalences. The results of all cited studies suggested that no complex explanations such as niche breadth (Brown, 1984) and/or core-satellite (Hanski et al. 1993) hypotheses were needed to explain the positive prevalence/abundance pattern. Furthermore, prevalence appeared to be well predicted by mean abundance not only in permanent parasites like nematodes, tightly linked with host individuals, but also in periodic ectoparasites such as fleas that spend a considerably longer time on the hosts than is required merely to obtain a bloodmeal and the rest of the their time they spend in the host's burrow or nest. However, the generality of this prevalence/abundance relationship remains to be tested and it is still unclear whether prevalence can be successfully predicted from mean abundance and its variance in ectoparasites that visit the host for long enough to take a bloodmeal and do not depend on hosts for shelter.
Here, we used data on the abundance and distribution of larvae and nymphs of 2 species of ixodid ticks parasitic on small mammalian hosts in central Europe (Slovakia). These two species differ in their seasonal preferences, habitat specialization and association with host shelters. Ixodes ricinus occurs mainly during the warmer seasons and occupies a great variety of habitats (except those at elevations above 1000 m a.s.l.), whereas Ixodes trianguliceps is active all year round and in the study area occurs in mountain and sub-mountain habitats only (Lichard, 1965; Černý, 1972; Pet'ko et al. 1991), although in other areas it was found also in lowland habitats (Randolph, 1975). In addition, all development stages of I. trianguliceps inhabit mainly host burrows and nests (e.g. Shluger, 1961), whereas I. ricinus quests for hosts outside their shelters. We tested whether the prevalence of ticks can be predicted reliably from a simple epidemiological model that takes into account the most parsimonious set of abundance parameters, namely mean abundance and its variance.
MATERIALS AND METHODS
Mammal sampling and tick collection
Mammals were sampled and ticks collected between 1983 and 2001 in 18 locations across Slovakia (see details in Pet'ko et al. 1991; Stanko, 1996, 1998; Stanko et al. 2006). Mammals were captured using traps that were deposited in each location following the same protocol (see Stanko, 1996, 1998). Each trapping session (on average, 700 traps per session, ranging from 100 to 2000 traps; 201350 trap-nights in total) lasted 1–3 nights and totalled 120 sessions with 1–32 sessions per location. A total of 14368 individuals of 26 species of small mammals (rodents and insectivores) were trapped from which larvae, nymphs and adults of 3 tick species (I. ricinus, I. trianguliceps, Dermacentor reticulatus) species were collected. Among these ticks, D. reticulatus was the rarest species (10 larvae and 1 nymph only were collected) and was not included in the analyses.
Model
Epidemiological models (Anderson and May, 1985) predict that the probability distribution of parasite numbers per host individual, being negative binomial, determines the relationship between the prevalence of infection P(t) and the mean abundance of parasites M(t) at time t as

, where k is the parameter of the negative binomial distribution inversely indicating degree of aggregation.
There are several methods for estimation of k (Southwood, 1966; Elliott, 1977; Wilson et al. 2001). For example, k can be estimated using parameters a and b of Taylor's power law (Taylor et al. 1979). This law states that mean abundance (M) and variance of abundance [V(M)] of an organism are related as V(M)=aMb. Values of k can be estimated as

Another method to estimate k is to use the moment estimate of Elliot (1977), corrected for sample size

, where M is mean abundance, V(M) is variance of abundance and n is host sample size.
Data analysis
We included in the analyses only (a) samples where at least 8 host individuals of a particular species were found to be infested with a particular stage of a particular tick species and (b) tick stage-host associations that occurred in no less than 6 trapping sessions. The cut-off values for the inclusion of the data in the analyses were based on the assumption that the calculation of parameters of parasite abundance and community size could be inaccurate for small samples (Gregory and Woolhouse, 1993). This resulted in 12 776 individual small mammals of 5 rodent species (Apodemus agrarius, Apodemus flavicollis, Apodemus uralensis, Clethrionomys glareolus, and Microtus arvalis) from which 10879 larvae and 690 nymphs of I. ricinus and 1219 larvae and 261 nymphs of I. trianguliceps were collected. Initially, we tested differences in parasitological parameters (mean abundance, species richness and prevalence of ticks) among sampling years for each of 5 host species ANCOVA with host density as a covariate. In spite of density fluctuations in some species, none of the parasitological parameters varied significantly among sampling years in any host species (F10,13–12,48=0·7–1·8, P>0·05 for all). Consequently, data were pooled across sampling years for calculation of a and b of Taylor's power relationship (see below).
For each tick stage-host association in each trapping session, we calculated mean abundance (mean number of ticks per host individual), variance of abundance and prevalence. We calculated parameters a and b of Taylor's power law regressing log-transformed variance of tick stage abundance against log-transformed mean of tick stage abundance (both calculated within a trapping survey) for each tick stage-host association.
We calculated k using both the above methods, namely (a) using parameters a and b of Taylor's power law and (b) the moment estimate of Elliot (1977). Then we calculated the expected prevalence (Pexp) for each tick stage-host association in each trapping session based on the two estimates of k (Pexp1 and Pexp2, respectively), and compared the estimated prevalence with the observed prevalence for each tick stage-host association across trapping sessions using linear regression. We used t-tests to test whether the slopes of the resulted regression differed significantly from 1.
The level of aggregation was assessed and compared between tick species and stages both within and across hosts either using the exponent (b or slope) of Taylor's power relationship between mean abundance and its variance or via k values calculated using the moment estimate of Elliot (1977) for each tick stage on each host for each trapping session. The former is suggested as an indicator of a tendency of organisms to be mutually attracted and, thus, can be used as an estimator of aggregation (Perry, 1988). Comparisons using both aggregation estimators provided similar results, so only results of comparison of aggregation using b values are reported here.
We avoided an inflated Type I error by performing Bonferroni adjustments of the significance level across all analyses. Significance is recorded at the adjusted level.
RESULTS
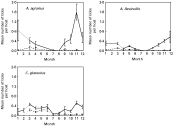
Larvae and nymphs of I. ricinus where found mainly from March to October–November and peaks of their abundance were relatively short (Fig. 1). Larval I. ricinus were most abundant in May–June in all host species except for M. arvalis in which the highest (relatively, but not absolutely) abundance was recorded in August–September (not shown in Fig. 1 due to low absolute abundance of ticks). Temporal distribution of the nymphal I. ricinus was characterized by lower peaks of abundance. Abundance of both larval and nymphal I. ricinus differed significantly among host species (Kruskal-Wallis ANOVAs, H=371·7 and H=39·3, respectively, N=10079, P<0·0001 for both), being the highest in A. flavicollis and the lowest in M. arvalis (for larvae 1·53±0·08 versus 0·09±0·18 per individual host, respectively; for nymphs 0·08±0·006 versus 0·01±0·01 per individual host, respectively; multiple comparisons of mean ranks, P<0·0001 for both).

Fig. 1. Seasonal abundance (means±S.E.) of Ixodes ricinus larvae (solid line) and nymphs (dashed line) on small mammalian hosts (except for Microtus arvalis due to low absolute tick abundance). Although ticks were aggregated among their hosts, seasonal abundance is presented as means following Randolph et al. (1999) because the median values rarely differed from zero.
In contrast, larval and nymphal I. trianguliceps occurred on hosts almost all year round with an apparent density decline in the middle of the summer (Fig. 2). Records of this species on A. uralensis and M. arvalis are rare, so associations with these two hosts were not included in the analyses. In A. agrarius, abundance of I. trianguliceps attained short-term peaks in January and November, whereas this tick peaked in December, with a following decrease and stability in January–March. A sharp December peak of I. trianguliceps abundance was recorded in A. flavicollis. No sharp short-term peaks of I. trianguliceps abundance were found in C. glareolus. Instead, tick abundance was relatively stable during most of the year with a period of low abundance in July–August. Abundance of nymphs, in general, followed that of larvae, although fluctuations of their abundance were much less pronounced. Abundances of both larvae and nymphs were relatively high in these latter hosts during either most of the year (C. glareolus) or for several months (A. flavicollis). As in I. ricinus, abundance of both larvae and nymphs of I. trianguliceps differed significantly among host species (Kruskal-Wallis ANOVAs ANOVAs, H=90·7 and H=79·0, respectively, N=4457, P<0·0001 for both). Abundance of larvae was highest in A. agrarius and lowest in A. flavicollis (0·59±0·09 and 0·20±0·02 per individual host, respectively) (multiple comparisons of mean ranks, P<0·001). Abundance of nymphs was highest in C. glarelolus and lowest in both Apodemus species (0·11±0·01 versus 0·03±0·01 (A. agrarius) and 0·03±0·003 (A. flavicollis) per individual host, respectively; multiple comparisons of mean ranks, P<0·001).

Fig. 2. Seasonal abundance (means±S.E.) of Ixodes trianguliceps larvae (solid line) and nymphs (dashed line) on small mammalian hosts. Although ticks were aggregated among their hosts, seasonal abundance is presented as means following Randolph et al. (1999) because the median values rarely differed from zero.
The estimated slope of the relationship between mean abundance and its variance in log–log space was significantly greater than 1 in all tick stage–host associations except nymphal I. trianguliceps–A. agrarius (Table 1). This indicated that ticks were aggregated in their hosts (Taylor, 1961). Furthermore, within host species, values of b were higher for I. ricinus than for I. trianguliceps and for larvae than nymphs. Among host species, b values for larval I. ricinus were similar, whereas those for nymphal I. ricinus and larval and nymphal I. trianguliceps differed.
Table 1. Summary of regression analyses of log variance on log mean abundance of ticks of different developmental stages on their rodent hosts (P<0·001 for all cases) (Slopes are significantly higher than unity (t-tests, P<0·01 for all cases). Abbreviations of names are (a) hosts – AAGR (A. agrarius), AFLA (A. flavicollis), AURA (A. uralensis), CGLA (C. glareolus), and MARV (M. arvalis); (b) ticks IRIC (I. ricinus) and ITRI (I. trianguliceps); and (c) stages – L (larvae) and N (nymphs).)

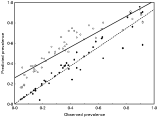
In general, regressions of prevalences of larvae and nymphs of I. ricinus expected from epidemiological models with k values calculated from Taylor's power law on observed tick prevalences produced slopes significantly lower than 1 and intercepts significantly higher than 0 for most tick stage-host associations (Table 2; and see Figs 3 and 4 for illustrative examples with A. agrarius and C. glareolus, respectively). This indicated that the models overestimated prevalences, that is, the expected prevalences, Pexp1, of both larvae and nymphs were higher than observed prevalences, Pobs (Fig. 3). However, if moment estimates of k corrected for host number were used instead, expected prevalences, Pexp2, of both larvae and nymphs I. ricinus in either host did not differ significantly from observed prevalences (Table 2; Fig. 3).

Fig. 3. Relationship between observed and expected (from the epidemiological models, with different k estimation) prevalence of larval Ixodes ricinus in Apodemus agrarius. Pexp1 – open circles, solid line; Pexp2 – closed circles, dashed line. See text for explanations.

Fig. 4. Relationship between observed and expected (from the epidemiological models, with different k estimation) prevalence of nymphal Ixodes ricinus in Clethreonomys glareolus. Symbols and lines are the same as in Fig. 3.
Table 2. Summary of regressions of expected (Pexp1 and Pexp2) from the epidemiological model against observed prevalences of ticks infesting rodents (all are significant, P<0·01) (k values for Pexp1 and Pexp2 were calculated using either Taylor's power law or corrected for host number moment estimate, respectively. See Table 1 for abbreviations of host, tick and stage names. * – slope does not differ significantly from 1 (t-tests, P>0·05), ** – intercept does not differ significantly from zero (t-tests, P>0·05).)

Regressions of prevalences of larvae and nymphs of I. trianguliceps expected from models using parameters Taylor's power law with observed tick prevalences produced slopes that did not differ significantly from 1 and intercepts that did not differ significantly from 0 for all tick stage-host associations (Table 2; see Figs 5 and 6 for illustrative examples with A. flavicollis). In other words, observed prevalences did not differ significantly from prevalences, Pexp1, predicted by the most parsimonious, whereas the models with moment estimates of k corrected for host number in some cases under-estimated relatively low larval prevalences and over-estimated relatively high larval prevalences, but predicted nymphal prevalences accurately (Figs 5 and 6).

Fig. 5. Relationship between observed and expected (from the epidemiological models, with different k estimation) prevalence of larval Ixodes trianguliceps in Apodemus flavicollis. Symbols and lines are the same as in Fig. 3.

Fig. 6. Relationship between observed and expected (from the epidemiological models, with different k estimation) prevalence of nymphal Ixodes trianguliceps in Apodemus flavicollis. Symbols and lines are the same as in Fig. 3.
DISCUSSION
This study demonstrated that (a) tick larvae and nymphs were aggregated among their hosts, but the degree of aggregation differed between tick species and stages; and (b) a simple epidemiological model successfully predicted prevalence of a habitat specialist (I. trianguliceps), but prediction of prevalence of a habitat opportunist (I. ricinus) required an additional parameter (host number) in the model.
Aggregation
Aggregation of pre-imaginal ticks among their hosts is not a new finding and has been repeatedly reported and discussed (e.g. Anderson and May, 1978; Randolph, 1975; Randolph et al. 1999). Furthermore, a coincident aggregated distribution is known for different tick stages, when the same fraction of hosts that are attacked by larval ticks is attacked by nymphs (see Randolph et al. 1996, 1999). The reasons for this can be both host-related and tick-related factors. For example, the host-related factors that contribute to coincident aggregation have been suggested to be a higher mobility and a higher level of immunosuppressive hormones in male small mammals (Randolph, 1977; Folstad and Karter, 1992; Hughes and Randolph, 2001a,b). Host age-associated parameters can also play an important role (e.g. Krasnov et al. 2006a) as young and aged individuals are generally highly susceptible to all macroparasites (Klein, 2004). Tick-related factors of co-feeding are represented, for example, by a highly synchronous variation in larval and nymphal abundance (Randolph et al. 1999).
Values of b found in this study where higher than 1 (except for nymphal I. trianguliceps exploiting A. agrarius) but not higher than 2, supporting the results reported for most parasites (Shaw and Dobson, 1995). We found higher b values in I. ricinus than in I. trianguliceps, suggesting a relatively higher degree of aggregation in the former. The difference in the level of aggregation between the two tick species could be caused by mere difference in their abundance simply because the hosts ‘heavily infested’ with I. trianguliceps harboured fewer ticks than hosts ‘heavily infested’ with I. ricinus. For example, larval abundance of I. ricinus and I. trianguliceps on an individual host attained 396 and 59 ticks (on A. flavicollis), respectively, whereas maximal nymphal abundance on this host was 15 for I. ricinus (on A. flavicollis) and 4 for I. trianguliceps (on C. glareolus). Alternatively, lower aggregation in I. trianguliceps can be explained by the fact that it is found on hosts throughout most of the year, whereas I. ricinus feeds on hosts seasonally. If aggregated distributions arise simply from the summing of different subpopulations with different mean abundances (Grafen and Woolhouse, 1993), then summing data for the entire year can result in a lower apparent aggregation. Nevertheless, lower aggregation levels for I. trianguliceps compared with those for I. ricinus were found using the values of k calculated for each tick stage on each host for each trapping session, suggesting that the difference in aggregation level between two ticks was caused by biological reasons and was not a statistical artifact.
Relatively low abundance of I. trianguliceps has been reported in other regions (Randolph, 1975; Estrada-Peña et al. 1992). This can be caused by relatively low fecundity in this species. Indeed, egg production by an engorged female I. trianguliceps was estimated as 1000–2000 in Great Britain (Randolph, 1975) or even as low as 350–500 in Siberia (Filippova, 1977), whereas an engorged female I. ricinus can lay 3000–5000 eggs (e.g. Honzáková et al. 1975). Low fecundity, in turn, was considered to result from low mortality of each developmental stage of I. trianguliceps (Filippova, 1977) because they mainly inhabit burrows and underground nests of their smal mammalian hosts as well as forest litter.
In most tick stage-host associations, b values for larvae were higher than those for nymphs suggesting a higher degree of aggregation in the former. The most obvious cause for this is that the distribution of tick larvae is itself aggregated because they arise as ‘a package’ from 1 large egg mass (Randolph and Steele, 1985). As a result, a host that by chance encounters an egg mass will likely be heavily infested with larvae, whereas those hosts evading egg masses will likely harbour few or no larvae. However, there is no consistency in reports on relative levels of aggregation in larval and nymphal ticks. Larval aggregation was either higher than (Randolph, 1975; Nava et al. 2006), lower than (Randolph et al. 1999) or similar to (Nava et al. 2006) nymphal aggregation. It seems that a number of both host-related and environment-related factors contribute to variation in the pattern of relative level of aggregation in larvae and nymphs. In addition, it is also possible that this pattern varies among tick species, being a manifestation of species-specific level of aggregation as was found in other ectoparasites (Krasnov et al. 2006b). Finally, a low aggregation level in nymphs can result from their low abundance and, thus, from the low absolute nymph number on ‘heavily infested’ hosts (see above; but see Randolph et al. 1999).
Simple model successfully predicts tick prevalence
Our results demonstrated that a simple epidemiological model can predict accurately the occurrence of ticks in populations of their hosts. This model takes into account two main parameters, namely mean abundance and its variance. Mean abundance, in turn, explained up to 99% of the variance in abundance via Taylor's power relationship. The ability of this model to predict successfully tick prevalence demonstrates the sufficiency of the most parsimonious set of factors to explain much of the variance in prevalence without involving complicated mechanisms such as the degree of host specificity or the level of host resistance. Thus far, the predictability of prevalence from mean abundance has been supported by studies of parasites that are tightly associated with their hosts, such as nematodes (Morand and Guégan, 2000) and fleas (Krasnov et al. 2005a,b). This study demonstrated that a simple epidemiological model can be applied also to more ‘temporary’ parasites. Although ticks spend relatively little time on their hosts and their distribution is heavily affected by the external environment (e.g. Estrada-Peña et al. 2004), their prevalence appeared to be strongly determined by their mean abundance. It should be noted, however, that the tick mean abundance itself can be affected by environmental factors (e.g. Estrada-Peña, 2001) either directly or affecting their questing behaviour (Perret et al. 2000).
The epidemiological model predicted accurately the prevalence of I. ricinus only when it took into account host number. This confirms the important effect of host density on tick abundance distribution (e.g. Hudson et al. 1995; Norman et al. 1999; Rosà et al. 2003). However, this was not the case for I. trianguliceps. When the models used k values calculated using moment estimation, prevalence was predicted almost equally well as those that used k values calculated from the Taylor's power relationship. This suggests that the confounding effect of the off-host environment (in terms of sharper stochastic environmental fluctuations acting on the habitat generalist tick than on the habitat specialist tick) on the relationship between tick abundance and distribution. In addition, the association of I. trianguliceps with hosts and, especially, host shelters is tighter than that of I. ricinus (Randolph, 1975; Filippova, 1977). It has been mentioned above that all developmental stages of I. trianguliceps largely inhabit host burrows and nests (Filippova, 1977). In contrast, I. ricinus usually quests for their hosts outside their shelters and, thus, is subject to a variety of environmental factors. Relative microclimatic stability of hosts' shelters can, therefore, diminish the effect of environmental stochasticity on I. trianguliceps dynamics. This can be one of the reasons for the accuracy of the model with a minimal number of parameters to predict prevalence of this species.
Nevertheless, differential success of the prevalence prediction between the two models that used the k parameter calculated by different techniques suggests that the calculation of k from Taylor's power relationship should be used cautiously, although it was used successfully in other studies (Morand and Guégan, 2000; Simkova et al. 2002; Krasnov et al. 2005b). This suggests that the simple epidemiological model used here should be modified in order to incorporate some missing ingredients, such as host density and tick behaviour. The improved power of the modified model could be determined by the accuracy of the prevalence prediction.
We thank Allan Degen, Lajos Rozsa and two anonymous referees for their helpful comments on an earlier version of the manuscript. This study was supported partly by the Slovak Grant Committee VEGA (grant no. 2/5032/25 to M. Stanko). This is publication no. 539 of the Mitrani Center of Desert Ecology and no. 216 of the Ramon Science Center.