INTRODUCTION
The liver fluke Fasciola hepatica is one of the most important parasites causing substantial economic losses in cattle farming worldwide, mainly due to reductions in milk yield, weight gain and fertility as well as liver condemnation (Boray, Reference Boray, Gaafar, Howard and Marsch1985; Kaplan, Reference Kaplan2001). In cattle, the infection is mainly subclinical. The lack of visible clinical signs seems to support the farmers’ perception that the animals are healthy and can remain untreated (Cawdery et al. Reference Cawdery, Strickland, Conway and Crowe1977; Kaplan, Reference Kaplan2001). Economic losses due to fasciolosis were calculated by Schweizer et al. (Reference Schweizer, Braun, Deplazes and Torgerson2005a) as 52 million euros per year for Switzerland with about 68% of losses due to reduced milk production and fertility (Knubben-Schweizer et al. Reference Knubben-Schweizer, Deplazes, Torgerson, Rapsch, Meli and Braun2010a). The reduction in milk yield can vary from 3% to 86% (Ross, Reference Ross1970; Ribbeck and Witzel, Reference Ribbeck and Witzel1979; Randell and Bradley, Reference Randell and Bradley1980; Charlier et al. Reference Charlier, Duchateau, Claerebout, Williams and Vercruysse2007). However, economic losses can be prevented to a certain extent by flukicide treatment: for heifers, it could be shown that closantel treatment between days 80 and 42 before calving resulted in a 3·3% increase in milk yield and a 9% higher persistence in the subsequent lactation (Charlier et al. Reference Charlier, Hostens, Jacobs, Van Ranst, Duchateau and Vercruysse2012). Examination of bulk tank milk (BTM) for antibodies by an ELISA is a suitable method for screening herds. According to Charlier et al. (Reference Charlier, Duchateau, Claerebout, Williams and Vercruysse2007) an increase of antibody titres against F. hepatica in BTM leads to a decrease in annual milk yield. This was confirmed by Kuerpick et al. (Reference Kuerpick, Fiedor, von Samson-Himmelstjerna, Schnieder and Strube2012a), who also found a significant negative correlation between average annual milk yield and F. hepatica antibody levels in BTM.
The spatial distribution of F. hepatica is primarily determined by climatic conditions: a moderate climate with adequate moisture is necessary for the intermediate host, the amphibic snail Galba (Lymnea) truncatula (Mitchell, Reference Mitchell2002). Schweizer et al. (Reference Schweizer, Meli, Torgerson, Lutz, Deplazes and Braun2007) found that the infection risk of G. truncatula with F. hepatica was significantly higher in populations originating from spring swamps, wells and reeds compared with populations from streams. Altogether, sufficient moisture and suitable temperatures (above 10 °C) for snail reproduction, development of miracidia, and completion of development into cercariae in the snail are principal factors that determine the incidence of fasciolosis (Boray, Reference Boray, Gaafar, Howard and Marsch1985). Because development of F. hepatica depends on climatic and environmental conditions, the spatial component in the epidemiology of the disease and spatial distribution models have been estimated for several regions in the world (Malone et al. Reference Malone, Gommes, Hansen, Yilma, Slingenberg, Snijders, Nachtergaele and Ataman1998; Yilma and Malone, Reference Yilma and Malone1998; Cringoli et al. Reference Cringoli, Rinaldi, Veneziano, Capelli and Malone2002; Tum et al. Reference Tum, Puotinen and Copeman2004; Durr et al. Reference Durr, Tait and Lawson2005; Fuentes, Reference Fuentes2006; Rapsch et al. Reference Rapsch, Schweizer, Grimm, Kohler, Bauer, Deplazes, Braun and Torgerson2006; Dutra et al. Reference Dutra, Molento, Naumann, Biondo, Fortes, Savio and Malone2010; McCann et al. Reference McCann, Baylis and Williams2010a; Bennema et al. Reference Bennema, Ducheyne, Vercruysse, Claerebout, Hendrickx and Charlier2011).
To date, the seroprevalence of F. hepatica in Germany is only known for selected regions. Koch (Reference Koch2005) examined BTM samples in the German federal state of Bavaria from 2003 to 2005 with the commercially available Pourquier ELISA and found a mean prevalence of 32·2% and a regional prevalence of 64·5% in alpine uplands. For the federal state of Schleswig-Holstein, which is located in the upper north of Germany between the North Sea and the Baltic Sea, a prevalence of 50% was reported for 2006 analysing BTM samples with the Pourquier ELISA (Bolln et al. Reference Bolln, Zahner and Bauer2007). For East Frisia, a region in the north of the federal state of Lower Saxony with conditions similar to those in Schleswig-Holstein, prevalences between 45·1% and 57·1% were estimated for 2008 and 2010, analysing BTM samples with an ELISA based on excretory–secretory (ES) antigen (Kuerpick et al. Reference Kuerpick, Schnieder and Strube2012b). Fasciola hepatica seroprevalences in BTM samples were also reported for other European countries: 72% and 84% for England and Wales, UK, respectively (McCann et al. Reference McCann, Baylis and Williams2010a), and 37·3% for the region of Flanders, Belgium (Bennema et al. Reference Bennema, Vercruysse, Claerebout, Schnieder, Strube, Ducheyne, Hendrickx and Charlier2009). In the present study, BTM samples from regions distributed all over Germany were analysed with the ES ELISA to determine the seroprevalence in dairy herds in November 2008. Furthermore, a geographical information system (GIS) was used to determine regional prevalence differences as well as to identify potential risk factors for Fasciola infections.
MATERIALS AND METHODS
Study area
The study was conducted in Germany (Central Europe, surface area of 357 123 km2). Most of Germany has a temperate seasonal climate. In the east, the continental influence is stronger; summers can be less rainy and winters cold. In the north and north-west of Germany, the climate is oceanic, with mostly cool summers and mild winters. Central and southern Germany are transition regions which vary from moderately oceanic to continental climate. The mean annual temperature for Germany is 8·2 °C and the mean annual precipitation is 789 mm (http://en.wikipedia.org/wiki/Germany; http://de.wikipedia.org/wiki/Deutschland#Klima). In 2008, 99 431 dairy farms with 4 229 138 dairy cows were counted by the State Office for Statistics in Germany (https://www.destatis.de). In 2009 1 754 800 dairy cows (out of 4 169 349) were turned out to pasture (data from 2008 were not available from the State Office for Statistics, Germany). Detailed data for German federal states are listed in Table 1.
Table 1. Bulk tank milk (BTM) ELISA results and dairy cattle data (The table lists F. hepatica-antibody positive and negative BTM samples, resulting prevalences for the federal states of Germany and data on dairy cattle obtained by the German State Office for Statistics. As the number of pastured dairy herds was available for 2009 only, the number of dairy farms was also related to 2009.)

Study design and collection of BTM samples
The aim of the study was to assess the seroprevalence of F. hepatica in dairy cows in Germany in 2008. In total, 20 749 BTM samples were collected from all federal states (Brandenburg and the city state of Berlin were handled as a single federal state and samples originating from the city states Hamburg and Bremen were assigned to Lower Saxony) in November 2008, in cooperation with dairy factories and state dairy quality control associations (‘Landeskontrollverbände’). The milk samples had been taken by the dairy factories and state dairy quality control associations for routine checks. They were representative of their regular customers, although the dairy farms participating in the study were not selected by a strict random process. Sample preservation was achieved with 10% boric acid or sodium acetate, added by the dairy factories or state quality control associations. Samples were picked up at the facilities or sent to the Institute for Parasitology, University of Veterinary Medicine, Hannover. After arrival, the samples were centrifuged at 2000 g for 15 min. Afterwards, the superficial fat layer was removed and the milk was aliquoted and stored at −20 °C until use.
The samples were attributed to the respective postal code area of the dairy farm because full addresses were not made available due to data protection. If 2 or more samples were taken from one farm, only the sample with the lowest coefficient of variation of duplicate measures was included in the analysis. Samples that could not be attributed to a postal code and those which were available twice were excluded from further analysis. The postal codes were related to the German federal states. Due to the fact that some postal code areas fall within the territory of more than one federal state, 34 bulk milk samples could not unambiguously attributed to a single federal state. These samples were excluded from the calculations of the prevalence estimates for the respective federal states. In all, 802 samples were excluded and 19 947 BTM samples were included in the analysis. The number of submitted samples per federal state varied from 92 from Brandenburg/Berlin as the lowest to 9840 from Lower Saxony as the highest. Detailed sample numbers per federal state are listed in Table 1. Figure 1 shows the distribution of sample numbers over Germany. Altogether, 2461 postal code areas were sampled, with between 1 and 174 farms per area.

Fig. 1. Map of Germany with the number of sampled farms per postal code area. The yellow (white in black-and-white image) colour marks postal code areas which were not sampled. Federal states are abbreviated as follows: B = Berlin, BAV=Bavaria, BR=Bremen; BRA=Brandenburg, BW=Baden-Württemberg, H=Hamburg, HE=Hesse, LS=Lower Saxony, MWP=Mecklenburg-Western Pomerania, NRW=North Rhine-Westphalia, RP=Rhineland-Palatinate, S=Saarland, SA=Saxony-Anhalt, SAX=Saxony, SH=Schleswig-Holstein, T=Thuringia.
Production of F. hepatica ES antigen and ELISA procedure
The production of ES antigens and the ELISA were performed as described previously (Kuerpick et al. Reference Kuerpick, Schnieder and Strube2012b). Results were expressed as optical density ratio (ODR) using the following formula: ODR=(Mean OD test sample−Mean OD negative control)/(Mean OD positive control−Mean OD negative control).
According to Bennema et al. (Reference Bennema, Vercruysse, Claerebout, Schnieder, Strube, Ducheyne, Hendrickx and Charlier2009) herds with an ODR value ⩾0·8 are very likely to suffer production losses from fasciolosis. Therefore, BTM samples with an ODR of ⩾0·8 were considered as positive.
Geographic information system (GIS) analysis
Various spatial factors that may influence fasciolosis were tested for potential statistical associations with the ELISA results in logistic regression, supported by a GIS analysis that included the following data layers:
(1) The ODR value for each sampled farm with ODR ⩾ 0·8 as positive (‘1’) and < 0·8 as negative (‘0’).
(2) The postal code of each sampled dairy farm.
(3) Cattle and farm density as recorded in the Identification and Information System for Animals (Herkunftssicherung- und Informationssystem für Tiere, HIT, Munich, Germany).
(4) Climate raster data (1 km raster) for Germany from the German meteorological service (kindly provided by the Deutscher Wetterdienst, dwd, Offenbach, Germany): mean daily temperature per month (°C), mean precipitation per month and mean humidity per month. The variables temperature and precipitation were grouped in quarters for 2008: quarter one (Tm1q/P1q)): January to March, quarter two (Tm2q/P2q): April to June, quarter three (Tm3q/P3q): July to September, quarter four (Tm4q/P4q): October to December. For the purpose of all analyses reported here, temperature was normalized for altitude, which was also analysed as an independent factor.
(5) The proportion for each land-use class (agricultural crop land, forest and grassed area) per postal code area were derived from the Corine Land Cover (CLC; http://www.eea.europa.eu/data-and-maps; minimal resolution 200 m) database of the European Environment Agency, Copenhagen, Denmark and the high-resolution (overall precision ± 2·5 m) national land-survey vector database ATKIS (Amtliches topographisch-kartographisches Informationssystem, Bundesamt für Kartographie und Geodäsie, Frankfurt, Germany; http://www.geodatenzentrum.de).
(6) To take even the smallest ponds into account, ATKIS vector data were used to calculate the proportional surface of lentic water bodies within each postal code area.
Farm and cattle density, climate and land-use data were referred to postal code areas as the common spatial unit and maps were plotted using ArcGIS software (version 9.3.1; ESRI, Redlands, CA, USA). The measurement unit in the GIS was 1 m2 using a Transversal Mercator Projection with Bessel Ellipsoid. To determine the land-use composition of the postal code areas, an overlay analysis was performed by intersecting the postal code areas with the CLC and ATKIS data as described by Longley et al. (Reference Longley, Goodchild, Maguire and Rhind2001).
Statistical analysis
All statistical analyses were carried out using R (http://www.r-project.org/; including the libraries MASS, glmmML, lme4). First, all variables (cf. section ‘GIS analysis’) were individually tested against the ELISA result. A multiple logistic regression model was then created, which included the variables cattle density, water bodies, grassed area (ATKIS), agricultural crop land (CLC), forest area (CLC), altitude, temperature and precipitation. Stepwise model building with automated forward and backward selection of variables followed, after which manually controlled stepwise modelling was carried out. In a final step, a general linear mixed model with random intercept was set up on postal code level, Pseudo-R 2 values were calculated and residuals analysed to detect possible ‘hidden’ information, which may have had a major influence on the ELISA results. The predictive performance of models was compared by analysing receiver operating characteristics (ROC) as described by Pearce and Ferrier (Reference Pearce and Ferrier2000) and the respective areas under curve (AUC) determined.
RESULTS
Prevalence of F. hepatica in Germany and ODR distribution
The prevalences in sampled regions of the German federal states ranged from 2·6% in Saxony-Anhalt to 38·4% in Schleswig-Holstein. On average, antibodies against F. hepatica were found in 23·6% of sampled farms. High prevalences were found in the north and north-west of Germany with 38·4% in the sampled areas of Schleswig-Holstein and 29·4% in Lower Saxony. The lowest prevalences were found in the federal states of Saxony with 4·4% and Saxony-Anhalt with 2·6%. Detailed results on BTM seroprevalences are listed in Table 1.
Figure 2 shows the distribution of positive and negative BTM samples throughout Germany. Resulting prevalences for the sampled postal code areas (no. of positive samples/no. of samples per postal code area) are shown in Fig. 3. Highly positive areas were found in Schleswig-Holstein and the north of Lower Saxony as well as in the southern part of Bavaria. The overall ELISA ODR distribution, which was skewed to the left, is shown in Fig. 4.

Fig. 2. Map of Germany illustrating the distribution of positive (red dots) and negative BTM-samples (blue dots). The white colour marks sampled postal code areas, while the yellow colour marks postal code areas which were not sampled. Federal states are abbreviated as follows: B=Berlin, BAV=Bavaria, BR=Bremen; BRA=Brandenburg, BW=Baden-Württemberg, H=Hamburg, HE=Hesse, LS=Lower Saxony, MWP=Mecklenburg-Western Pomerania, NRW=North Rhine-Westphalia, RP=Rhineland-Palatinate, S=Saarland, SA=Saxony-Anhalt, SAX=Saxony, SH=Schleswig-Holstein, T=Thuringia.
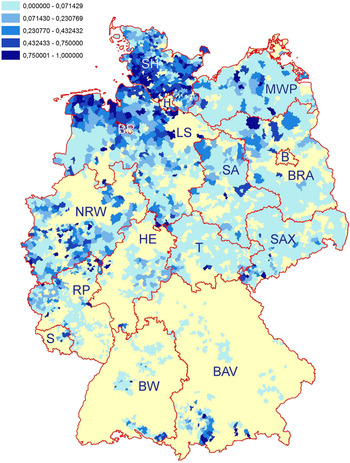
Fig. 3. Prevalences in postal code areas (No. of positive samples/No. of samples per postal code area). The yellow (white in black-and-white image) colour marks postal code areas which were not sampled. Federal states are abbreviated as follows: B=Berlin, BAV=Bavaria, BR=Bremen; BRA=Brandenburg, BW=Baden-Württemberg, H=Hamburg, HE=Hesse, LS=Lower Saxony, MWP=Mecklenburg-Western Pomerania, NRW=North Rhine-Westphalia, RP=Rhineland-Palatinate, S=Saarland, SA=Saxony-Anhalt, SAX=Saxony, SH=Schleswig-Holstein, T=Thuringia.

Fig. 4. Fasciola hepatica ES ELISA ODR value distribution of all examined BTM samples. The dashed line marks the cut-off value of 0·8 ODR.
Statistical analysis
Bivariate comparison
The results of the bivariate testing of the variables of interest vs the ELISA results are shown in Table 2. Humidity was not included in the analysis due to low differences between months. The remaining variables revealed a statistically significant association (P = ⩽0·05) with the ELISA results. A positive correlation was found for the variables cattle density, farm density, water bodies and grassed area, whereas agricultural crop land, forest area and altitude revealed a negative correlation. Temperature was analysed first for each quarter and revealed a negative correlation for Tm1q, Tm2q and Tm3q, whereas Tm4q showed a positive correlation. When analysing all quarters together, Tm2q and Tm3q revealed a negative correlation, whereas Tm1q and Tm4q were positively correlated with the ELISA results. Concerning precipitation, a positive correlation was found for P2q and a negative correlation for P1q, P3q and P4q when analysing each quarter separately. Analysing all quarters together revealed a negative correlation for P1q and P2q and a positive correlation for P3q and P4q.
Table 2. Results of the bivariate logistic regression

* Statistically significant (P⩽ = 0·05).
Multivariate comparison
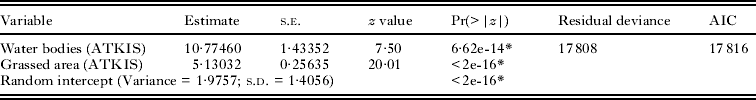
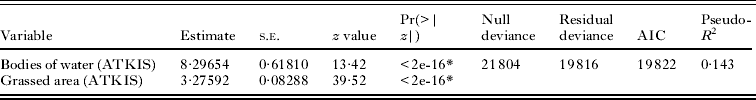
Based on the results of the bivariate statistical comparisons, the following variables were included in the full multivariable logistic regression model: cattle density, water bodies, grassed area (ATKIS), agricultural crop land, forest area, altitude, temperature (all quarters) and precipitation (all quarters). The results are shown in Table 3. The model revealed a statistically significant impact of the variables cattle density, water bodies, grassed area, agricultural crop land, height, Tmq1, P2q and P3q with a pseudo-R 2 of 0·223 (Table 3). The manually controlled stepwise forward and backward selection of variables included in the logistic regression model revealed that the most parsimonious model, which explained most of the variation, included the variables water bodies and grassed area, both of which had a positive parameter estimate with a pseudo-R 2 of 0·143 (Table 4). Akaike's Information Criterion (AIC) was calculated for each model and used as the main selection parameter. Altitude was retained as an explanatory variable in all models in which climate variables had a statistically significant influence.
Table 3. Results of the multivariate analysis by logistic regression, full model

* Statistically significant (P⩽ = 0·05).
Table 4. Results of the multivariate analysis by logistic regression, full model, final model after controlled stepwise selection
* Statistically significant (P = ⩽0·05).
General linear mixed model with Random Intercept
It was assumed that farms with the same postal code were located in a similar environment and experienced the same climatic conditions. To minimize the effects of variables that were not independent, a model with random intercept on the postal code level was created, which focused on the variables water bodies and grassed areas. This model revealed that the ELISA results were correlated with the level of the postal code areas (Table 5).
Table 5. General linear mixed model with random intercept

* Statistically significant (P=⩽0·05).
The full model, the model obtained by manually controlled stepwise forward and backward selection of variables and the general linear mixed model were compared by ROC analysis (Pearce and Ferrier, Reference Pearce and Ferrier2000). The full model yielded an AUC of 0·76. This value was only marginally higher than the AUC values for the finally selected logistic regression model (AUC 0·71). Including spatial information in the model (general linear mixed model) led to an improvement of the AUC to 0·86 (Supplementary Fig. S1 – in Online version only).
DISCUSSION
The present study is the first to determine the seroprevalence of F. hepatica in BTM samples in the whole of Germany at one time-point. About 20 000 bulk milk samples from all over Germany were collected in November 2008 and analysed for antibodies against the liver fluke with an ELISA based on ES antigen (Charlier et al. Reference Charlier, Duchateau, Claerebout, Williams and Vercruysse2007; Kuerpick et al. Reference Kuerpick, Schnieder and Strube2012b). Sensitivity and specificity of this ELISA are 96% and 80%, respectively, to detect herds with an in-herd prevalence of more than 25% (Charlier et al. Reference Charlier, Duchateau, Claerebout, Williams and Vercruysse2007). Obtained ES ELISA results were examined for associations with different spatial factors that may be associated with fasciolosis.
The mean F. hepatica-seroprevalence for all BTM samples from Germany was 23·6%. The true prevalence may have been even higher since an ELISA cut-off at the ODR value of 0·8 was chosen to identify herds that are likely to suffer production losses due to fasciolosis (Bennema et al. Reference Bennema, Vercruysse, Claerebout, Schnieder, Strube, Ducheyne, Hendrickx and Charlier2009). Therefore, it is possible that herds with a low F. hepatica in-herd prevalence were not detected as positive. By contrast, due to the low specificity of 80%, there might have been false positive results, which may have led to an overestimate of the seroprevalence. The estimated prevalences in the sampled regions of the German federal states showed spatial differences: highest prevalences were found in the north and north-west with 38·4% in Schleswig-Holstein and 29·4% in Lower Saxony. The high prevalence in Schleswig-Holstein is in accordance with former studies of Bolln et al. (Reference Bolln, Zahner and Bauer2007), who estimated a seroprevalence of 50% by use of BTM samples. However, prevalence differences even within individual federal states or regions should not be underestimated when comparing data. For example, Bennema et al. (Reference Bennema, Vercruysse, Claerebout, Schnieder, Strube, Ducheyne, Hendrickx and Charlier2009) reported an overall percentage of 37·3% F. hepatica BTM-positive dairy herds for the region of Flanders, Belgium, but found 3 positive geographical clusters having a significantly higher relative F. hepatica risk compared with the rest of Flanders, whereas 4 clusters had lower relative risks. For the German region East Frisia, which is located in the north of the federal state Lower Saxony, Kuerpick et al. (Reference Kuerpick, Schnieder and Strube2012b) reported a seroprevalence of 53·9% in November 2008. This is 1·8 times more than the seroprevalence of 29·4% found for the whole of Lower Saxony in the present study. Regional differences might be due to different geographical conditions – East Frisia and Schleswig-Holstein are coastal regions and therefore have moist soils – and different percentages of pastured dairy herds (cf. Table 1). Other important factors influencing prevalence results within the unit ‘federal state’ are the number of samples and geographical coverage since BTM samples could not be selected and collected randomly but were provided by cooperating dairy factories and state dairy quality control associations. The contributing farms were therefore not evenly distributed in the different federal states. The percentage of 32·2% F. hepatica seropositive dairy herds reported by Koch (Reference Koch2005) for Bavaria is approximately twice the percentage of 17·7% found in the present study, in which only low area coverage was achieved. And indeed, in the Bavarian alpine uplands, for which Koch (Reference Koch2005) reported a prevalence of 64·5%, highly positive areas were found (cf. Fig. 2). Thus, differences between individual German federal states need to be interpreted with caution, as in cases of low sample numbers and/or geographical coverage (e.g. Bavaria, Baden-Württemberg and Hesse; cf. Fig. 1) the estimated prevalence can only provide an indication of the epidemiological situation in these areas.
To determine risk factors associated with fasciolosis, different variables were examined for statistically significant associations with the ELISA results by bivariate testing and logistic regression. Due to the large number of datasets available for analysis, statistically significant associations could be shown for most of the tested variables, although the influence of many parameters, including temperature and precipitation, was minor. Positive associations with coefficients >2, i.e. risk factors for F. hepatica seropositivity, were found for the variables cattle density, water bodies and grassed area, whereas agricultural crop land, forest area and altitude revealed negative coefficients <−2, indicating ‘protection’ against F. hepatica seropositivity. Temperature and precipitation showed a statistically significant association with seropositivity to F. hepatica in the bulk milk samples, but the strength of the association was low. This is in contrast to the study by Mitchell (Reference Mitchell2002) who assumed that summer rainfall and milder weather influenced higher prevalences of fasciolosis and to that of Bennema et al. (Reference Bennema, Ducheyne, Vercruysse, Claerebout, Hendrickx and Charlier2011), who found annual rainfall to be a significant predictor for fasciolosis. Kantzoura et al. (Reference Kantzoura, Kouam, Demiris, Feidas and Theodoropoulos2011) found NDVI (normalized difference vegetation index), which includes factors like temperature and rainfall, to be the most significant risk factor for fasciolosis and also McCann et al. (Reference McCann, Baylis and Williams2010a) observed rainfall and temperature as consistently important predictors of an infection. By contrast, temperature and rainfall have no major impact on the F. hepatica seroprevalence in Germany, as the spatial variation of these variables is relatively low in all areas.
The full GLM model (cf. Table 3) explained only 22·3% of the variation of the ELISA results. The most parsimonious model included only the variables water bodies and grassed area. This can be explained by the life cycle of F. hepatica: the intermediate host G. truncatula is an amphibious snail, which needs sufficient moisture (Boray, Reference Boray, Gaafar, Howard and Marsch1985) as supplied by rivers, creeks and also by minor moist areas, for example wet spots near watering places. The variable ‘grassed area’ was included in the model to show potential pastures. So, the association of positive ELISA results with these areas is in accordance with our current understanding of the biology of F. hepatica as infections of dairy cows with this parasite occur on pastures and, with few exceptions (e.g. feeding of freshly mown grass or insufficiently dried hay) not when kept indoors. The federal states with the highest prevalences – Schleswig-Holstein, Lower Saxony, North Rhine-Westphalia and Bavaria – kept 66·4% of all dairy cows in Germany in 2008. Keeping dairy cows on pasture is the common way of dairy farming in Schleswig-Holstein, Lower Saxony and North Rhine-Westphalia. In Bavaria, less than 20% of dairy farms keep their cows on pasture. As we do not know the number of samples provided by zero-grazing farms, the true seroprevalence for dairy cows on pasture in Bavaria may be considerably higher.
The final model revealed a Pseudo-R 2 of 0·143 while the model including all variables showed a Pseudo-R 2 of 0·223. By contrast, spatial models developed for liver fluke exposure in dairy herds in England and Wales explained more than 70% (R 2 between 0·73 and 0·79) of the ELISA variation (McCann et al. Reference McCann, Baylis and Williams2010b). The low values of the present study indicate that other variables not included in our analysis have a major impact on the F. hepatica seroprevalence or that there is a major random effect. Such variables may be geographical factors like slope, soil pH or the soil mineral iron, which McCann et al. (Reference McCann, Baylis and Williams2010b) found to be negative predictors for F. hepatica infections, whereas phosphorus was a positive predictor. The authors suppose that these minerals may be associated with snail biology and the liver fluke life cycle. Slope may indirectly influence the fluke's life cycle by better drainage and thus fewer suitable snail habitats (McCann et al. Reference McCann, Baylis and Williams2010b). Similar to England and Wales, Germany is not a uniform area in terms of geographical features and climatic conditions. Despite the fact that our model takes local similarities on the postal code level into account, it does not reflect differences that might exist on the regional or country level. A spatial model reflecting the neighbourhood and distance between sampled farms could be developed, but the data did not permit the building up of a neighbourhood matrix due to the lack of consistent sampling of postal code areas in space. The problem of limited variation explained by the models may be partially caused by a strong spatial random effect not considered in the current models. Bennema et al. (Reference Bennema, Ducheyne, Vercruysse, Claerebout, Hendrickx and Charlier2011), who investigated climatic and environmental factors as well as management factors, concluded that pasture management factors are key drivers of the infection risk. They propose 4 factors: mowing of the fields, proportion of grazed grass in the diet, length of grazing season and herd size. Further management factors were found by Charlier et al. (Reference Charlier, Duchateau, Claerebout, Williams and Vercruysse2011), who used a linear regression model which explained 85% of the observed variation with the variables number of potential habitats, presence of snail, drainage of pastures, months of turnout of the cows, stocking rate as well as type of watering place and risk area. In the present study, samples were provided without farm data for reasons of data protection, so that management factors could not be included in the analysis. Furthermore, the inaccuracy incurred by aggregating data on the level of postal code areas instead of the precise location of the farms may have been an important factor, which may have substantially limited the coefficients of determination of the models.
Overall, about one quarter (23·6%) of all examined German dairy herds was positive for antibodies against F. hepatica. Apparently, on many farms fasciolosis in dairy cows is not recognized as a health or production problem. This may also be due to the fact that information on liver condemnations at the slaughterhouses is not available to the farmers. Kraneburg (Reference Kraneburg1992) mentioned that German farmers often did not recognize an infestation and even if they did, a consequent treatment of the whole herd was often omitted because of withdrawal times. Also Runge (Reference Runge1992) stated that dairy cows were not treated because of withdrawal times and that knowledge about the damage due to fasciolosis diminished. This is in accordance with observations in Switzerland, where interviews with farmers revealed that most of them were not aware of the economic importance of bovine fasciolosis (Schweizer et al. Reference Schweizer, Hassig and Braun2005b). In fact, liver fluke treatment of dairy cows is still problematic in Germany. Albendazole, the only compound registered for dairy cows, has a milk withdrawal period of 5 days. Furthermore, it is only effective against adult flukes, whereas triclabendazole, which is effective also against juvenile stages, is not licensed for dairy cows producing milk for human consumption in Germany. Therefore, even if farmers decided to treat their herds once after housing with albendazole, the infection within the herd might persist. Targeted treatment of individual animals is effective to reduce their parasitic load, but at the herd level, this strategy will be ineffective (Knubben-Schweizer et al. Reference Knubben-Schweizer, Ruegg, Torgerson, Rapsch, Grimm, Hassig, Deplazes and Braun2010b). Studies in Switzerland revealed that a control strategy based on the specific epidemiological situation of the individual farm can significantly reduce egg shedding and seroprevalence. Furthermore, advice and support from the veterinarian are of crucial importance for the farmer's compliance (Knubben-Schweizer et al. Reference Knubben-Schweizer, Ruegg, Torgerson, Rapsch, Grimm, Hassig, Deplazes and Braun2010b).
In conclusion, the present study revealed statistically significant positive associations between the proportion of grassed area and water bodies and positive F. hepatica BTM ELISA results via GIS analysis. By contrast to other studies conducted in other temperate European countries (McCann et al. Reference McCann, Baylis and Williams2010a; Bennema et al. Reference Bennema, Ducheyne, Vercruysse, Claerebout, Hendrickx and Charlier2011; Kantzoura et al. Reference Kantzoura, Kouam, Demiris, Feidas and Theodoropoulos2011), the variables temperature and rainfall show little variation within Germany and thus revealed no major impact on the F. hepatica seroprevalence. This highlights the importance of developing individual models for different countries or regions as models developed for a specific country do not seem to be interchangeable within the same climatic zone. Fasciolosis is a persistent or re-emerging problem in cattle farming with about every fourth dairy herd testing seropositive in Germany. Veterinarians but also farmers should be aware of this high prevalence. Routine monitoring of herd infection levels, e.g. by BTM ELISA screening, is necessary to prevent or at least reduce the economic impact of the parasitosis. Control programmes should be based on the local situations in agreement with both farmers and veterinarians, and should integrate farm and pasture management as well as anthelmintic treatment.
ACKNOWLEDGEMENTS
The authors wish to thank the farmers, dairy factories and state control associations for providing BTM samples, and Anne-Marie Schunn for collection of samples.
FINANCIAL SUPPORT
This work was partly supported by Novartis Animal Health.